A Case Study on the Development of an Elevated Subsidence Inversion Over a Surface Low Pressure System
Kyung-Eak Kim
1,*, Hye-Young Ko
2, Bok-Haeng Heo
3, and Kyung-Ja Ha
41
Department of Astronomy and Atmospheric Sciences, Kyungpook National University, Daegu 702-701, Korea
2
National Institute of Meteorological Research, Seoul 156-720, Korea
3
Korea Meteorological Administration, Meteorological Advancement Council, Seoul 156-720, Korea
4
Division of Earth Environmental System, Pusan National University, Busan 609-735, Korea
Abstract: This study presents the development of an elevated subsidence inversion over a surface low pressure system, which was formed along the Changma front or Meiu-Baiu front. The results of our analysis strongly suggest that the inversion is dissimilar to those formed in anticyclonic situations but is instead similar to the onion-shaped sounding found in wake low. The present analysis indicates that the observed elevated inversion resulted from the intrusion of stratospheric air associated with tropopause folding.
Keywords: onion-shaped sounding, surface low pressure system, tropopause folding
Introduction
Subsidence inversion is defined as a type of inversion in which temperature increases with height;
it is produced by the adiabatic warming of a layer of subsiding air, according to the Glossary of Meteorology (Glickman, 2000). Subsidence inversions usually occur in anticyclonic areas where the air aloft sinks and is warmed by compressional heating (Chen and Hui, 1992). They can also form in the lee of mountain ranges (Oke, 1987; Aguado and Burt, 2004). The inversions which form in anticyclonic areas are occasionally called high-pressure inversions because they tend to develop over the surface high pressure system (http://irina.eas.gatech.edu/lectures/lect18.html).
High-pressure inversions are sometimes observed at the surface, but they are commonly observed aloft.
The characteristics and development processes of a high-pressure inversion are well described in many textbooks on meteorology (e.g., Moran and Morgan, 1997; Lutgens and Tarbuck, 1995; Ahrens, 2009). We have studied a recent Mesoscale Convective Complex (MCC) that developed in the region of a surface low
pressure system (Ko, 2008). The low pressure system was formed along a Meiyu-Baiu front, which is a type of stationary front usually developing during the rainy period of the East Asia Summer Monsoon (Ninomiya, 2004). Over the region of the low pressure system, an elevated subsidence inversion was observed on 3 July 2007. The inversion is very similar to the “onion- shaped” sounding, which was observed in post-squall regions in the Atlantic Ocean (Zipser, 1977). It has been reported that the onion-shaped sounding, which generally forms an elevated inversion. is occasionally observed in mesoscale convective complex (Leary and Rappaport, 1987) and tropical and mid-latitude squall lines (Johnson and Hamilton, 1988). The development mechanism of the onion-shaped soundings has been explained by advection of a well mixed air over preexisting boundary layer (Adams, 2003) and by the result of warming and drying occurring within descending rear-inflow jet in wake low (Johnson. and Hamilton, 1988). However, explanations for the onion- shaped soundings are incomplete because they still need more physical evidences based on observations and dynamical analysis.
The present case of an elevated subsidence inversion is considered unusual because it is observed in a cyclonic area in a mid-latitude region rather than in an anticyclonic area. Here we present a case study of the
NOTE
*Corresponding author: [email protected]
*Tel: 82-53-950-6362
*Fax: 82-53-950-6359
532
Kyung-Eak Kim, Hye-Young Ko, Bok-Haeng Heo, and Kyung-Ja Haobserved near-surface subsidence inversion that developed over the surface low pressure system. The characteristics and formation of the inversion are explained in detail, based on the analysis of atmospheric soundings, surface weather map, and potential vorticity distribution in the region. The results of our study strongly suggest that the observed elevated inversion was formed by an intrusion of stratospheric air during tropopause folding.
Data and Analysis
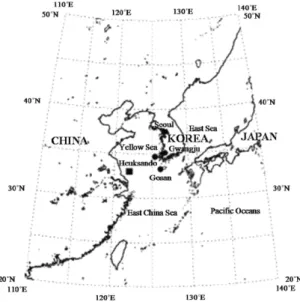
The meteorological conditions and development of the elevated subsidence inversion were analyzed from the two data sources: meteorological data from the Korea Meteorological Administration (KMA) and the National Centers for Environmental Prediction (NCEP) global reanalysis data. The surface observation data, weather maps and atmospheric soundings at Gosan, Heuksando, and Gwangju stations (Fig. 1) were obtained from the KMA. The surface observation data are used to examine atmospheric condition before and after the passage of MCC over Gosan station. The sounding data are used to analyze the heights of the subsidence inversion and its strength. Further, the surface weather map is employed to examine the synoptic conditions under which the subsidence inversion developed.
The NCEP global reanalysis data set is used to analyze temporal variation of potential vorticity, potential temperature, and wind. The data are composed of air temperature and relative humidity, including wind at 21 pressure levels (1000, 975, 950, 925, 900, 850, 800, 750, 700, 650, 600, 550, 500, 450, 400, 350, 300, 250, 200, 150 and 100 hPa). The temporal and spatial resolutions of the data are respectively 6 hours and 1.0 degree (about 100 km) with respect to both longitude and latitude.
The potential vorticity (PV) is calculated under an assumption of frictionless, adiabatic flow, using the following equation (Hoskins et al., 1985).
(1)
where g denotes the earth’s gravitational acceleration, p pressure, f Coriolis parameter,
θ potential temperature,and the vertical component of relative vorticity evaluated on an isentropic surface. The PV is expressed in units, PVU, or “Potential Vorticity Unit”
(1 PVU: 10
−6m
2Kkg
−1s
−1). We used the definition for the dynamic tropopause as the height where the PV has 1.6 PVU (WMO, 1986). The vertical and horizontal distributions of PV are analyzed to examine a possible link between the development of the subsidence inversion and intrusion of the stratospheric air during the tropopause folding associated with the surface low.
Analysis results
Figure 2 shows temporal variation of air temperature, relative humidity, wind, and rainfall intensity which were observed at Gosan station from 1200 UTC 3 to 0000 UTC 4 July 2007. The data in Fig. 2 were obtained at ten minute intervals. Upper panel in Fig. 2 displays temporal variation of air temperature, relative humidity and rainfall intensity. Lower panel shows changes of wind speed and wind direction with time.
PV = – ς g (
θ+ f )∂θ ∂p ---
ς
θFig. 1. Geographical location of Gosan, Heuksando and Gwangju stations for atmospheric sounding of subsidence inversion. The initial occurrence position of the MCC is located in the Yellow Sea and is marked by a black square.
Rectangular sector bounded by heavy solid lines represents the period of passing of the MCC over Gosan station from 1730 UTC to 2000 UTC 3 July.
According to the temporal variation of rainfall intensity in the upper panel, there are two rainfall events: one with low rainfall intensity with maximum of 4.5 mm/hr before the passing of the MCC and the other with high rainfall intensity with maximum of 38.5 mm/hr during the passage of the MCC. During the first rainfall event (1200 to 1630 UTC), the humidity shows its small fluctuation within the range of 93.7% to 95.7%. During the second event (1730 to 2000UTC), however, the humidity significantly changes from 91.5% to 96%. During the first event, the temperature variation roughly shows a pattern of cosine curve: the temperature is about 22
oC at the beginning of the rainfall (1200 UTC), 21
oC at the mid-phase (1400 UTC), and about 22.4
oC at the end phase (1620 UTC). The temperature increases with time during the second period, and the mean temperature is 22.6
oC for the period.
The plots of winds in the lower panel indicate that during the first event, the speed roughly increases with a linear tendency even though there are some fluctuations. The average wind speed in this event is 6.0 ms
−1. During the second rainfall event, the wind speed variation has the same tendency as in the first event except for having higher average wind speed of 10.1 ms
−1. During the first event, the variation of wind direction is relatively small, ranging from 142.7
oto 162.6
o. However, the wind direction significantly changes from 157.9
oto 274.5
oduring the second rainfall event.
Figure 3 shows three atmospheric soundings which
are taken at Gosan station (33.28
oN, 126.17
oE) during
an intensive observation of Meiyu-Baiu front. The
soundings are taken at six hour intervals, from 1200
UTC 3 July to 0000 UTC 4 July 2007. Figure 3a
represents the vertical profiles of air temperature and
dew-point temperature before the passing of the MCC
over Gosan station. As shown in the figure, there is
no elevated inversion in the figure. The sounding in
Fig. 2. Time series plots of temperature, relative humidity, wind and rain rate observed at Gosan Station (3 July 2007). The plots of temperature (solid line), relative humidity (dashed line) and rain rate (vertical bar) are given in upper panel. The plots of wind speed (dash-dotted line) and wind direction (thick dotted line) are given in lower panel. The region by bounded in a rect- angular box region in the figure represents the period for which the MCC passed Gosan weather station.534
Kyung-Eak Kim, Hye-Young Ko, Bok-Haeng Heo, and Kyung-Ja HaFig. 3b was made during the passage of the MCC over Gosan station. An elevated subsidence inversion is easily recognized from the profiles of temperature and dew-point temperature in Fig. 3b. The pressures at the base and top of the inversion are 926 hPa and 912 hPa, respectively. The inversion is very similar to the configuration of subsidence inversions given by Djuric (1994) and Adams (2003). The air temperature difference between the base and top is 1.6
oC over the height difference of 133 m. The dew-point depression at the base is 2.3
oC (relative humidity, 87%) while the
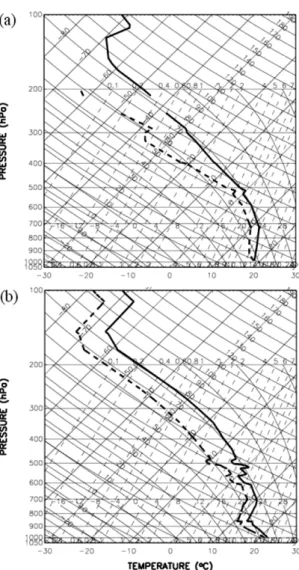
Fig. 3. Atmospheric sounding of Gosan station at (a) 1200,(b) 1800 UTC 3 and (c) 0000 UTC 4 July 2007. Solid and dotted lines denote temperature and dew-point temperature, respectively.
Fig. 4. Atmospheric sounding of (a) Heuksando and (b) Gwangju stations at 1800 UTC 3 July 2007. Solid and dot- ted lines denote temperature and dew-point temperature, respectively.
dew-point depression at its top is 6.0
oC (relative humidity, 69%). Air at the top of inversion layer is very dry, compared to the air at its base. However, the vertical profiles of temperature and dew-point above the inversion layer are quite different from those of typical subsidence inversions (Djuric, 1994; Adams, 2003). The curves of the temperature and dew-point temperature above the present inversion converge as height increases (Fig. 2), in contrast to the curves above the typical subsidence inversions which diverge
as height increases (Djuric, 1994; Adams, 2003).
Accordingly, we considered a possible link between the development of the inversion and intrusion of stratospheric air during the tropopause folding. Figure 3c shows atmospheric soundings at 0000UTC 4 July, corresponding to the time of four hours later from the passing of the MCC over Gosan. Station. As shown in Fig. 3c, there are two elevated inversions developed at the layers of 988 to 964 hPa and 898 to 858 hPa, respectively.
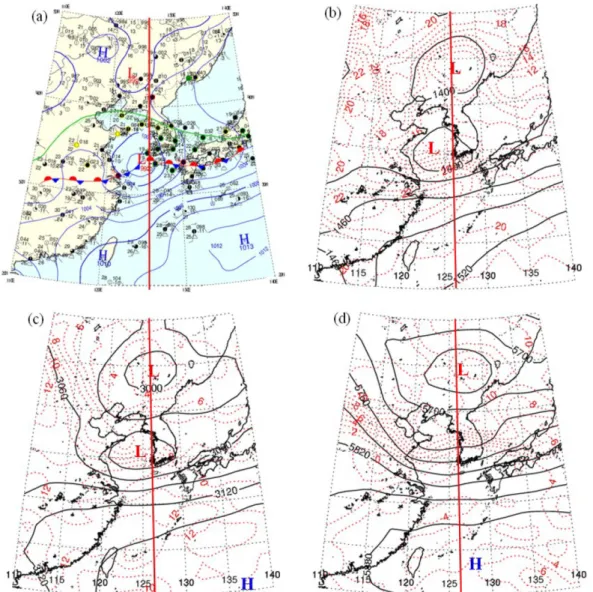
Fig. 5. Surface and upper-air weather charts at 1800 UTC 3 July 2007. (a) Surface, (b) 850 hPa, (c) 700 hPa and (d) 500 hPa.
In the upper level charts, the isopleths of geopotential height (solid black) are given in gpm and the dotted red lines are iso- therms (oC). A thick vertical red line in the figure denotes the longitude of 126oE.
536
Kyung-Eak Kim, Hye-Young Ko, Bok-Haeng Heo, and Kyung-Ja HaFigure 4 shows atmospheric soundings at Heuksando and Gwangju, taken at 1800 UTC 3 July. Heuksando is an Island in the Yellow Sea and Gwangju is located at the south western region of Korean Peninsula (see Fig. 1). As shown in the figure, there is no elevated inversion in both two soundings as found in Fig. 3b, even though Heuksando and Gwangju are within the boundary of the surface low pressure system, as shown in Fig. 5a. This indicates that the inversion observed at Gosan station was a very local one, which was developed by a physical process developed in a limited area.
The surface and upper-air synoptic conditions at
1800 UTC on 3 July 2007, under which the subsidence inversion was developed, are given in Fig. 5. The surface low pressure system formed on a typical Meiyu-Baiu front, located in the Yellow Sea off the south western region of the Korean Peninsula. The center of low pressure is located on the crest of the Meiyu-Baiu frontal wave and its central pressure is 997 hPa, as shown in Fig. 5a. It is found from Figs.
5b and 5c that the low pressure system extends from the surface up to 700 hPa. In Fig. 5d, however, there is no development of low pressure system at the region where the low pressure system is developed in Fig. 5c. This indicates that the nature of the low
Fig. 6. Enhanced infrared images from MTSAT-1R satellite at (a) 1400, (b) 1700, (c) 2000 and (d) 2300 UTC 3 July 2007.The mature MCC is given in (b) and (c).
pressure system is limited blow 500 hPa.
Figure 6 shows a time series of enhanced infrared images of MCC, obtained by MTSAT-1R satellites.
The MCC satisfies the criteria given by Jirak et al.
(2003). At its mature stage at 2000 UTC, the system has the following characteristics: 1) cold cloud region
≤ -52
oC with area ≥ 50000 km
2, 2) duration with size definition ≥ 6 h and 3) eccentricity ≥ 0.7 at time of maximum extent.
Figure 7 illustrates the vertical distributions of wind speed and potential temperature along the meridian at 126
oE. The thick solid line represents the dynamic tropopause of 1.6 PVU, based on the definition given by the WMO (1986). The region of PV greater than 1.6 PVU in the troposphere is usually regarded as an anomaly of PV, typically formed by an intrusion of stratospheric air during tropopause fold (Carson, 1991). As shown in Fig. 7, a region of PV anomaly is developed from 910 hPa to 450 hPa, and is inclined toward the north as it extends in the upward direction.
The pressure at the base of the PV anomaly region is about 913 hPa, almost the same as the pressure of the analyzed inversion top (912 hPa). This observation strongly suggests that the inversion layer formed by an intrusion of stratospheric air during tropopause folding. It is also noted from the distributions of
potential temperature that the isentropic surfaces of 300 K and 305 K show a strong slope down to the southward, which are limited to the regions immediately below and within the PV anomaly.
In Fig. 8, the distributions of wind vectors and region of the PV anomaly are presented on an isentropic surface of 305 K, where the latter has an
Fig. 7. Vertical cross section of wind speed (ms−1, solid line) and potential temperature (K, dash-dotted line) along 126oE at 1800 UTC 3 July 2007. Bold solid line denotes 1.6 PVU. ULJ and LLJ denote upper level jet and low level jet, respectively.Fig. 8. Distributions of wind vector and potential vorticity on an isentropic surface of 305 K at 1800 UTC 3 July 2007. Solid line enclosing the shade area denote above 1.6 PVU and arrows represent wind vectors.
538
Kyung-Eak Kim, Hye-Young Ko, Bok-Haeng Heo, and Kyung-Ja Haelliptical shape, and the eastern edge of the region is located at the southwestern boundary of the Korean Peninsula. The wind distribution around the anomaly has cyclonic rotation about the center of the PV anomaly (Fig. 8).
Conclusion
A case study has been made on the development of an elevated subsidence inversion over a surface low pressure system, based on the weather maps, atmospheric sounding and NCEP reanalysis data. The present study shows that the observed elevated inversion is very similar to the onion-shaped soundings given in the previous studies on MCC, and tropical and mid-latitude squall lines. The present analysis results strongly suggest that the subsidence inversion was formed by an intrusion of stratospheric air during the period of tropopause folding. However, more case studies are required to characterize clearly the elevated subsidence inversions which develop over surface low pressure regions.
Acknowledgments
The authors greatly thank an anonymous reviewer for his helpful comments on the manuscript. This study was supported by Korean Council for University Education, grant funded by Korean Government (MOEHRD) for 2008 Domestic Faculty Exchange.
The authors thank the Korean Meteorological Administration and NCEP for providing the data used in this study.
References
Adams, A.S., 2003, Atmospheric analysis in the atmo- sphere. In Potter, T.D. and Colman, B.R. (eds.), Hand- book of Weather, Climate and Water. Wiley- Interscience, 237-253.
Ahrens, C.D., 2009, Meteorology Today. (9th ed.), Brooks/
Cole, USA, 549 p.
Aguado, E. and Burt, J.E., 2004, Understanding Weather and Climate. (3rd ed), Prentice Hall, NJ, USA, 560 p.
Carson, T.N., 1991, Mid-latitude weather systems. Harper Collis Academic, NY, USA, 507 p.
Chen, Y.-L. and Hui, N., 1992, Analysis of a relatively dry front during the Taiwan Area Mesoscale Experiment.
Monthly Wheather Review, 120, 2442-2468.
Djuric, D., 1994, Weather Analysis. Prentice-Hall, NJ, USA, 304 p.
Glickman, T.S., 2000, Glossary of Meteorology. (2nd ed).
American Meteor Society, 855 p.
Johnson, R.H. and Hamilton, P.J., 1988, The relationship of surface pressure features to the precipitation and air- flow structure of an intense midlatitude squall line.
Monthly Wheather Review, 116, 1444-1472.
Hoskins, B.J., Mcintyre, M.E., and Robertson, A.W., 1985, On the use and significance of isentropic potential vor- ticity maps. Quarterly Journal of the Royal Meteorolog- ical Society, 111, 877-946.
Jirak, I.L., Cotton, W.R., and McAnelly, R.L., 2003, Satel- lite and radar survey of mesoscale convective system development. Monthly Wheather Review, 131, 2428- 2449.
Ko, H.-Y., 2008, A case study on formation mechanism of mesoscale convective complex along the Changma front. Master thesis (written in Korean), Kyungpook National University, Daegu, Korea, 58 p.
Leary, C.A. and Rappaport, E.N., 1987, The life cycle and internal structure of a mesoscale convective complex.
Monthly Wheather Review, 115, 1503-1527.
Lutgens, F.K. and Tarbuck, E.J., 1995, The Atmosphere.
(6th ed.), Prentice Hall, NJ, USA, 462 p.
Moran, J.M. and Morgan, M.D., 1997, Meteorology: The Atmosphere and the Science of Weather. (5th ed.), Prentice Hall, NJ, USA, 530 p.
Ninomiya, K., 2004, Large- and meso-scale features of Meiyu-Baiu front associated with intense rainfalls. In Chang, C.-P. (ed.), East Asia Monsoon. Vol. 2. World Sientific, 404-435.
Oke, T.R., 1987, Boundary Layer Climates. (2nd ed.), Methuen, UK, 435 p.
WMO (World Meteorological Organization), 1986, Atmo- spheric Ozone 1985: Global Ozone Research and Moni- toring Report. Rep. No. 16, WMO, Geneva Switzerland, 392 p.
Zipser, E.J., 1977, Mesoscale and convective–scale down- drafts as distinct components of squall-line structure.
Monthly Wheather Review, 105, 1568-1589.
Manuscript received: April 30, 2010 Revised manuscript received: July 8, 2010 Manuscript accepted: July 24, 2010