韓國水資源學會論文集 第47卷 第3號 2014年 3月 pp. 257~267
기후변화에 따른 우리나라 수문 기상학적 예측의 불확실성
Uncertainty of Hydro-meteorological Predictions Due to Climate Change in the Republic of Korea
은코모제피 템바 * / 정 상 옥 **
Nkomozepi, Temba / Chung, Sang-Ok
...
Abstract
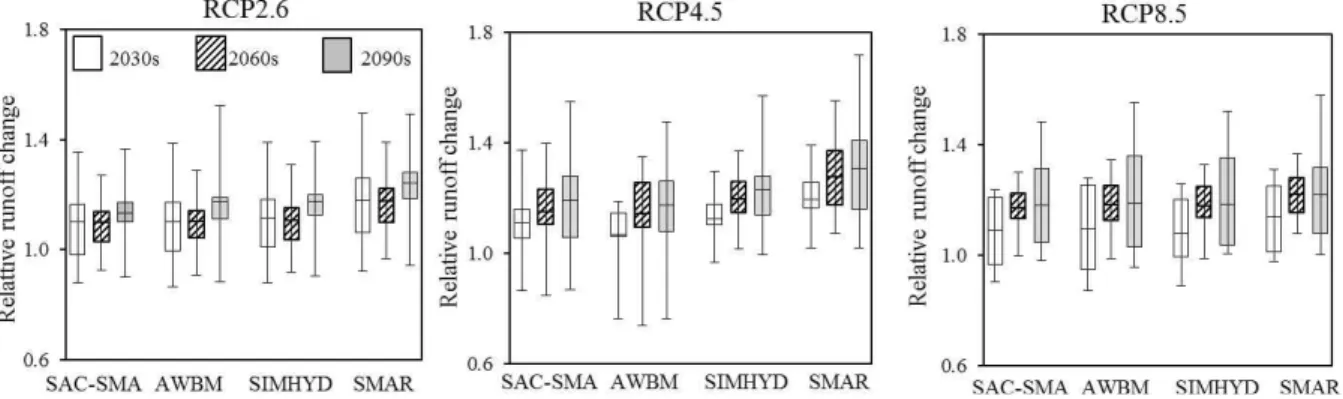
The impact of the combination of changes in temperature and rainfall due to climate change on surface water resources is important in hydro-meteorological research. In this study, 4 hydro-meteorological (HM) models from the Rainfall Runoff Library in the Catchment Modeling Toolkit were used to model the impact of climate change on runoff in streams for 5 river basins in the Republic of Korea. Future projections from 2021 to 2040 (2030s), 2051 to 2070 (2060s) and 2081 to 2099 (2090s), were derived from 12 General Circulation Models (GCMs) and 3 representative concentration pathways (RCPs). GCM outputs were statistically adjusted and downscaled using Long-Ashton Research Station Weather Generator (LARS-WG) and the HM models were well calibrated and verified for the period from 1999 to 2009. The study showed that there is substantial spatial, temporal and HM uncertainty in the future runoff shown by the interquartile range, range and coefficient of variation. In summary, the aggregated runoff will increase in the future by 10~24%, 7~30% and 11~30% of the respective baseline runoff for the RCP2.6, RCP4.5 and RCP8.5, respectively. This study presents a method to model future stream-flow taking into account the HM model and climate based uncertainty.
Keywords : climate change, uncertainty, water resources, GCM ensemble, rainfall-runoff model
...
요 지
기후변화에 따른 기온과 강수량의 변화가 지표수자원에 미치는 영향은 수문기상학 연구에서 매우 중요하다. 본 연구에 서는 기후변화가 우리나라 5대강 유역의 유출량에 미치는 영향을 분석하기 위하여 Catchment Modeling Toolkit의 네 가지 수문기상 모형을 사용하였다. 세 가지 RCP 시나리오에 대하여 12개 GCM 모형으로부터 미래 2021에서 2040까지(2030s), 2051에서 2070까지(2060s) 및 2081에서 2099까지(2090s) 기간에 대한 기후자료를 추출하였다. 이들 자료는 LARS-WG 방법 으로 상세화하였으며, 수문기상 모형들은 1999부터 2009까지의 관측자료를 이용하여 보정 및 검정하였다. 본 연구에서 미래 의 유출량은 사분위 범위, 전체 범위 및 변동계수 값이 시공간적으로 및 수문기상 모형에 따라서 큰 불확실성을 나타내었다.
종합적으로 볼 때 미래의 유출량은 기준년도에 비하여 RCP2.6, RCP4.5 및 RCP8.5 시나리오에 대하여 10~24%, 7~30%
및 11~30% 증가할 것으로 예상되었다. 본 연구는 수분기상모형과 기후변화 예측의 불확실성을 고려한 미래의 유출량을 모의할 수 있는 방법을 제시하였다.
핵심용어 : 기후변화, 불확실성, 수자원, GCM ensemble, 강우-유출 모형
...
* 전 경북대학교 농업토목공학과 박사과정 (e-mail: [email protected])
Former Ph.D. Student, Department of Agricultural Engineering, Kyungpook National University
** 교신저자, 경북대학교 농업토목공학과 교수 (e-mail: [email protected], Tel: 82-53-950-5734) Corresponding Author, Department of Agricultural Engineering, Kyungpook National University
J. KOREA WATER RESOURCES ASSOCIATION Vol. 47, No. 3:257-267, March 2014 http://dx.doi.org/10.3741/JKWRA.2014.47.3.257
pISSN 1226-6280 • eISSN 2287-6138
1. Introduction
The combination of changes in temperature and rainfall due to climate change have been predicted to have adverse effects on surface water supplies, riparian habitats and soil moisture levels resulting in an altered water balance, thus affecting hydrological resources and agriculture (Rivarola Sosa et al., 2011; Gardner, 2009).
The potential increase in the water demand for agricul- ture can be addressed by exploiting new sources of supply and reducing consumption to maintain sustain- able utilization of water resources (Shi et al., 2013). In any case, it is important to assess the impacts of climate change on water resources to better understand the potential effects and possible adaptation and mitigation measures. The possible effects of climate change on stream flow have been successfully estimated based on multivariate regressions between runoff and climate parameters in specific river basins (Gardner, 2009).
However, theoretical and practical challenges lie in the use of statistical methods because the changes in flow over time have a complex relationship with the indi- vidual river basin characteristics (e.g. basin geology and elevation) such that future climate scenarios may lie outside the ranges where the relationships are valid.
The climate change impacts on a river basin’s hydro- logy can be investigated using hydrological models forced by the rainfall and evaporation data derived from General Circulation Model (GCM) outputs corresponding to specific climate change scenarios (Chen et al., 2012).
Generally, future meteorological data such as tempera- ture, rainfall, wind speed, relative humidity, etc. are derived from GCM outputs which are then altered (i.e.
downscaled, statistically adjusted and bias corrected) to resolve the spatial resolution challenge (Eum et al., 2010). The structural complexity of the hydrological model to be selected is warranted by the objective of the assessment and available input data. Velázquez et al. (2013) noted that conceptual models can be used to rapidly assess the impact of different climate scenarios while physically based models can be used to assess the combined impacts of land-use and climate change.
Kim et al. (2013a) examined the impacts of climate
change and land use on the stream flow in the Hoeya River Basin, Republic of Korea using two Representa- tive Concentration Pathways (RCPs) and the Soil and Water Assessment Tool (SWAT), a physically based and semi-distributed model. In their study, the changes in stream flow under future conditions of climate and land use change were consistent with those in which only the climate changed. Alternatively, Lee et al. (2012) used the Stream flow Synthesis and Reservoir Regula- tion (SSARR) model, a conceptual rainfall-runoff model, to carry out a sensitivity analysis of the parameters related to the basin runoff in the Han River basin.
Deterministic assessments based on only one GCM or scenario are incomplete, but rather multiple climate or hydrological model scenarios should be used to obtain less uncertain results (Kling et al., 2012). By the same token, instead of selecting the “best” among the multiple scenarios, studies have shown that it is more comprehensive and more reliable to aggregate the fore- casts (Kim et al., 2006). The uncertainty of the impact of climate change reported in literature arises from the spatial disparities and the diversity of runoff modeling approaches. Bae et al. (2011) analyzed the uncertainty of the impacts of climate change on runoff in the Chungju Basin using 13 GCMs, 3 semi-distributed hydrological models, 7 ET methods and 3 SRES scenarios. The study showed significant uncertainty in runoff even under the same climate change simulations due to the different hydrological and ET models. Jeong et al. (2013) used one GCM and two Special Report on Emissions Scenarios (SRES) scenarios and predicted modest increases in runoff of 2.2% to 4.8% in the Chungju Basin with changes in potential evapotranspiration (ET) and soil moisture of +7.6 to +15.3% and -2.1% to -1.8%, respectively, for the 2080s. In another study, Sohn et al. (2014) used 3 GCMs and one SRES scenario and reported changes in runoff from -35% to +40% by the 2080s in Korea. Kim et al.
(2013b) used a weighting method, 4 GCMs and 3 SRES scenarios and reported monthly runoff increases of up to 58% in July and August and decreases of up to -66%
in October for the 2080s in Korea.
In summary, most of the recent studies predicted
runoff to increase as a result of climate change. However,
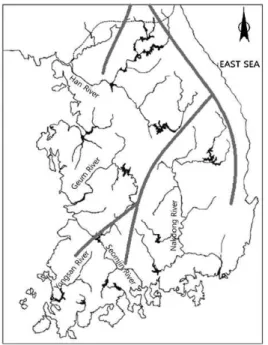
Fig. 1. Map of Mountain Ranges (thick line) and Major Rivers in Korea (Chung, 2013)
River Basin
Drainage area (km
2)
Basin average slope (%)
Shape
factor Circularity
ratio Elongation
ratio Drainage density
Channel segment frequency
altitude Max (m)
Han* 23,293 18.81 1.95 0.23 0.35 1.73 2.55 1,710
Nakdong 23,702 32.26 1.62 0.25 0.34 2.91 4.13 1,912
Geum 9,914 16.74 1.12 0.23 0.29 2.51 4.84 1,609
Seomjin 4,914 32.57 1.37 0.14 0.35 1.62 1.78 1,646
Yeongsan 3,470 20.91 1.15 0.23 0.49 1.44 1.44 1,177
*Excluding the area in North Korea. Source: www.wamis.go.kr
Table 1. Physical Characteristics of 5 Basins
the magnitudes of change differ significantly depending on modeling methodology including GCMs, downscaling, hydrological models etc. The objective of this study is to assess the contribution of hydrological models and GCMs to the uncertainty of the impact of climate change on runoff in the 5 major river basins in Korea. The study will use multiple plausible estimates of climate change with 4 hydrological models, a 12 GCM ensemble and 3 state of the art greenhouse gas concentration projectiles.
2. Material and methods 2.1 Study area
Korea lies in the Far East (Fig. 1) and there are five
major river systems in Korea that play an important role as a water resource for agriculture, industry and municipalities (Table 1). The average annual rainfall in Korea is 1,245 mm (ca. 1.4 times the global average).
However, due to the high population, average rainfall per capita is only 2,591 m
3(ca. 0.13 times the global average). In addition, 65% of the land is mountainous and the channel slopes of rivers are steep therefore Korea suffers significant seasonal, annual and regional variations of rainfall and runoff. Only ca. 58% of the total volume of water resources of 1,240 million m
3per annum is runoff in streams which is utilized in stream water, dam and groundwater usage. A large portion of the runoff (ca. 31%) flows to the West, South and East Seas (Ministry of Environment, http://http://eng.me.go.
kr/). Overall, about 99% of the inflow into the multi- purpose dams was discharged downstream within the same year over the period from 1999 to 2009 (Oh, 2013).
2.1 Study data
Daily climate data including temperature and rainfall for 1971 to 2009 were collected from the Korean Meteo- rological Administration database (www.kma.go.kr).
Daily runoff data from 1999 to 2009 for the 5 basins
were extracted from the Water Management Informa-
tion System (WAMIS) database courtesy of the Korea
Water Resources Corporation and the Ministry of Land,
Infrastructure and Transport. The period from 1971 to
2000 represents the baseline (reference period) and data
from 1999 to 2009 were used in the calibration and veri-
fication of the hydro-meteorological (HM) models. The
calibration and verification period was selected because
Model Modeling Center
ACCESS1.0 CSIRO (Commonwealth Scientific and Industrial Research Organisation, Australia), and BOM (Bureau of Meteorology, Australia)
BCC-CSM1 Beijing Climate Center, China Meteorological Administration CCSM4 National Center for Atmospheric Research
CNRM-CM5 Centre National de Recherches Meteorologiques / Centre Europeen de Recherche et Formation Avancees en Calcul Scientifique
FGOALS-G2 LASG, Institute of Atmospheric Physics, Chinese Academy of Sciences GFDL-CM3 Geophysical Fluid Dynamics Laboratory
GISS-E2 NASA Goddard Institute for Space Studies
HADGEM-ES Met Office Hadley Centre, Instituto Nacional de Pesquisas Espaciais, Korea Meteorological Administration
INMCM4 Institute for Numerical Mathematics IPSL-CM5A Institut Pierre-Simon Laplace
MIROC5 Atmosphere and Ocean Research Institute (The University of Tokyo), National Institute for Environmental Studies, and Japan Agency for Marine-Earth Science and Technology MRI-CGCM3 Meteorological Research Institute
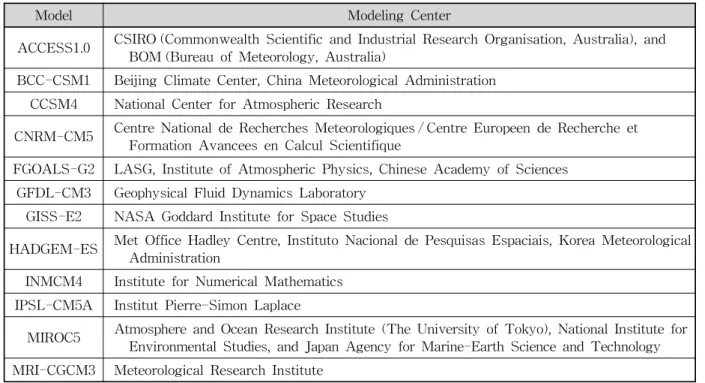
Table 2. Selected GCMs
it represents the latest continuous time series dataset of at least 10 years with observed runoff. Thereafter, data from 12 General circulation models (GCMs) and 3 Representative concentration pathways (RCPs) for 1971
~2000 (1985s), 2021~2040 (2030s), 2051~2070 (2060s) and 2080~2100 (2090s) were extracted from an online database courtesy of the World Climate Research Pro- gram’s Working Group on Coupled Modeling (CMPI5). 12 out of a possible 60 GCMs were selected for this study (Table 2). GCMs with sufficient historical and future datasets of the representative concentration pathways (RCPs) family were selected. The uncertainty and dis- parities between the different GCMs warrant the use of a multi-GCM and multi RCP ensemble for impact assessments (Zhang et al., 2011). The selected number allows sufficient assessment of uncertainty without exacerbating the computational demands of the study.
The 3 RCPs were selected for this study because they generally cover the range of radiative forcing and green- house gas concentration trajectories examined by the climate modeling community. RCP4.5 and RCP6.0 are both medium stabilization scenarios but only RCP4.5 was used in this study. RCP4.5 has more output data- set availability and is more commonly used in literature
than RCP6.0 (Van Vuuren, 2011; Moss et al., 2010).
Evapotranspiration (ET) data were computed from maxi- mum temperature, minimum temperature, average wind speed, average humidity, and average solar radiation/
sunshine hours using a modified Microsoft Excel sprea- dsheet (ET
o-PM) for computing the reference eva- potranspiration (ET
o) that uses the Penman- Monteith equation (Lupia, 2013).
The output from different GCMs is provided at coarse
spatial resolution scales and needs to be adjusted to be
applicable to local conditions. In Korea, various tech-
niques including statistical and dynamic downscaling,
bias correction and weather generators etc. have been
employed to address the resolution challenge. The Long
Ashton Research Station weather generator (LARS-
WG) was used in this study. The mean of the absolute
(for temperature) and relative differences (rest of para-
meters) between the GCM baseline and future scenarios
were used to perturb the observed baseline using
LARS-WG. LARS-WG simulates rainfall occurrence
using a two state, first-order Markov chain: rainfall
amounts on wet days using a gamma distribution and
temperature and radiation components using first order
tri-variate auto-regression conditional on rainfall occur-
rence. The gamma distribution is used in the LARS- WG because it matched the observed data better than other exponential models used in the development of the weather generator (Nkomozepi and Chung, 2014).
2.2 Hydrological models
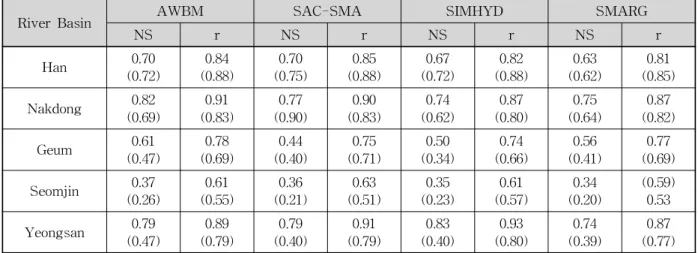
Four widely utilized conceptual rainfall-runoff models contained in the Rainfall Runoff Library (RRL) (Podger, 2004) in the Catchment Modeling Toolkit were used to generate runoff in this study. The models were selected because (1) they have been successfully tested and applied across a wide range of different climate and locations (2) they all use a reasonably low number of parameters that are convenient for quick calibration and verification and (3) they have user friendly graphic user interfaces that make it easy to provide input data and extract output data (Schreider et al., 2002). The models are SIMHYD (Chiew and Siriwardena, 2005), Sacramento Soil Moisture Accounting model (SAC-SMA) (Burnash et al., 1973), Australian Water Balance Model (AWBM) (Boughton, 2004) and Soil Moisture Accounting and Routing with Groundwater component model (SMARG) (Vaze et al., 2011).
The AWBM is a water balance model that estimates the base-flow recharge and surface runoff from 3 surface storages where rainfall is added and ET subtracted.
Consequently, the total runoff is calculated from the base-flow storage and surface runoff routing storage.
AWBM utilizes 8 parameters including the 3 surface storages, base-flow index, initial moisture in base-flow and surface runoff storage, and the base-flow and surface runoff recession constants. In the SAC-SMA model, water is distributed within hypothetical zones of a soil column. Initially, rainfall either enters the upper tension zone or directly becomes runoff if it falls on impervious surfaces. Thereafter free water is distributed to the interflow or percolation (which becomes base- flow) and finally the runoff is estimated. SAC-SMA estimates ET losses from both the lower and upper tension water, upper free zone water and from the channel. In addition, losses from deep percolation are also subtracted from the base flow and channel. SAC- SMA utilizes 11 parameters.
In SIMHYD, rainfall either fills the interception stor- age or directly becomes runoff from impervious sur- faces. The excess rainfall infiltrates and runoff is esti- mated from infiltration excess runoff, interflow, satura- tion excess runoff and base-flow. ET is deducted from the interception, soil moisture and impervious runoff storages. SIMHYD utilizes 9 parameters namely base- flow coefficient, impervious threshold, infiltration coef- ficient, infiltration shape, interflow coefficient, pervious fraction, rainfall interception storage capacity, recharge coefficient and the soil moisture store capacity. Finally in SMARG, rainfall is partitioned to infiltration and direct runoff. The runoff is then estimated from the rainfall and moisture in excess of the infiltration capa- city with the aid of a groundwater linear reservoir. ET is deducted from soil moisture and direct runoff.
SMARG utilizes 9 parameters. The input data into all of the 4 models are daily rainfall, ET and observed flow (Vaze et al., 2011). More detailed descriptions and illustrations of these models are available in Podger (2004).
2.3 Hydro-meteorological model calibration and verification
The HM models herein contain 37 parameters that
are not directly observable. To overcome this challenge,
warming up, calibration and verification are used to
derive the optimum parameters that will give the best
agreement between observed and simulated runoff
values. Observed daily rainfall, ET and runoff data from
1999 to 2006 were used for calibration while data from
2005 to 2009 were used for verification. In both calibra-
tion and verification, the first 4 months were to “warm
up” i.e. training to determine initial values for soil
moisture stores. The genetic algorithm optimization
method generally gave the best performance and was
used for optimization in this study. In addition, the
Nash-Sutcliffe and runoff difference (%) criterion were
used as the primary and secondary optimization objec-
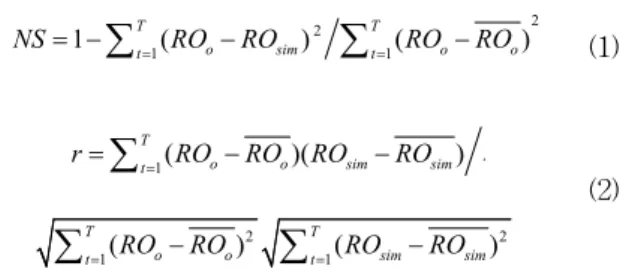
tives, respectively. The Nash-Sutcliffe efficiency (NS)
and correlation coefficients (r) given in Eqs. (1) and (2)
are the 2 efficiency measures used for the evaluation of
hydro-meteorological model performance herein.
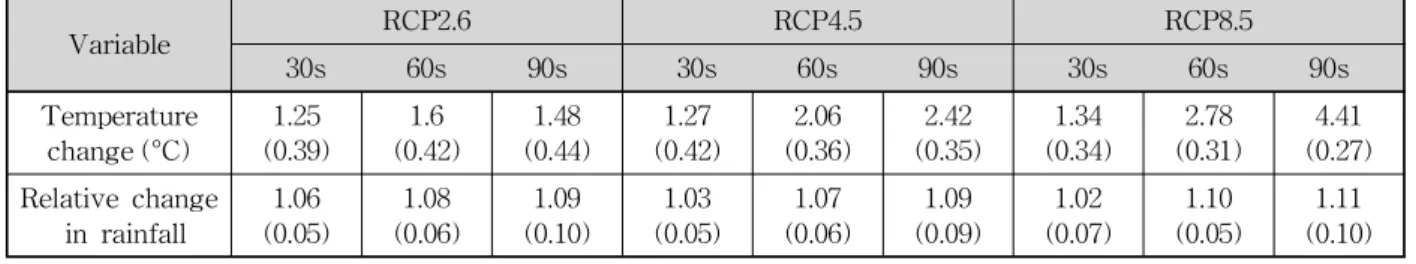
Fig. 2. Projected Relative Annual Rainfall Change and Absolute Temperature Change
2 2
1 1
1
T(
o sim)
T(
o o)
t t
NS RO RO RO RO
= =
= - å - å - (1)
2 2
1
( )( )
1( )
1( )
T T T
o o sim sim o o sim sim
t t t
r RO RO RO RO RO RO RO RO
= = =
= å - - å - å -
(2)
2 2
1
( )( )
1( )
1( )
T T T
o o sim sim o o sim sim
t t t
r = å
=RO - RO RO - RO å
=RO - RO å
=RO - RO
where RO
ois the observed runoff, RO
simis the simu- lated runoff, bar represents mean, t is the daily time step and T is the total number of days from calibration or verification.
2.4 Projected climate and runoff analysis Analyses will be based on the annual mean runoff, a key hydrological indicator. Kim et al. (2006) established that aggregate predictions are more accurate therefore data in this study were combined to allow analyses for the baseline, near, mid and long term future periods referring to the 1985s, 2030s, 2060s and 2090s, respec- tively. The data were combined by taking an arithmetic average of the predictions in each scenario as shown in Eq. (3).