Received: February 6, 2017 Revised: March 15, 2017 Accepted: March 27, 2017
Address for Correspondence: Jong Kil Joo, Department of Obstetrics and Gynecology, Pusan National University School of Medicine, 179 Gudeko-ro, Seo-gu, Busan 49241, Korea
Tel: +82-51-240-7287, Fax: +82-51-248-2384, E-mail: jongkilj@hanmail.net
Original Article
pISSN: 2288-6478, eISSN: 2288-6761 https://doi.org/10.6118/jmm.2017.23.2.96 Journal of Menopausal Medicine 2017;23:96-101
J MM
Introduction
The prevalence of low bone mineral density (BMD) and risk of fracture are increased among patients with end- stage renal disease,1 but the effects of mild-to-moderate renal insufficiency on BMD have been less widely studied.2 Separately, studies have reported conflicting data. In one matched case-control study, patients with kidney disease had lower BMD,3 but in another study, kidney function did not predict lower BMD after adjusting age, gender, and weight.4 This discrepancy could have been attributable to the characteristics of the study populations such as race and age, and the degree of decreased renal function could have
affected the results. The relationship between renal function and BMD could differ by degree of renal function.
Another possible cause of this conflicting result is the use of different renal function markers. A number of markers have been used to estimate renal function estimation, most widely, creatinine. However, creatinine levels are influenced partly by muscle mass, which is associated with age, gender, and weight.5 Although estimated glomerular filtration rate (eGFR) can be used as an improved marker of renal func- tion, it is also calculated from serum creatinine. Cystatin C (Cys-C) is a member of the human cysteine superfamily and is an extracellular inhibitor of cysteine proteases; it can be used to represent the changes in the GFR, similar to serum
The Relationship between Renal Function and Bone Marrow Density in Healthy Korean Women
Byung Kyu Park, Ka Yeong Yun, Seung Chul Kim, Jong Kil Joo, Kyu Sup Lee, Ook Hwan Choi
Department of Obstetrics and Gynecology, Medical Research Institute, Pusan National University Hospital, Busan, Korea
Objectives: The relationship between renal function and bone mineral density (BMD) is controversial. We evaluated the relationship between markers of renal function and BMD in healthy Korean women.
Methods: A total of 1,093 women who visited the health promotion center at Pusan National University hospital were included in the cross-sectional study. We divided the study population into two groups by BMD: osteopenia-osteoporosis and normal in the lumbar and femur regions, respectively. We compared the relationship between renal function and BMD using a logistic regression model and used SAS 9.3 (SAS Institute, Inc., Cary, NC, USA) for all statistical analysis.
Results: Blood urea nitrogen (BUN), creatinine, and cystatin C (Cys-C) were correlated with BMD in both the normal and osteopenia-osteoporosis groups, and in logistic regression analysis, BUN and Cys-C were correlated with lumbar and femur BMD.
However, after we adjusted for age, menopause, and body mass index, only creatinine showed a negative correlation with lumbar BMD, and estimated glomerular filtration rate (eGFR) was related positively with femur BMD.
Conclusions: Serum creatinine could be a marker for lumbar BMD and eGFR for femur BMD in Korean women without overt nephropathy. (J Menopausal Med 2017;23:96-101)
Key Words: Bone density · Creatinine · Cystatin C · Osteoporosis
Byung Kyu Park, et al. Renal Function and Bone Marrow Density
creatinine. Serum Cys-C was found to be a better marker than serum creatinine and also a better representative of GFR than serum β2-microglobulin.6~8 In addition, serum Cys-C is known not to be influenced by body mass or age.9 Cys-C may be a better marker than traditional ones, but its correlation with BMD is still unclear.
In this study, we evaluated the correlation between BMD and renal function with multiple markers in Korean women without overt nephropathy.
Materials and Methods
1. Study population and anthropometric measurements
This study include 1,093 women aged 50 to 70 years old who completed our self-report questionnaires without ex- ception among 3,670 women who visited the health pro- motion center at Pusan National University Hospital from January 2011 to December 2014. We obtained information on menstrual history, operative history, and disease history in addition to medical history, medication use, and lifestyle us- ing self-report questionnaires and interviews with health- care providers. Using a standing stadiometer, we measured body weight and height with light clothing while the subjects were barefoot and rounded the values to the nearest 0.1 kg and 0.1 cm. We calculated body mass index (BMI) as the weight in kilograms divided by the height in meters squared.
In order to apply this study to the normal population group, we set the exclusion criteria as follows: 1) patients with overt nephropathy; 2) patients whose blood test results raised the suspicion of renal disease (creatinine level higher than 1.5 mg/L, an eGFR less than 60 mL/minute/1.73 m2);
3) patients who had received hormone therapy within the previous 12 months; and 4) patients who were currently un- dergoing chemotherapy or radiation therapy.
2. Blood sampling and laboratory analysis
Blood was drawn at the antecubital vein from all subjects between 8:30 and 10:00 am following at least eight hours of fasting, and we analyzed Cys-C using turbidimetric immu- noassay. The liver and renal function tests included alanine aminotransferase, aspartate aminotransferase, lipid profiles,
blood urea nitrogen (BUN), serum creatinine, and total bili- rubin as well as others, all of which we measured using the Toshiba TBA200FR (Toshiba Co., Tokyo, Japan).
3. BMD measurement
We measured BMD by dual energy X-ray absorptiometry (Hologic QDR-4500A; Hologic Inc., Bedford, MA, USA) at the lumbar spine (L1-L4), femur neck, and femur total and classified the results according to World Health Organization (WHO) criteria as normal BMD: T-score ≥ -1 or osteopenia or osteoporosis: -2.5 < T-score < -1 or T-score ≤ -2.5, respectively).
4. Statistical analysis
We used SAS 9.3 (SAS Institute, Inc., Cary, NC, USA) for the statistical analysis, entering all data into a database for verification by an independent person. We divided the study population into two groups by body area: osteopenia-osteo- porosis and normal BMD in the lumbar and femur regions, respectively. We investigated the basic characteristics of the groups using the χ2 test, independent t-test, or Wilcoxon rank sum test, and we compared the relationship between renal function and BMD using a logistic regression model.
Results
The basic characteristics of our study groups are pre- sented in Table 1. Between women with osteopenia-osteo- porosis and women with normal BMD in the lumbar region, there were more postmenopausal women in the osteopenia- osteoporosis group; serum phosphate, alkaline phosphatase (ALP), insulin, and homocysteine were also significantly higher in the osteopenia-osteoporosis group. The results for the femur region were similar except there was no difference in insulin level.
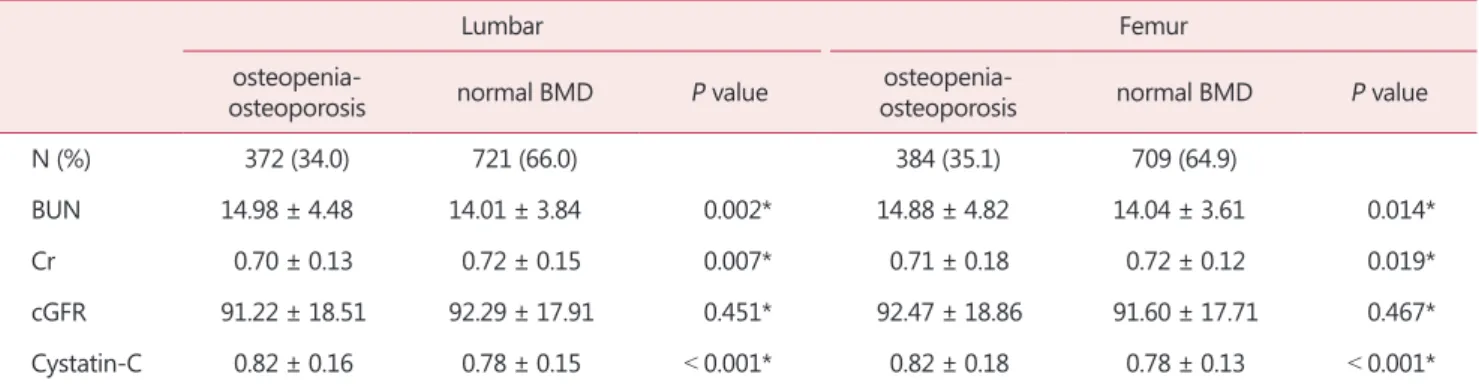
Table 2 shows the correlations between BMD and the re- nal function markers. In the lumbar region, BUN and Cys- C were significantly higher in the osteopenia-osteoporosis group, but creatinine was lower in this group. The femur region showed the same results.
Table 3 shows the logistic regression analysis results for BMD and the renal function markers. The odds radios of
Journal of Menopausal Medicine 2017;23:96-101
J MM
BUN and Cys-C were statistically significant in both regions with unadjusted analysis; however, once we adjusted for age, menopausal status, and BMI, there was no statistical significance for either. Creatinine showed negative correla- tions in lumbar BMD, and eGFR showed positive correlations with femur BMD after adjustment.
Discussion
In this study, BUN, creatinine, and Cys-C were correlated with BMD in both the normal and osteopenia-osteoporosis groups. In logistic regression analysis, BUN and Cys-C were correlated with lumbar and femur BMD, but after we ad- justed for age, menopause, and BMI, only creatinine showed a negative correlation with lumbar BMD and eGFR was re- lated positively with femur BMD.
Generally, it is known that decreased renal function is as- Table 1. Population characteristics by lumbar and femur bone marrow density
Lumbar Femur
Osteopenia-
osteoporosis Normal P value Osteopenia-
osteoporosis Normal P value
N (%) 372 (34.0) 721 (66.0) < 0.001 384 (35.1) 709 (64.9) < 0.001
premenopausal 29 (7.8) 294 (40.8) 47 (12.2) 276 (38.9)
postmenopausal 343 (92.2) 427 (59.2) 337 (87.8) 433 (61.1)
Age 60.21 ± 7.81 52.66 ± 8.97 < 0.001* 59.52 ± 8.83 52.91 ± 8.72 < 0.001*
WC 79.66 ± 8.55 79.01 ± 8.49 0.139* 79.06 ± 8.47 79.33 ± 8.54 0.932*
BMI 22.74 ± 3.08 22.90 ± 3.9 0.665* 22.63 ± 2.93 22.96 ± 3.16 0.353*
Uric acid 4.46 ± 1.01 4.53 ± 1.04 0.411* 4.48 ± 1.04 4.52 ± 1.03 0.389*
Phosphate 3.82 ± 0.53 3.71 ± 0.49 < 0.001* 3.84 ± 0.53 3.70 ± 0.49 < 0.001*
Calcium 9.43 ± 0.39 9.41 ± 0.37 0.171* 9.42 ± 0.41 9.42 ± 0.37 0.426*
ALP 96.74 ± 58.11 82.49 ± 51.01 < 0.001* 96.45 ± 57.85 82.41 ± 51.05 < 0.001*
Vitamin D 16.12 ± 8.53 16.34 ± 9.24 0.880* 16.12 ± 8.63 16.35 ± 9.20 0.866*
Insulin (RIA) 4.78 ± 2.62 4.61 ± 2.64 0.037* 4.66 ± 2.37 4.67 ± 2.77 0.178*
Homocysteine 7.75 ± 3.33 7.27 ± 2.33 0.010* 7.76 ± 3.26 7.26 ± 2.36 0.003*
RA 11.10 ± 24.50 9.77 ± 9.35 0.242* 10.92 ± 23.38 9.85 ± 10.39 0.859*
TSH (RIA) 2.81 ± 6.21 2.18 ± 3.40 0.900* 2.74 ± 6.11 2.20 ± 3.44 0.976*
L1-L4 -1.89 ± 0.61 0.49 ± 1.03 < 0.001* -1.37 ± 1.9 0.25 ± 1.29 < 0.001*
Femur -1.36 ± 0.72 -0.19 ± 0.91 < 0.001* -1.64 ± 0.43 -0.01 ± 0.75 < 0.001*
L1 -1.95 ± 0.75 0.18 ± 1.05 < 0.001* -1.56 ± 1.02 0.00 ± 1.25 < 0.001*
L2 -1.99 ± 0.76 0.33 ± 1.10 < 0.001* -1.52 ± 1.13 0.12 ± 1.33 < 0.001*
L3 -1.93 ± 0.81 0.54 ± 1.15 < 0.001* -1.43 ± 1.20 0.31 ± 1.40 < 0.001*
L4 -1.63 ± 0.91 0.78 ± 1.26 < 0.001* -1.11 ± 1.30 0.54 ± 1.48 < 0.001*
The data is presented as mean ± standard deviation or number (%)
*Wilcoxon rank sum test
WC: waist circumference, BMI: body mass index, ALP: alkaline phosphatase, RIA: radioimmunoassay, RA: rheumatoid arthritis, TSH: thy- roid-stimulating hormone
Journal of Menopausal Medicine 2017;23:96-101 Byung Kyu Park, et al. Renal Function and Bone Marrow Density
sociated with decreased BMD. Decreasing GFR is associated with increased parathyroid hormone secretion and fibroblast growth factor 23 signaling, which leads to decreased vita- min D synthesis, which is then associated with bone loss.10,11 However, many studies found no relationship between renal function and BMD. The reasons for this disagreement might be the degrees of diminished renal function and the renal function markers that were used for the analyses.
Patients with end-stage renal disease (ESRD) have a higher prevalence of low BMD and a higher risk of fracture.1 The mechanism of low BMD in ESRD patients is multifac- torial.12 Metabolic bone disease, β2-microglobulin-related amyloidosis, hypogonadism, avascular necrosis, and chronic acidosis in ESRD patients could all be associated with in- creased bone loss,13 and conversely, osteoporosis and frac- ture can accelerate the development of ESRD.
Decreasing GFR is associated with increased parathy-
roid hormone secretion, which leads to decreased vitamin D synthesis, which is then associated with bone loss. In our data, calcium and vitamin D were not different between os- teopenia/osteoporosis and normal BMD. So we assume that difference in BMD may be caused by other factors partly.
Osteoporosis is characterized by long-term chronic inflam- mation and microvascular disease that could enhance the deterioration of renal function. Additionally, acute inflam- matory response in bone healing following fracture might further deteriorate renal function.14
In patients with mild-to-moderate chronic renal disease, the relationship between renal function and BMD could be different from that in ESRD patients. Kong et al.15 reported that mild-to-moderate chronic renal disease was not in- dependently associated with decreased BMD, but Kaji et al.16 reported that postmenopausal women with mild renal dysfunction were at increased risk for BMD decrease and Table 2. The correlations between bone marrow density and the renal function markers
Lumbar Femur
osteopenia-
osteoporosis normal BMD P value osteopenia-
osteoporosis normal BMD P value
N (%) 372 (34.0) 721 (66.0) 384 (35.1) 709 (64.9)
BUN 14.98 ± 4.48 14.01 ± 3.84 0.002* 14.88 ± 4.82 14.04 ± 3.61 0.014*
Cr 0.70 ± 0.13 0.72 ± 0.15 0.007* 0.71 ± 0.18 0.72 ± 0.12 0.019*
cGFR 91.22 ± 18.51 92.29 ± 17.91 0.451* 92.47 ± 18.86 91.60 ± 17.71 0.467*
Cystatin-C 0.82 ± 0.16 0.78 ± 0.15 < 0.001* 0.82 ± 0.18 0.78 ± 0.13 < 0.001*
The data is presented as mean ± standard deviation or number (%)
*Wilcoxon rank sum test
BMD: bone mineral density, BUN: blood urea nitrogen, Cr: creatinine, cGFR: corrected glomerular filtration rate
Table 3. Logistic regression analysis results for bone marrow density and renal function markers
Lumbar Femur
Unadjusted Adjusted† Unadjusted Adjusted†
BUN 1.059* (1.026-1.093) 0.992 (0.958-1.027) 1.051* (1.019-1.084) 0.993 (0.96-1.027)
Cr 0.325 (0.115-0.921) 0.186* (0.057-0.604) 0.582 (0.226-1.499) 0.423 (0.145-1.235)
cGFR 0.997 (0.988-1.005) 1.008 (0.999-1.018) 1.003 (0.994-1.011) 1.014* (1.004-1.024) Cystatin-C 7.456* (3.04-18.282) 1.097 (0.426-2.824) 6.749* (2.775-16.411) 1.457 (0.581-3.654) The data is presented as odds radio (95% confidence interval)
*P < 0.05
†age, menopause, body mass index
BUN: blood urea nitrogen, Cr: creatinine, cGFR: corrected glomerular filtration rate
Journal of Menopausal Medicine 2017;23:96-101
J MM
vertebral fractures. This discrepancy is probably due to the difference in gender and age between the two studies. In the report of Kong et al.15, both men and women were included and the mean age was 49.9 years. However in the report of Kaji et al.16, only women were included and the mean age was 64.5 years.
Osteoporosis is an age-related disease with several gender-specific differences. Bisphosphonate and hormone therapy are used for the treatment of osteoporosis, and cell therapy is also being studied recently.17 Its prevalence is higher in women than in men. Due to their larger bones, men have greater bending strength than do women.18 In ad- dition, the effect of estrogen has to be considered. It is well- known that estrogen has a positive effect on BMD. Hypoes- trogenism induced by gonadopin-releasing hormone agonist can cause low BMD status that need treatment.19 Moreover, multiparity and prolonged lactation have negative impact on BMD.20 Additionally, many studies suggest that estro- gen has a nephroprotective effect.21~23 Menopause can cause a decrease in estrogen, which affects both the bone and the kidney. Therefore, health care through comprehensive screening including renal function at the time of menopause is necessary. There is a possibility of predictive role of renal function test in BMD to some extent.
In a population without overt nephropathy, Huh et al.24 reported that serum creatinine reflected muscle mass, and low serum creatinine was independently associated with low BMD, and these results correspond with those of our study.
Reduced muscle mass, or sarcopenia, is a well-known risk factor for osteoporosis; it affects balance and thereby in- creases the risk of falls and subsequent fractures.25 Serum creatinine reflects physical activity levels as well as skeletal muscle mass, and both are important for maintaining bone health.26 Because creatinine degradation is stimulated by reactive oxygen species, decreased serum creatinine may reflect increased oxidative stress, which may consequently deteriorate BMD via this oxidative stress.27
The serum creatinine cut-point for the presence of sar- copenia was suggested to be below 0.7 mg/dL in postmeno- pausal women.24 In our study, mean creatinine was 0.7 ± 0.13 mg/dL in the lumbar region and 0.71 ± 0.18 mg/dL in the femur region in the osteopenia-osteoporosis group, both of which were lower than the levels in the normal BMD group.
Renal function should be analyzed differently according to presence or severity of renal dysfunction. In ESRD, renal function is highly correlated with low BMD, and renal func- tion markers could predict osteoporosis or fractures. How- ever, in patients with normal renal function, lower serum creatinine is associated with lower BMD in relation to sar- copenia. In mild-to-moderate renal disease, the correlation of renal function and BMD is controversial.
Regarding the renal function markers, creatinine is a better marker for BMD. Cys-C is a good marker for renal function, but it has limited value in reflecting BMD because BMD is determined by multiple factors.
This study has a number of limitations. First, we did not evaluate body mass, which is important in estimating the relationship between renal function and BMD. Second, we used only participants who had attended the health promo- tion center, and this population might have tended to care more about their health. Third, we did not analyzed data as subgroups of renal dysfunction degree. Despite these limita- tions, this study has value in showing the clear correlation between decreased creatinine and lower BMD in healthy Korea women.
Acknowledgement
This work was supported by a 2-Year Research Grant of Pusan National University. We acknowledge assistance with statistical analysis from the Pusan National University Hos- pital Clinical Trial Center Biostatistics Office.
Conflict of Interest
No potential conflict of interest relevant to this article was reported.
References
1. Stehman-Breen C. Bone mineral density measurements in dialysis patients. Semin Dial 2001; 14: 228-9.
2. Kuipers AL, Egwuogu H, Evans RW, Patrick AL, Youk A,
Journal of Menopausal Medicine 2017;23:96-101 Byung Kyu Park, et al. Renal Function and Bone Marrow Density
Bunker CH, et al. Renal function and bone loss in a cohort of afro-caribbean men. J Bone Miner Res 2015; 30: 2215-20.
3. Rix M, Andreassen H, Eskildsen P, Langdahl B, Olgaard K. Bone mineral density and biochemical markers of bone turnover in patients with predialysis chronic renal failure.
Kidney Int 1999; 56: 1084-93.
4. Hsu CY, Cummings SR, McCulloch CE, Chertow GM. Bone mineral density is not diminished by mild to moderate chronic renal insufficiency. Kidney Int 2002; 61: 1814-20.
5. Fried LF, Shlipak MG, Stehman-Breen C, Mittalhenkle A, Seliger S, Sarnak M, et al. Kidney function predicts the rate of bone loss in older individuals: the Cardiovascular Health Study. J Gerontol A Biol Sci Med Sci 2006; 61: 743-8.
6. Coll E, Botey A, Alvarez L, Poch E, Quintó L, Saurina A, et al. Serum cystatin C as a new marker for noninvasive estimation of glomerular filtration rate and as a marker for early renal impairment. Am J Kidney Dis 2000; 36: 29-34.
7. Salgado JV, Neves FA, Bastos MG, França AK, Brito DJ, Santos EM, et al. Monitoring renal function: measured and estimated glomerular filtration rates - a review. Braz J Med Biol Res 2010; 43: 528-36.
8. Simonsen O, Grubb A, Thysell H. The blood serum concen- tration of cystatin C (gamma-trace) as a measure of the glomerular filtration rate. Scand J Clin Lab Invest 1985; 45:
97-101.
9. Norlund L, Fex G, Lanke J, Von Schenck H, Nilsson JE, Leksell H, et al. Reference intervals for the glomerular fil- tration rate and cell-proliferation markers: serum cystatin C and serum beta 2-microglobulin/cystatin C-ratio. Scand J Clin Lab Invest 1997; 57: 463-70.
10. Levin A, Bakris GL, Molitch M, Smulders M, Tian J, Wil- liams LA, et al. Prevalence of abnormal serum vitamin D, PTH, calcium, and phosphorus in patients with chronic kidney disease: results of the study to evaluate early kidney disease. Kidney Int 2007; 71: 31-8.
11. Wolf M. Update on fibroblast growth factor 23 in chronic kidney disease. Kidney Int 2012; 82: 737-47.
12. Alem AM, Sherrard DJ, Gillen DL, Weiss NS, Beresford SA, Heckbert SR, et al. Increased risk of hip fracture among patients with end-stage renal disease. Kidney Int 2000; 58:
396-9.
13. Stein MS, Packham DK, Ebeling PR, Wark JD, Becker GJ.
Prevalence and risk factors for osteopenia in dialysis pa- tients. Am J Kidney Dis 1996; 28: 515-22.
14. Tseng CH, Huang WS, Li TC, Chen HJ, Muo CH, Kao CH.
Increased risk of end-stage renal disease among hip frac- ture patients. Eur J Intern Med 2014; 25: 956-61.
15. Kong X, Tang L, Ma X, Liu W, Wang Z, Cui M, et al. Re- lationship between mild-to-moderate chronic kidney dis- ease and decreased bone mineral density in Chinese adult population. Int Urol Nephrol 2015; 47: 1547-53.
16. Kaji H, Yamauchi M, Yamaguchi T, Shigematsu T, Sugimo- to T. Mild renal dysfunction is a risk factor for a decrease in bone mineral density and vertebral fractures in Japanese postmenopausal women. J Clin Endocrinol Metab 2010; 95:
4635-42.
17. Choi HJ, Kim TH, Kim SA, Kim JM, Lee A, Song HJ, et al. Cell therapy products in menopausal medicine. J Meno- pausal Med 2016; 22: 71-5.
18. Pietschmann P, Rauner M, Sipos W, Kerschan-Schindl K.
Osteoporosis: an age-related and gender-specific disease- a mini-review. Gerontology 2009; 55: 3-12.
19. Cho YH, Um MJ, Kim SJ, Kim SA, Jung H. Raloxifene administration in women treated with long term gonado- tropin-releasing hormone agonist for severe endometriosis:
effects on bone mineral density. J Menopausal Med 2016;
22: 174-9.
20. Sharma N, Natung T, Barooah R, Ahanthem SS. Effect of multiparity and prolonged lactation on bone mineral den- sity. J Menopausal Med 2016; 22: 161-6.
21. Antus B, Hamar P, Kokeny G, Szollosi Z, Mucsi I, Nemes Z, et al. Estradiol is nephroprotective in the rat remnant kid- ney. Nephrol Dial Transplant 2003; 18: 54-61.
22. Mankhey RW, Bhatti F, Maric C. 17beta-Estradiol replace- ment improves renal function and pathology associated with diabetic nephropathy. Am J Physiol Renal Physiol 2005;
288: F399-405.
23. Maric C, Sullivan S. Estrogens and the diabetic kidney.
Gend Med 2008; 5 Suppl A: S103-13.
24. Huh JH, Choi SI, Lim JS, Chung CH, Shin JY, Lee MY.
Lower serum creatinine Is associated with low bone mineral density in subjects without overt nephropathy. PLoS One 2015; 10: e0133062.
25. Liu-Ambrose T, Eng JJ, Khan KM, Carter ND, McKay HA. Older women with osteoporosis have increased postural sway and weaker quadriceps strength than counterparts with normal bone mass: overlooked determinants of frac- ture risk? J Gerontol A Biol Sci Med Sci 2003; 58: M862-6.
26. Baxmann AC, Ahmed MS, Marques NC, Menon VB, Pereira AB, Kirsztajn GM, et al. Influence of muscle mass and physical activity on serum and urinary creatinine and se- rum cystatin C. Clin J Am Soc Nephrol 2008; 3: 348-54.
27. Wyss M, Kaddurah-Daouk R. Creatine and creatinine me- tabolism. Physiol Rev 2000; 80: 1107-213.