Introduction
About 30% to 40% of the cancer patients experience se- vere weight loss and malnutrition [1,2], and this percentage is especially high in patients with gastrointestinal or head and neck cancers [3]. Associations have been reported among poor nutritional status, increased risk for adverse clinical outcome [4], poor quality of life [5], and lower survival rates [6,7]. For gastrointestinal cancer, a poor nutritional status was also correlated with shorter survival and poorer tolerance to chemotherapy [8,9] and nutritional status is an independent risk factor for quality of life [10,11]. In addition, 20% of cancer patients die from the effects of malnutrition rather than from the malignancy [12]. Thus, nutritional risks need to be evalu- ated by routine nutrition screening of patients upon hospital admission. The Joint Commission International advised a nutri- tion assessment within 24 hours of admission to identify mal-
Clin Nutr Res 2013;2:12-18
http://dx.doi.org/10.7762/cnr.2013.2.1.12 pISSN 2287-3732 ∙ eISSN 2287-3740
Effect of Nutritional Risk at Admission on the Length of Hospital Stay and
Mortality in Gastrointestinal Cancer Patients
Hosun Lee*, Youn Soo Cho, Seunghyun Jung, Hyungmi Kim
Department of Nutrition and Dietetics, Severance Hospital, Yonsei University Health System, Seoul 120-752, Korea
This retrospective study was conducted to determine whether increased length of hospital stay (LOS) and mortality are associ- ated with nutritional risk upon hospital admission in gastrointestinal cancer patients, using a computerized screening tool de- veloped by a university hospital. We included adult gastrointestinal cancer patients whose hospital stays ranged from 24 hours to 90 days. The sample included 4,345 patients. The average age of the patients was 60.5 ± 11.4 years and 2,959 (68.1%) were males. The mean of LOS was 8.2 ± 8.2 days and the mortality rate was 3.4% (n = 146). The majority of the patients were at low risk (LG) (n = 3,102 [71.4%]), while 779 patients (17.9%) were at moderate risk (MG), and 464 (10.7%) were at high risk (HG).
In comparing the three groups based on nutritional risk, hospital LOS was significantly longer in the HG (11.4 ± 11.4 days) than it was in the LG (7.7 ± 7.9 days) and the MG (7.9 ± 7.9 days) (p < 0.0001). Significant differences were found in the hospital mortality rate, which was the highest in the HG (13.6%) and the lowest in the LG (1.5%) (p < 0.0001). In the multiple logistic regression analysis, moderate-to-severe nutritional risk, increased age, and emergency admission were selected as significant variables for increased LOS and mortality. Further research is needed to evaluate the benefits of nutritional screening and in- tervention and their effect on outcomes in various disease populations.
Key Words: Nutritional risk, Length of stay, Mortality, Gastrointestinal cancer
*Corresponding author Hosun Lee
Address Department of Nutrition and Dietetics, Severance Hos- pital, Yonsei University Health System, 50 Yonsei-ro, Seodaemun- gu, Seoul 120-752, Korea Tel +82-2-2228-6940 Fax +82-2-2227- 7852
E-mail [email protected] Received December 2, 2012 Revised December 14, 2012 Accepted December 19, 2012
This is an Open Access article distributed under the terms of the Creative Commons Attribution Non-Commercial License (http://creativecommons.org/licenses/by-nc/3.0/) which permits unrestricted non-commercial use, distribution, and reproduction in any medium, provided the original work is properly cited.
© 2013 The Korean Society of Clinical Nutrition
nutrition as early as possible and to treat nutritional problems through nutrition intervention. Nutritional screening tools vary with regard to the risk parameters used and their ability to determine nutritional risk. The Nutrition Risk Index (NRI), the Malnutrition Universal Screening Tool (MUST), Nutritional Risk Screening 2002 (NRS 2002), and the Mini Nutritional Assess- ment (MNA) are the most popular nutritional screening tools and their reliability has been proven [13].
These screening tools are used to evaluate recent changes in weight or food intake to detect whether the patient’s condi- tion is stable or getting worse. Despite the high prevalence of malnutrition among cancer patients, the manpower of clini- cal dietitians is insufficient to interview every new patient to ask about changes in body weight and/or recent food intake.
We have used a computerized nutrition screening system to determine serum albumin concentration, percentage of ideal body weight, and severity of diagnosis and those data were collected within 24 hours after hospital admission. The guide- lines of the European Society for Clinical Nutrition and Metab- olism (ESPEN) state that nutritional screening should be able to predict the clinical course based on nutritional status and whether patients could benefit from nutritional treatment [14].
This study aimed to determine whether the gastrointestinal cancer patients that are at nutritional risk on admission (based on the results of our nutrition screen tool) are associated with increased length of hospital stay (LOS) and mortality.
Materials and Methods
This study was conducted by retrospective chart review us-
ing the clinical data research system of Severance Hospital, Yonsei University Health System. Among those patients who were admitted to the hospital between March 1, 2011 and May 31, 2011, we included 4,345 adult patients (≥20 years old) with esophageal, gastric, colon, rectal, hepatic, and pancreatic cancer. We excluded patients who were discharged from the hospital within 24 hours of admission or who stayed in the hospital longer than 90 days.
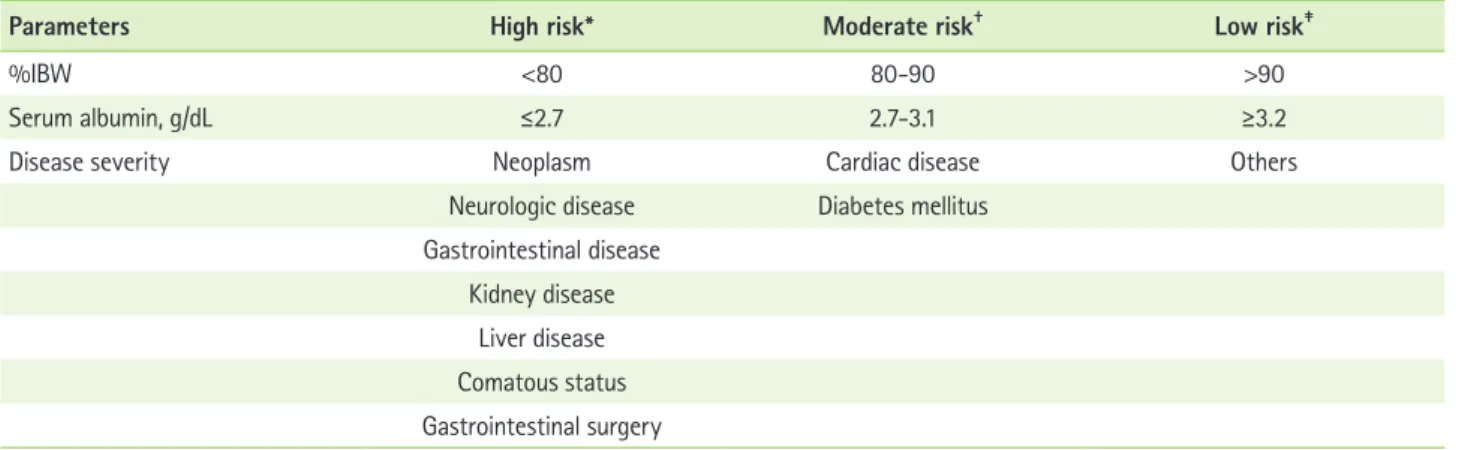
We collected the following data: age, sex, chief complaint, diagnosis, admission source, height and body weight at ad- mission, serum albumin and total lymphocyte count (TLC) at admission to the hospital; upon discharge from the hospital, we collected data on length of hospital stay (LOS) and mortal- ity. Data about changes in body weight for a month and oral intake for a week prior to admission were collected from the admission nursing records. Based on the nutrition screening criteria used by Severance Hospital (Table 1), we divided the subjects into three groups according to the degrees of their nutritional risk: high risk (HG), moderate risk (MG), and low risk (LG). The computerized nutrition screening tool in this hospital was developed in 2005. We selected serum albumin concen- tration levels, percentage of current body weight to ideal body weight (%IBW), and severity of medical diagnosis as the nutri- tion screening parameters; and the data can be taken from the electronic medical record (EMR) for almost all the patients within 24 hours after admission to the hospital.
This study was a retrospective chart review and the Insti- tutional Review Board waived the requirement to obtain in- formed consent from the patients.
Table 1. Nutrition screening criteria
Parameters High risk* Moderate risk† Low risk‡
%IBW <80 80-90 >90
Serum albumin, g/dL ≤2.7 2.7-3.1 ≥3.2
Disease severity Neoplasm Cardiac disease Others
Neurologic disease Diabetes mellitus Gastrointestinal disease
Kidney disease Liver disease Comatous status Gastrointestinal surgery
%IBW: percentage of current body weight to ideal body weight.
*More than 1 high risk parameters; †More than 1 moderate risk parameters or 1 high risk parameters and 1 moderate risk parameters; ‡The others.
Statistical analysis
The results were expressed as means ± SD. The differences in the LOS, body mass index (BMI), and the biochemical pa- rameters (albumin and TLC) among the three groups, based on the results of the nutrition screening, were analyzed by analysis of variance using the post hoc Bonferroni test. A chi- square test was used to compare the differences in mortal- ity. To identify the factors associated with increased LOS and mortality, multiple logistic regression analysis was conducted.
Statistical significance was set at p < 0.05 for all tests. The data analysis was conducted using IBM SPSS 20.0 (Armonk, NY, USA).
Results
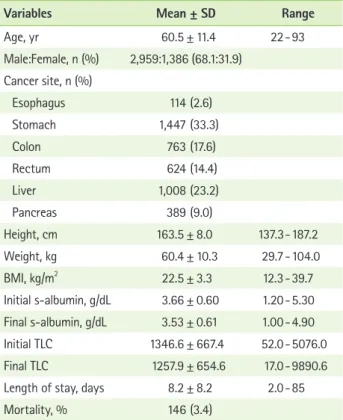
The patients were 60.5 ± 11.4 years old and 2,959 of the 4345 patients (68.1%) were males. The most common cancer site was the stomach (33.3%), followed by the liver (23.2%), the colon (17.6%), the rectum (14.4%), the pancreas (9.0%), and the esophagus (2.6%). Although the hospitalization of most of the patients was elective, 844 patients (19.4%) were admitted unexpectedly. Mean hospital stay was 8.2 ± 8.2
days, ranging from 2 to 85 days. Hospital mortality was 3.4
% (n = 146). Average BMI was 22.5 ± 3.3 kg/m2. A higher percentage of the esophageal and gastric cancer patients (18.8% and 16.6%, respectively) had BMI lower than 18.5 kg/
m2, compared to the other patients in the study (p < 0.0001).
According to the nursing records, 412 patients (30.5%) had experienced involuntary weight loss for three months prior to admission and 447 patients (10.8%) reported decreased food intake for one week prior to admission (Table 2). Based on the nutrition screening criteria, the majority of the patients were at low nutritional risk (n = 3,102 [71.4%]), while 779 patients (17.9%) were at moderate risk, and 464 (10.7%) were at high risk. Although the proportion of HG in the esophageal (18.4%), hepatic (15.3%), pancreatic (12.9%), and gastric cancer patients (12.1%) was higher than the average prevalence among all the patients, the proportion of HG was lower in the rectal (6.2%) and colon cancer patients (3.3%) (Figure 1).
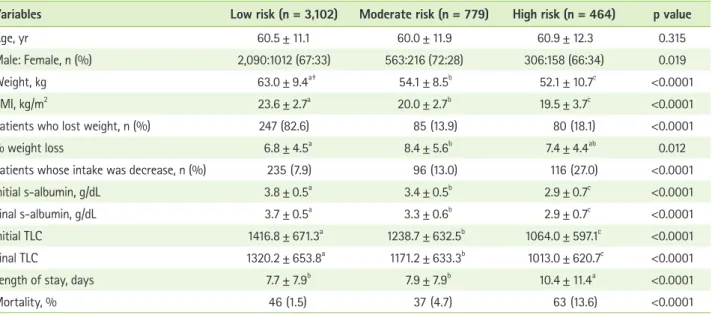
We compared the nutritional parameters, LOS, and mortality among three groups: HG, MG, and LG (Table 3). Average BMI, initial and final serum albumin concentration, and TLC were significantly lower in the HG group than those in the MG and LG groups. Although more patients in the LG group experi- enced weight loss than the patients in the other two groups, a significant difference in the percentage of weight loss to usual weight was only found between the MG group and the LG
Esophagus
Pancreas
Stomach Small bowel Rectum Colon
Low risk
0.0 20.0 40.0 60.0 80.0 100.0 Liver
Moderate risk High risk
Figure 1. Distribution of nutritional risk group according to cancer sites.
Table 2. Patients’ characteristics
Variables Mean ± SD Range
Age, yr 60.5 ± 11.4 22 - 93
Male:Female, n (%) 2,959:1,386 (68.1:31.9) Cancer site, n (%)
Esophagus 114 (2.6)
Stomach 1,447 (33.3)
Colon 763 (17.6)
Rectum 624 (14.4)
Liver 1,008 (23.2)
Pancreas 389 (9.0)
Height, cm 163.5 ± 8.0 137.3 - 187.2
Weight, kg 60.4 ± 10.3 29.7 - 104.0
BMI, kg/m2 22.5 ± 3.3 12.3 - 39.7
Initial s-albumin, g/dL 3.66 ± 0.60 1.20 - 5.30 Final s-albumin, g/dL 3.53 ± 0.61 1.00 - 4.90
Initial TLC 1346.6 ± 667.4 52.0 - 5076.0
Final TLC 1257.9 ± 654.6 17.0 - 9890.6
Length of stay, days 8.2 ± 8.2 2.0 - 85
Mortality, % 146 (3.4)
SD: standard deviation, BMI: body mass index, TLC: total lymphocyte count.
group (8.4 ± 5.6 %, 6.8% ± 4.5, p = 0.012).
Hospital length of stay was significantly longer in the HG group (10.4 ± 11.4 days) than it was in the LG group (7.7 ± 7.9 days) and the MG group (7.9 ± 7.9 days) (p < 0.0001). Hospital mortality was significantly different among the three groups in the chi-square test, and was found to be the highest in the HG group (13.6%) and the lowest in the LG group (1.5%) (p <
0.0001).
We conducted the subgroup analysis according to the ad- mission process, i.e., emergency admission or elective admis- sion (Table 4). The prevalence of HG was higher in the patients who were admitted to the hospital through the emergency department than it was in patients who were electively ad- mitted (24.9% vs. 7.3%, p < 0.0001). The mortality was sig-
nificantly higher in the HG group for both of the subgroup analysis. Although the hospital length of stay was significantly higher in the HG group than it was in the other two groups with elective admission, it was not significantly different in the emergently admitted patients.
We carried out multiple logistic regression analysis to iden- tify the factors associated with mortality and LOS > 10 days, including age, admission source, and nutritional risk (low vs.
moderate-to-high nutritional risk). All of the three parameters were selected for the regression equations for both mortality and LOS > 10 (Table 5).
Table 3. Comparison of nutritional parameters among the 3 groups according to the result of nutrition screening*
Variables Low risk (n = 3,102) Moderate risk (n = 779) High risk (n = 464) p value
Age, yr 60.5 ± 11.1 60.0 ± 11.9 60.9 ± 12.3 0.315
Male: Female, n (%) 2,090:1012 (67:33) 563:216 (72:28) 306:158 (66:34) 0.019
Weight, kg 63.0 ± 9.4a† 54.1 ± 8.5b 52.1 ± 10.7c <0.0001
BMI, kg/m2 23.6 ± 2.7a 20.0 ± 2.7b 19.5 ± 3.7c <0.0001
Patients who lost weight, n (%) 247 (82.6) 85 (13.9) 80 (18.1) <0.0001
% weight loss 6.8 ± 4.5a 8.4 ± 5.6b 7.4 ± 4.4ab 0.012
Patients whose intake was decrease, n (%) 235 (7.9) 96 (13.0) 116 (27.0) <0.0001
Initial s-albumin, g/dL 3.8 ± 0.5a 3.4 ± 0.5b 2.9 ± 0.7c <0.0001
Final s-albumin, g/dL 3.7 ± 0.5a 3.3 ± 0.6b 2.9 ± 0.7c <0.0001
Initial TLC 1416.8 ± 671.3a 1238.7 ± 632.5b 1064.0 ± 597.1c <0.0001
Final TLC 1320.2 ± 653.8a 1171.2 ± 633.3b 1013.0 ± 620.7c <0.0001
Length of stay, days 7.7 ± 7.9b 7.9 ± 7.9b 10.4 ± 11.4a <0.0001
Mortality, % 46 (1.5) 37 (4.7) 63 (13.6) <0.0001
BMI: body mass index, TLC: total lymphocyte count.
*Values are presented as mean ± SD unless otherwise indicated; †Different superscripts represent the significant difference in the post hoc Bonferroni test.
Table 4. Subgroup analysis according to admission route
Variables Low risk Moderate risk High risk p value
Emergency admission N (%) 437 (51.8) 197 (23.3) 210 (24.9) <0.0001*
LOS, days 11.8 ± 11.9 12.2 ± 10.6 14.1 ± 11.1 0.058
Mortality, n (%) 38 (8.7%) 28 (14.2%) 54 (25.7%) <0.0001
Scheduled admission N (%) 2,665 (76.1) 582 (16.6) 254 (7.3)
LOS, days 7.0 ± 6.6b† 6.9 ± 7.4b 8.4 ± 8.7a 0.006
Mortality, n (%) 8 (0.3) 7 (1.2) 9 (3.5) <0.0001
LOS: length of stay.
*p-value for the Chi-square test of distribution of nutritional risk between two groups, emergency admission vs. scheduled admission; †Different superscripts represent the significant difference in the post hoc Bonferroni test.
Discussion
We found that 28.7% of patients were at moderate-to-high nutritional risk on admission and the length of hospital stay and mortality increased more significantly in the HG group than those in the MG or LG groups. The frequency of any degree of malnutrition or risk of developing malnutrition on admission to the hospital varied greatly, depending on the nu- tritional screening tool used. Poulia et al. [15] and Kyle et al. [16]
reported differences in the prevalence of malnutrition among nutrition screening tools even when the tools were applied to the same patients. To identify patients at nutritional risk in daily clinical practice, a screening tool should be an easy, standardized, rapid, noninvasive, and cost-effective diagnostic tool. The ESPEN recommends that NRS 2002 would be used to screen hospitalized adults [14]. Because NRS 2002 is based on anthropometrics, intakes, ages, and metabolic stresses, applying it to the identification of nutrition risk groups for all hospitalized patients can be costly in terms of time and man- power. Kim et al. [17] developed a nutrition screening tool for hospitalized cancer patients using food intake change, Eastern Cooperative Oncology Group (ECOG) performance status, weight loss, and BMI. They reported that 36.2% of their pa- tients were at high nutritional risk, which is higher than the findings in the present study. This might be related to the used parameters to detect recent instability of nutritional status, such as food intake, weight loss, and ECOG status. We chose objective parameters, i.e., albumin, %IBW, and severity of di- agnosis, which have small inter-observer variations and which are easy to identify. However, our approach might fail to reflect recent changes in the patients’ nutritional status and, as a result, the patients’ future risk of aggravating their nutri- tional status might be overlooked. As a 2,000-bed university hospital, 200 to 250 new patients are admitted to Severance Hospital everyday and the hospital has insufficient manpower
to interview all the new patients. Consequently, our screening tool can be effectively used to identify patients who are at nutritional risk, which could result in prolonged LOS or mortal- ity, so they can receive early nutritional intervention.
The present study found significant differences in mortal- ity and LOS among the three groups based on the degrees of nutritional risk, and both of those factors were the highest in the HG group. In the multiple logistic regression analysis, moderate-to-severe nutritional risk, age, and admission route were selected as the factors that would increase mortality and LOS. Of the subjects in the EuroOOPS study [4], 30% of the patients with a solid tumor were defined as “at nutritional risk”
by NRS 2002 and those patients stayed in the hospital for a significantly longer period than the ‘not-at-risk’ patients (9 days vs. 6 days, p < 0.001). In the malnourished patients that Kim et al. [17] assessed using a nutritional screening tool, the mean LOS was 10.8 days; that finding is similar to the results in our study in which the LOS of patients in the HG group was significantly longer than the LOS of well-nourished patients.
High nutritional risk by NRI was also related to increased LOS [18]. The predictive validity of this finding is of major impor- tance, i.e., the individual identified to be at risk by the method is likely to obtain a health benefit from the intervention arising from the screening results. Our nutrition screening tool, which uses a computerized system, might be an effective alternative in a large institution that lacks a sufficient number of person- nel to screen patients. In addition, the nutritional status of GI cancer patients undergoing curative or palliative treatment had a clear effect on both long-term and short-term mortality.
In a retrospective review of 1,555 patients for GI malignancies undergoing chemotherapy, Andreyev et al. [8] indicated that weight loss at presentation may be an independent prognostic variable of shorter overall survival. Preoperative malnutrition was reported as an independent risk factor of postoperative Table 5. Multiple logistic regression analysis for the mortality and prolonged LOS (>10 days)
Dependent variable Variables B SE p value
Mortality Age -5.410 0.502 <0.0001
Admission through ED 2.827 0.225 <0.0001
Moderate to high nutritional risk 1.195 0.190 <0.0001
LOS > 10 days Age -2.560 0.210 <0.0001
Admission through ED 1.024 0.085 <0.0001
Moderate to high nutritional risk 0.174 0.085 0.034
ED: emergency department, LOS: length of stay.
30-day mortality after colorectal cancer resection along with old age, comorbidities (respiratory, vascular, neurologic), emer- gency surgery, and synchronous liver metastasis [19]. Lower serum albumin levels and lower BMI were reported as inde- pendent predictive factors of 30-day mortality after the inser- tion of a palliative self-expanding metal stent in the patients with inoperable or recurrent esophageal cancer [20,21]. Al- though we did not analyze the cause of death of the patients in this study, we showed that the more severely malnourished the patients were, the higher the mortality was. Therefore, our automated screening tool might be useful to identify patients at nutritional risk who could benefit from earlier nutrition in- tervention in a large hospital which is lacking sufficient man- power.
In our study, the prevalence of HG was significantly higher among patients who were emergently hospitalized than it was in patients who were electively hospitalized (24.9% vs. 7.3%, p
< 0.0001). Nutritional risk was associated with increased mor- tality irrespective of admission source and it was only associ- ated with LOS in the electively hospitalized patients. Usually, many cancer patients visit emergency center because of the onset of acute illness, such as complications from anticancer therapy treatments (surgery, chemotherapy, or radiotherapy).
With the exception of the emergently admitted patients, more than 90% of our subjects were electively admitted to the hospital for surgery, chemotherapy, or radiotherapy related to their cancer. In a clinical setting, disease factors assume great- er importance, with disease-associated malnutrition assuming an important, though secondary, role [14]. Therefore, hospital- ization through the emergency room might be a disease factor related to increased nutritional risk. The patients who experi- enced complications during their hospitalization stayed longer, even in the ‘not-at-risk group’, and this finding was similar to the hospitalization stays of ‘at risk’ patients, irrespective of the presence of any complication [4].
The present study has some limitations. As a retrospective study, we could not consider the stage of the patient’s cancer.
Many studies reported that the cancer stage might be as- sociated with nutritional status, resulting in negative clinical outcomes [22]. Although we enrolled cancer patients in this study, we developed the screening tool aimed primarily at the mixed patient population of this hospital, including cancer pa- tients, and we took the severity of the patients’ diagnosis into account, which could affect the patients’ nutritional status.
The present study suggested that emergency admission could
be included as a parameter for nutritional risk. Our nutrition screening tool does not include recent weight loss or food intake, which are the parameters that represent nutritional stability and future risk of development of malnutrition. In particular, knowing if there has been recent weight loss over time helps clinicians identify patients at risk for malnutrition and that factor seems to be the most important single indica- tor of nutritional status [23]. Leuenberger et al. suggested that nutritional screening tools should use both BMI and weight loss to predict risk for malnutrition [24]. In the clinical practice with insufficient numbers of clinical dietitians, nurses could use a survey to identify changes in recent weight loss or food intake. However, further studies must be conducted on the consistency between dietitians and nurses who perform such a survey.
There are few studies that directly link the nutrition process to the improved outcomes. Routine nutritional screening with validated tools can identify patients at risk, but further re- search is needed to evaluate the benefits of nutritional screen- ing and intervention and their effect on outcomes.
Conclusion
In the present study, we found that higher nutritional risk was associated with prolonged hospital stay and increased mortality, using a computerized nutrition screening system that assessed factors such as %IBW, serum albumin concen- tration levels, and the severity of the disease diagnosis. In the multiple logistic regression analysis, moderate-to-severe nutritional risk, determined by our nutrition screening tool, increased age, and emergency admission were selected as significant parameters of mortality and prolonged hospital stay. Further research is needed to evaluate the benefits of nutritional screening and intervention and their effect on out- comes in various disease populations.
References
1. Bozzetti F; SCRINIO Working Group. Screening the nutritional status in oncology: a preliminary report on 1,000 outpatients. Support Care Cancer 2009;17:279-84.
2. Ollenschläger G, Viell B, Thomas W, Konkol K, Bürger B. Tumor an- orexia: causes, assessment, treatment. Recent Results Cancer Res 1991;121:249-59.
3. Paccagnella A, Morassutti I, Rosti G. Nutritional intervention for improving treatment tolerance in cancer patients. Curr Opin Oncol 2011;23:322-30.
4. Sorensen J, Kondrup J, Prokopowicz J, Schiesser M, Krähenbühl L, Meier
R, Liberda M; EuroOOPS study group. EuroOOPS: an international, multicentre study to implement nutritional risk screening and evaluate clinical outcome. Clin Nutr 2008;27:340-9.
5. Lis CG, Gupta D, Lammersfeld CA, Markman M, Vashi PG. Role of nutritional status in predicting quality of life outcomes in cancer--a systematic review of the epidemiological literature. Nutr J 2012;11:27.
6. Gupta D, Lammersfeld CA, Vashi PG, Burrows J, Lis CG, Grutsch JF.
Prognostic significance of Subjective Global Assessment (SGA) in ad- vanced colorectal cancer. Eur J Clin Nutr 2005;59:35-40.
7. Gupta D, Lis CG. Pretreatment serum albumin as a predictor of cancer survival: a systematic review of the epidemiological literature. Nutr J 2010;9:69.
8. Andreyev HJ, Norman AR, Oates J, Cunningham D. Why do patients with weight loss have a worse outcome when undergoing chemo- therapy for gastrointestinal malignancies? Eur J Cancer 1998;34:503-9.
9. Kelsen DP, Ginsberg R, Pajak TF, Sheahan DG, Gunderson L, Mortimer J, Estes N, Haller DG, Ajani J, Kocha W, Minsky BD, Roth JA. Chemo- therapy followed by surgery compared with surgery alone for localized esophageal cancer. N Engl J Med 1998;339:1979-84.
10. Gupta D, Lis CG, Granick J, Grutsch JF, Vashi PG, Lammersfeld CA. Mal- nutrition was associated with poor quality of life in colorectal cancer: a retrospective analysis. J Clin Epidemiol 2006;59:704-9.
11. Isenring E, Bauer J, Capra S. The scored Patient-generated Subjec- tive Global Assessment (PG-SGA) and its association with quality of life in ambulatory patients receiving radiotherapy. Eur J Clin Nutr 2003;57:305-9.
12. Ottery FD. Cancer cachexia: prevention, early diagnosis, and manage- ment. Cancer Pract 1994;2:123-31.
13. Elia M, Stratton R. On the ESPEN guidelines for nutritional screening 2002. Clin Nutr 2004;23:131-2.
14. Kondrup J, Allison SP, Elia M, Vellas B, Plauth M; Educational and Clini- cal Practice Committee, European Society of Parenteral and Enteral Nutrition (ESPEN). ESPEN guidelines for nutrition screening 2002. Clin Nutr 2003;22:415-21.
15. Poulia KA, Yannakoulia M, Karageorgou D, Gamaletsou M, Panagiota-
kos DB, Sipsas NV, Zampelas A. Evaluation of the efficacy of six nutri- tional screening tools to predict malnutrition in the elderly. Clin Nutr 2012;31:378-85.
16. Kyle UG, Kossovsky MP, Karsegard VL, Pichard C. Comparison of tools for nutritional assessment and screening at hospital admission: a population study. Clin Nutr 2006;25:409-17.
17. Kim JY, Wie GA, Cho YA, Kim SY, Kim SM, Son KH, Park SJ, Nam BH, Joung H. Development and validation of a nutrition screening tool for hospitalized cancer patients. Clin Nutr 2011;30:724-9.
18. Kyle UG, Pirlich M, Schuetz T, Lochs H, Pichard C. Is nutritional deple- tion by nutritional risk index associated with increased length of hospital stay? A population-based study. JPEN J Parenter Enteral Nutr 2004;28:99-104.
19. Panis Y, Maggiori L, Caranhac G, Bretagnol F, Vicaut E. Mortality after colorectal cancer surgery: a French survey of more than 84,000 pa- tients. Ann Surg 2011;254:738-43; discussion 743-4.
20. Lecleire S, Di Fiore F, Antonietti M, Ben Soussan E, Hellot MF, Grigioni S, Déchelotte P, Lerebours E, Michel P, Ducrotté P. Undernutrition is predictive of early mortality after palliative self-expanding metal stent insertion in patients with inoperable or recurrent esophageal cancer.
Gastrointest Endosc 2006;64:479-84.
21. Gray RT, O’Donnell ME, Scott RD, McGuigan JA, Mainie I. Impact of nutritional factors on survival in patients with inoperable oesophageal cancer undergoing self-expanding metal stent insertion. Eur J Gastro- enterol Hepatol 2011;23:455-60.
22. Wie GA, Cho YA, Kim SY, Kim SM, Bae JM, Joung H. Prevalence and risk factors of malnutrition among cancer patients according to tumor location and stage in the National Cancer Center in Korea. Nutrition 2010;26:263-8.
23. Kyle UG, Genton L, Pichard C. Hospital length of stay and nutritional status. Curr Opin Clin Nutr Metab Care 2005;8:397-402.
24. Leuenberger M, Kurmann S, Stanga Z. Nutritional screening tools in daily clinical practice: the focus on cancer. Support Care Cancer 2010;18 Suppl 2:S17-27.