Recently, Ambulatory BP (ABP) has been shown to be more closely related to mortality than conven- tional office BP (OBP).1 Using both OBP and ABP, 4 groups of patients were identified: (1) normo- tensive patients (NT, both OBP and ABP were nor- mal); (2) white coat hypertensives (WCHT, OBP
was high, but ABP was normal); (3) masked hyper- tensives (MHT, OBP was normal, but ABP was high);
and (4) sustained hypertensives (SHT, both OBP and ABP were high).2 Electrocardiographic left ventricular hypertrophy (LVH) was found to be greater in MHT and SHT compared with NT and
https://doi.org/10.7180/kmj.2017.32.2.179
Original Article
The significance of blood pressure variation and metabolic risk factors in patients with different stages of hypertension
Sun Min Kim1, In Kyoung Shim1, Ju Won Lee1, Jun Yeob Lee1, Si Won Lee2, Kyoung Im Cho1, Hyun Su Kim1, Jae Woo Lee1, Jung Ho Heo1
1Division of Cardiology, Department of Internal Medicine, Kosin University Gospel Hospital, Busan, Korea
2Department of Internal Medicine, VHM Medical Center, Busan, Korea
Objectives: Blood pressure variation (BPV) and metabolic syndrome is an independent risk factor for cardiovascular events. Ambulatory blood Pressure (ABP) has been shown to be more closely related to cardiovascular events in hypertensive patients than conventional office BP (OBP). Using both OBP and ABP, 4 groups of patients were identified: (1) normotensive patients (NT); (2) white coat hypertensives (WCHT); (3) masked hypertensives (MHT); and (4) sustainedhypertensives (SHT). We investigated the significance of BPV and metabolic risks of these 4 groups.
Methods: This study is a retrospective analysis of patients between January 2008 and May 2013. Echocardiography and 24 hour ABP monitoring were performed.
Results: BMI was significantly higher in the MHT compared with the NT. There were progressive increases in fasting glucose level from NT to WCHT, MHT, and SHT.MHT and SHT had higher 24h and nighttime BPV than NT.MHT was significantly related with BMI (r = 0.139, P = 0.010), creatinine (r = 0.144, P = 0.018), fasting glucose (r = 0.128, P = 0.046), daytime systolic BPV (r = 0.130, P = 0.017), and daytime diastolic BPV (r = 0.130, P = 0.017). Dyslipidemia (r = 0.110, P = 0.043), nighttime systolic BPV (r = 0.241, P < 0.001) and nighttime diastolic BPV (r = 0.143, P = 0.009) shown correlation with SHT. In multivariate logistic regression, MHT was independently associated with Body mass index (OR 1.086, 95% CI 1.005-1.174, P = 0.038) and creatinine (OR 1.005, 95% CI 1.001-1.010, P = 0.045).
Conclusions: BPV and metabolic risk factors were found to be greater in MHT and SHT compared with NT and WCHT. This suggests that BPV and metabolic risks may contribute to the elevated cardiovascular risk observed in patients with MHT and SHT.
Key Words: Masked hypertension, Metabolic syndrome, White coat hypertension
Corresponding Author: Jung Ho Heo, Division of Cardiology, Department of Internal Medicine, Kosin University Gospel Hospital, 262, Gamcheon-ro, Seo-gu, Busan 49267, Korea
Tel: +82-51-990-3421 Fax: +82-51-990-3047 E-mail: [email protected]
Received:
Revised:
Accepted:
Aug. 06, 2015 Aug. 13, 2015 Oct. 26, 2015
WCHT.3 The incidence of cardiovascular death progressively increased from NT to WCHT, MHT, and SHT.4
It has recently been suggested that the occurrence of cardiovascular complications may be related not only to the severity of BP values, but also to the degree of BP variations (BPV).5 In fact, BPV proved to be an independent predictor of cardiovascular mortality in the general population.6 It has been shown that there is an independent association be- tween the presence of organ damage and increased BPV in hypertensive patients.7
The metabolic syndrome (MS) represents a clus- ter of metabolic risk factors which promote car- diovascular target organ damage.8 Some studies suggested that the MS correlates with the 24-hour blood pressure parameters.3,9 MS was associated with impaired circadian rhythm9 and most of the metabolic risk factors were higher in patients with MHT and SHT when compared to SNT and WCHT.3 However, there is no reported data about the BPV and metabolic risk factors Thus we investigated the significance of BPV and metabolic risk factors in these 4 groups.
MATERIALS AND METHODS
Subjects
This was a retrospective study approved by the ethics committee at our institution. The study in- cluded patients attending a cardiology outpatient clinic due to initial hypertension evaluation be-
tween January 2008 and October 2013., Ambulatory Blood Pressure Measurement was included as a rou- tine evaluation all the patients suspected with hypertension. Exclusion criteria included secon- dary hypertension, significant liver disease, neuro- logic disorders, malignancy, valvular heart disease, heart failure, history of acute coronary syndrome, history of myocardial infarction, history of coronary or carotid revascularization procedure, ischemic leg ulcer, peripheral revascularization, or amputation.
Demographic information recorded at the first visit included age, sex, height, weight, medications, smoking history, and past medical history. Blood was drawn for measurement of a complete blood cell count, total serum cholesterol, triglycerides, high-density lipoprotein (HDL) cholesterol, low-density lipoprotein (LDL) cholesterol, blood glucose, creatinine, uric acid and high sensitivity C-reactive protein (hs-CRP). Body mass index (BMI) was calculated as the ratio of weight in kilograms to height in square meters. Body surface area (BSA) was calculated using the DuBois-DuBois formula.10
Office Blood Pressure Measurement
Office BP measurements were performed by a trained nurse with a mercury sphygmomanometer.
Measurements were taken using an appro- priate-sized cuff after the patients had rested for 5 min in a sitting position, with their arm comfort- ably positioned at the level of the heart.
Ambulatory Blood Pressure Measurement (ABPM)
ABPM was performed on each patient's non-dom- inant arm using an automatic oscillometric device (TONOPORT V, PAR Medizintechnik, Berlin, Germany). The accuracy of the device was checked against the standard auscultatory method to ensure that the difference in BP measurements between methods did not exceed 5 mmHg. All patients were instructed to rest or sleep overnight between 10:00 PM and 7:00 AM and to continue their usual activities during the day between 7:00 AM and 10:00 PM.
The device was set to obtain BP readings at 20min intervals during the day (07:00 AM–10:00 PM) and at 40min intervals at night (10:00 PM–07:00 AM).
Each ABPM dataset was automatically scanned to remove artifactual readings according to pre- selected editing criteria. Data were edited by omit- ting all readings of zero, all heart rate readings of < 20 or > 200, all diastolic BP (DBP) readings of > 150 and < 40 mmHg, all systolic BP (SBP) readings of > 240 and < 70 mmHg, and all readings where the difference between the SBP and DBP was less than 10 mmHg. The following ABPM parameters were evaluated: average ambulatory 24h, daytime, and nighttime SBP and DBP levels; mean ambula- tory 24h, daytime, and nighttime BPs; and ambula- tory 24h, daytime, and nighttime BP variability (BPV). Dipping was defined as a > 10% reduction in the average SBP and DBP at night as compared with the average awake values. Among the many kinds of blood pressure variability, Short-term blood pressure variability defined as the oscillation of blood pressure within 24 hours is used including 24 hours, daytime and nighttime standard devia-
tion (SD).11
Diagnosis of hypertension
All patients were classified into one of four cate- gories based on the recommendations of the European Society of Hypertension12: normo- tension (NT) with office SBP/DBP of < 140/90 mmHg and mean daytime ambulatory SBP/DBP of < 135/85 mmHg, white coat hypertension (WCHT) with an office SBP/DBP of ≥ 140/90 mmHg and mean daytime ambulatory SBP/DBP of <
135/85 mmHg, masked hypertension (MHT) with an office SBP/DBP of < 140/90 mmHg and mean daytime ambulatory SBP/DBP of ≥ 135/85 mmHg, and sustained hypertension (SHT) with an office SBP/DBP of ≥ 140/90 mmHg and mean daytime ambulatory SBP/DBP of ≥ 135/85 mmHg.
Echocardiographic Measurements
Standard 2-dimensional echocardiography were performed on all subjects while lying in the left lateral decubitus position using a 3.5-MHz transducer (Philips iE33, Philips Medical Systems, Bothell, WA, USA). Measurements of the thickness of interventricular septum and posterior wall, the diameter of the LV cavity, and the LV mass index (LVMI) were performed in accordance with the guide- lines of the American Society of Echocardiography.13 Two-dimensional, M-mode, and color measure- ments were recorded. Left ventricular (LV) systolic function was assessed according to ejection fraction. LV diastolic function was assessed by re- cording mitral flow using a standard pulsed
Doppler technique, and measurements of early diastolic peak flow velocity (E), late diastolic peak flow velocity (A), and the ratio of early to late flow velocity peaks (E/A ratio). LV end-diastolic meas- urements included left ventricular internal dia- stolic diameter (LVIDD), IVST, and posterior wall thickness (PWT). LVM was estimated using the American Society of Echocardiography Formula.14 The following formulas were also used: estimated LVM (g) = 0.80 [1.04 (LVIDD + PWT +IVST)3 - (LVIDD)3] + 0.6g; LVM index (LVMI) = LVM/BSA;
and relative wall thickness (RWT) =2×PWT/LVIDD.
Left ventricular hypertrophy (LVH) was defined by LVMI thresholds of 115 g/㎡ for men, and 95 g/㎡
for women.
Statistics
Statistical analyses were performed using com- mercially available computer software; SPSS 18.0 for windows (SPSS Inc., Chicago, IL, USA). Values are expressed as means ± standard deviations or as percentages (%). Parameter differences among the 4 groups were evaluated using one-way ANOVAs. For post hoc analysis of normally dis- tributed variables, Tukey's b tests were used. For post hoc analysis of non-normally distributed vari- ables, Bonferroni corrected Mann–Whitney U-tests were used. For comparison of categorical varia- bles, Chi-square tests or Fisher's exact tests were used, as appropriate. Multivariate logistic re- gression analyses related with MHT and SHT was performed after adjustment for clinical variables.
A value of P-values < 0.05 was considered to be
statistically significant.
RESULTS
Initially, 599 patients were enrolled in this study.
Among them, 340 underwent echocardiography.
Patients were divided into 4 groups according to OBP and ABP as defined above: NT (N = 88) was composed of patients with normotension, WCHT (N = 53) was composed of patients with white coat hypertension, MHT (N = 134) was composed of patients with masked hypertension, and SHT (N
= 65) was composed of patients with sustained hypertension.
Baseline Characteristics
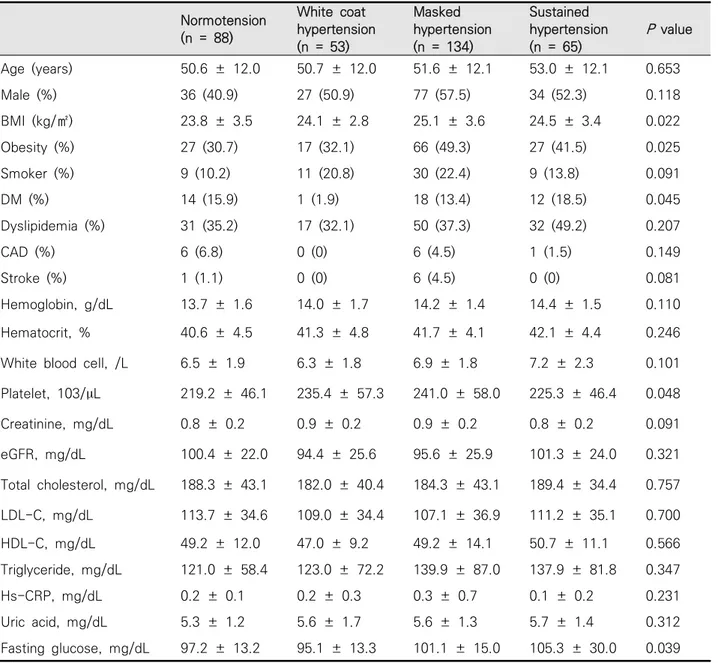
Comparisons of demographic, clinical, and lab- oratory parameters among the 4 groups are shown in Table 1. The mean age of the 340 patients was 51.5 ± 12.1 years. Of these individuals, 51.2% were male and 17.4% were smokers. In addition, 13.2%
had a history of diabetes mellitus (DM) and 38.2%
had a history of dyslipidemia. Overall, the mean OBP was 129.0 ± 18.1/77.7 ± 13.3 mmHg, and the mean daytime ABP was 140.2 ± 14.7/89.7 ± 11.3 mmHg. There was a total of 88 NT patients (age 50.6 ± 12.0 years, male 40.9%), 53 WCHT patients (age 50.7 ± 12.0 years, male 50.9%), 134 MHT patients (age 51.6 ± 12.1 years, male 57.5%), and 65 SHT patients (age 53.0 ± 12.1 years, male 52.3%). There were no significant differences in age, sex, smoking status, history of dyslipidemia,
history of cardiovascular disease, or history of stroke among the 4 groups. There were progressive increases in BMI, percentage of obese patients, percentage of patients with DM, and platelet count from NT to WCHT, SHT, and MHT. There was also a progressive increase in fasting glucose level from NT to WCHT, MHT, and SHT. On post hoc analysis,
BMI was significantly higher in the MHT compared with the NT.
Office Blood Pressure and Ambulatory Blood Pressure Parameters
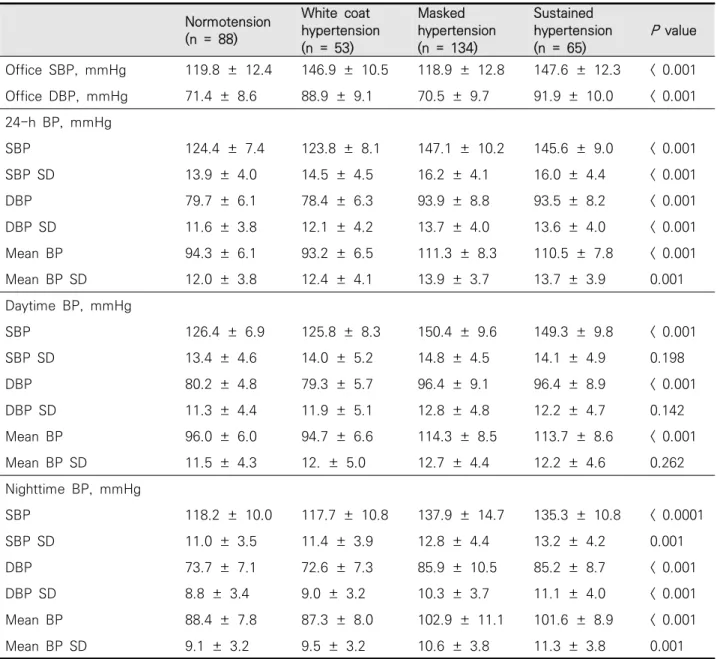
Comparisons of OBP and ABP are shown in Table 2. There were significant differences in OBP and Normotension
(n = 88)
White coat hypertension (n = 53)
Masked hypertension (n = 134)
Sustained hypertension (n = 65)
P value
Age (years) 50.6 ± 12.0 50.7 ± 12.0 51.6 ± 12.1 53.0 ± 12.1 0.653
Male (%) 36 (40.9) 27 (50.9) 77 (57.5) 34 (52.3) 0.118
BMI (kg/㎡) 23.8 ± 3.5 24.1 ± 2.8 25.1 ± 3.6 24.5 ± 3.4 0.022
Obesity (%) 27 (30.7) 17 (32.1) 66 (49.3) 27 (41.5) 0.025
Smoker (%) 9 (10.2) 11 (20.8) 30 (22.4) 9 (13.8) 0.091
DM (%) 14 (15.9) 1 (1.9) 18 (13.4) 12 (18.5) 0.045
Dyslipidemia (%) 31 (35.2) 17 (32.1) 50 (37.3) 32 (49.2) 0.207
CAD (%) 6 (6.8) 0 (0) 6 (4.5) 1 (1.5) 0.149
Stroke (%) 1 (1.1) 0 (0) 6 (4.5) 0 (0) 0.081
Hemoglobin, g/dL 13.7 ± 1.6 14.0 ± 1.7 14.2 ± 1.4 14.4 ± 1.5 0.110 Hematocrit, % 40.6 ± 4.5 41.3 ± 4.8 41.7 ± 4.1 42.1 ± 4.4 0.246 White blood cell, /L 6.5 ± 1.9 6.3 ± 1.8 6.9 ± 1.8 7.2 ± 2.3 0.101 Platelet, 103/µL 219.2 ± 46.1 235.4 ± 57.3 241.0 ± 58.0 225.3 ± 46.4 0.048 Creatinine, mg/dL 0.8 ± 0.2 0.9 ± 0.2 0.9 ± 0.2 0.8 ± 0.2 0.091 eGFR, mg/dL 100.4 ± 22.0 94.4 ± 25.6 95.6 ± 25.9 101.3 ± 24.0 0.321 Total cholesterol, mg/dL 188.3 ± 43.1 182.0 ± 40.4 184.3 ± 43.1 189.4 ± 34.4 0.757 LDL-C, mg/dL 113.7 ± 34.6 109.0 ± 34.4 107.1 ± 36.9 111.2 ± 35.1 0.700 HDL-C, mg/dL 49.2 ± 12.0 47.0 ± 9.2 49.2 ± 14.1 50.7 ± 11.1 0.566 Triglyceride, mg/dL 121.0 ± 58.4 123.0 ± 72.2 139.9 ± 87.0 137.9 ± 81.8 0.347
Hs-CRP, mg/dL 0.2 ± 0.1 0.2 ± 0.3 0.3 ± 0.7 0.1 ± 0.2 0.231
Uric acid, mg/dL 5.3 ± 1.2 5.6 ± 1.7 5.6 ± 1.3 5.7 ± 1.4 0.312 Fasting glucose, mg/dL 97.2 ± 13.2 95.1 ± 13.3 101.1 ± 15.0 105.3 ± 30.0 0.039 BMI, body mass index; DM, diabetes mellitus; CAD, coronary artery disease; LDL-C, low-density lipoprotein cholesterol; HDL-C, high-density lipoprotein cholesterol; Hs-CRP, high-sensitivity C-reactive protein
Tabel 1. The demographic, clinical, and laboratory findings among the 4 groups of patients
APB among the 4 groups. By definition, WCHT and SHT had higher OBP than NT and MHT (P
< 0.05). MHT and SHT had higher ABP than NT and WCHT (P < 0.05). There were also significant differences at 24h and nighttime BPV among the 4 groups. NT and WCHT had similar 24h and night- time BPV, as did MHT and SHT. On post hoc analy-
sis, MHT and SHT had higher 24h and nighttime BPV than NT (P < 0.05).
Echocardiographic Findings
Comparisons of echocardiographic findings among the 4 groups of patients are shown in Table 3. There were no significant differences in echo- Normotension
(n = 88)
White coat hypertension (n = 53)
Masked hypertension (n = 134)
Sustained hypertension (n = 65)
P value
Office SBP, mmHg 119.8 ± 12.4 146.9 ± 10.5 118.9 ± 12.8 147.6 ± 12.3 < 0.001 Office DBP, mmHg 71.4 ± 8.6 88.9 ± 9.1 70.5 ± 9.7 91.9 ± 10.0 < 0.001 24-h BP, mmHg
SBP 124.4 ± 7.4 123.8 ± 8.1 147.1 ± 10.2 145.6 ± 9.0 < 0.001 SBP SD 13.9 ± 4.0 14.5 ± 4.5 16.2 ± 4.1 16.0 ± 4.4 < 0.001
DBP 79.7 ± 6.1 78.4 ± 6.3 93.9 ± 8.8 93.5 ± 8.2 < 0.001
DBP SD 11.6 ± 3.8 12.1 ± 4.2 13.7 ± 4.0 13.6 ± 4.0 < 0.001 Mean BP 94.3 ± 6.1 93.2 ± 6.5 111.3 ± 8.3 110.5 ± 7.8 < 0.001 Mean BP SD 12.0 ± 3.8 12.4 ± 4.1 13.9 ± 3.7 13.7 ± 3.9 0.001 Daytime BP, mmHg
SBP 126.4 ± 6.9 125.8 ± 8.3 150.4 ± 9.6 149.3 ± 9.8 < 0.001
SBP SD 13.4 ± 4.6 14.0 ± 5.2 14.8 ± 4.5 14.1 ± 4.9 0.198
DBP 80.2 ± 4.8 79.3 ± 5.7 96.4 ± 9.1 96.4 ± 8.9 < 0.001
DBP SD 11.3 ± 4.4 11.9 ± 5.1 12.8 ± 4.8 12.2 ± 4.7 0.142
Mean BP 96.0 ± 6.0 94.7 ± 6.6 114.3 ± 8.5 113.7 ± 8.6 < 0.001
Mean BP SD 11.5 ± 4.3 12. ± 5.0 12.7 ± 4.4 12.2 ± 4.6 0.262
Nighttime BP, mmHg
SBP 118.2 ± 10.0 117.7 ± 10.8 137.9 ± 14.7 135.3 ± 10.8 < 0.0001
SBP SD 11.0 ± 3.5 11.4 ± 3.9 12.8 ± 4.4 13.2 ± 4.2 0.001
DBP 73.7 ± 7.1 72.6 ± 7.3 85.9 ± 10.5 85.2 ± 8.7 < 0.001
DBP SD 8.8 ± 3.4 9.0 ± 3.2 10.3 ± 3.7 11.1 ± 4.0 < 0.001
Mean BP 88.4 ± 7.8 87.3 ± 8.0 102.9 ± 11.1 101.6 ± 8.9 < 0.001
Mean BP SD 9.1 ± 3.2 9.5 ± 3.2 10.6 ± 3.8 11.3 ± 3.8 0.001
SBP, systolic blood pressure; DBP, diastolic blood pressure; SD, standard deviation; HR, heart rate
Tabel 2. The comparison between office and ambulatory blood pressure findings among the 4 groups of patients
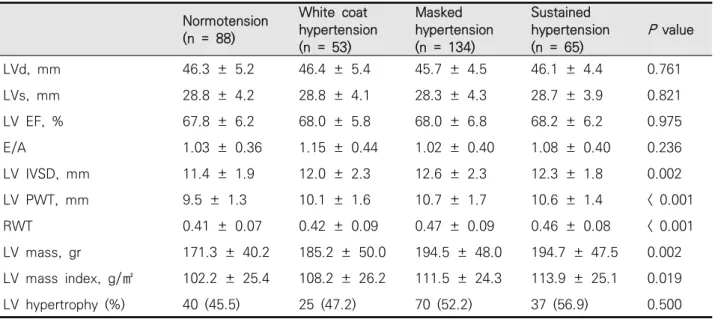
cardiographic LV systolic function and diastolic function. There were significant differences in LV interventricular septal dimension (IVSD), LV poste- rior wall thickness (PWT), RWT, LVM, and LVMI among the 4 groups. MHT had the highest LV IVSD, LV PWT, and RWT. LVM and LVMI progressively increased from NT to SHT (P = 0.002, P = 0.019).
A total of 172 of the 340 patients (50.3%) were found to have LVH. The percentages of patients with LVH progressively increased from NT to SHT, but these differences were not significant (P = NS).
Correlation Analysis between the Blood pres- sure groups and risk factors
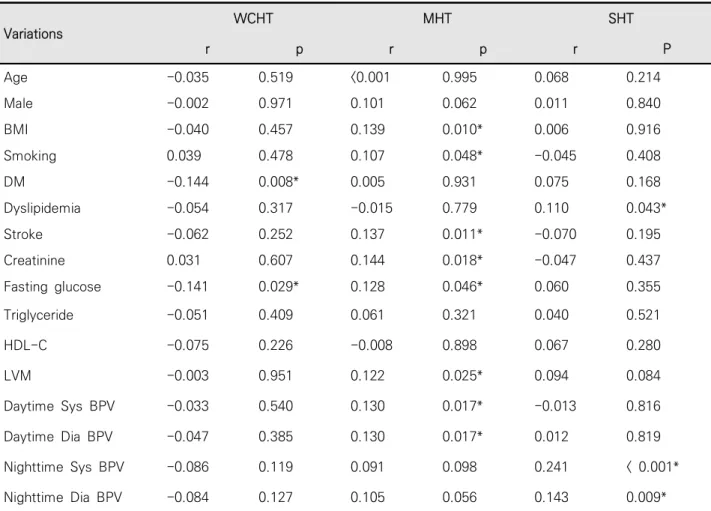
Univariate Logistic regression analysis was per- formed to evaluate factors for WCHT, MHT, and SHT (Table 4). WCHT was negatively related with DM (r = -0.144, P = 0.008) and fasting glucose (r = -0.141, P = 0.029). MHT was significantly related with BMI (r = 0.139, P = 0.010), smoking (r = 0.107,
P = 0.048), stroke (r = 0.137, P = 0.011), creatinine (r = 0.144, P = 0.018), fasting glucose (r = 0.128, P = 0.046), LVM (r = 0.122, P = 0.025), daytime systolic BPV (r = 0.130, P = 0.017), and daytime diastolic BPV (r = 0.130, P = 0.017). Dyslipidemia (r = 0.110, P = 0.043), nighttime systolic BPV (r
= 0.241, P < 0.001) and nighttime diastolic BPV (r = 0.143, P = 0.009) shown correlation with SHT.
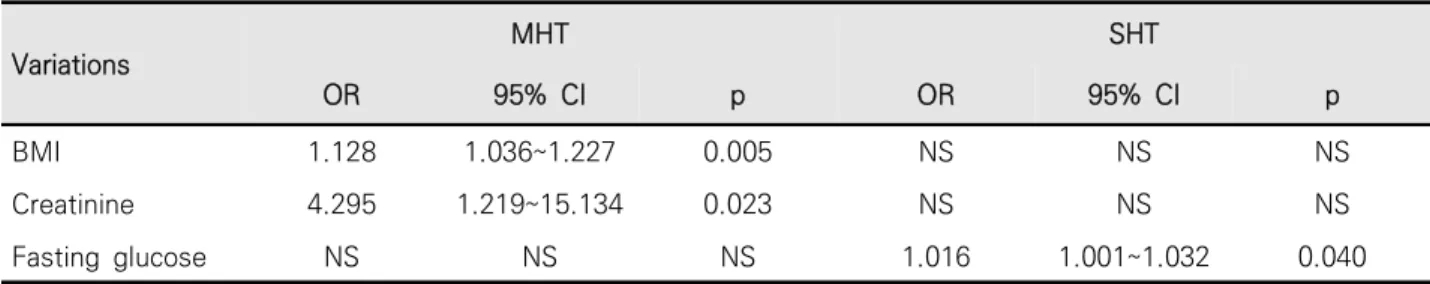
Multivariate Logistic Regression Analysis We used multivariate logistic regression analysis including dependent variables for MHT and SHT (Table 5). The results showed that MHT was in- dependently associated with BMI (OR 1.086, 95%
CI 1.005-1.174, P = 0.038) and creatinine (OR 1.005, 95% CI 1.001-1.010, P = 0.045). SHT was associated with fasting glucose level (OR 1.021, 95% CI 1.004-1.037, P = 0.012).
Normotension (n = 88)
White coat hypertension (n = 53)
Masked hypertension (n = 134)
Sustained hypertension (n = 65)
P value
LVd, mm 46.3 ± 5.2 46.4 ± 5.4 45.7 ± 4.5 46.1 ± 4.4 0.761
LVs, mm 28.8 ± 4.2 28.8 ± 4.1 28.3 ± 4.3 28.7 ± 3.9 0.821
LV EF, % 67.8 ± 6.2 68.0 ± 5.8 68.0 ± 6.8 68.2 ± 6.2 0.975
E/A 1.03 ± 0.36 1.15 ± 0.44 1.02 ± 0.40 1.08 ± 0.40 0.236
LV IVSD, mm 11.4 ± 1.9 12.0 ± 2.3 12.6 ± 2.3 12.3 ± 1.8 0.002 LV PWT, mm 9.5 ± 1.3 10.1 ± 1.6 10.7 ± 1.7 10.6 ± 1.4 < 0.001
RWT 0.41 ± 0.07 0.42 ± 0.09 0.47 ± 0.09 0.46 ± 0.08 < 0.001
LV mass, gr 171.3 ± 40.2 185.2 ± 50.0 194.5 ± 48.0 194.7 ± 47.5 0.002 LV mass index, g/㎡ 102.2 ± 25.4 108.2 ± 26.2 111.5 ± 24.3 113.9 ± 25.1 0.019
LV hypertrophy (%) 40 (45.5) 25 (47.2) 70 (52.2) 37 (56.9) 0.500
Tabel 3. Comparison of echocardiographic findings among the 4 groups of patients
DISCUSSION
There are few studies investigating the associa- tion of BPV and metabolic risk factors of the hyper- tensive patients. The main finding of our report is that BPV and metabolic risk profile of patients has a different association with hypertensive progression. WCHT was no significant relationship with BPV and negatively related with DM and fast- ing glucose. MHT was correlated with daytime BPV and independently associated with BMI and Cr.
SHT was correlated with nighttime BPV and in- dependently associated with fasting glucose. Our investigation suggest a possible link and different role between BPV and metabolic derangement in hypertension.
Ambulatory BP monitoring has enabled a non-invasive estimate of BP variability to be obtained. Several studies suggest that ABPM-de- rived BP short-term variability can have a prog- nostic relevance, predicting organ damage and cardiovascular events over and above the con- Variations
WCHT MHT SHT
r p r p r P
Age -0.035 0.519 <0.001 0.995 0.068 0.214
Male -0.002 0.971 0.101 0.062 0.011 0.840
BMI -0.040 0.457 0.139 0.010* 0.006 0.916
Smoking 0.039 0.478 0.107 0.048* -0.045 0.408
DM -0.144 0.008* 0.005 0.931 0.075 0.168
Dyslipidemia -0.054 0.317 -0.015 0.779 0.110 0.043*
Stroke -0.062 0.252 0.137 0.011* -0.070 0.195
Creatinine 0.031 0.607 0.144 0.018* -0.047 0.437
Fasting glucose -0.141 0.029* 0.128 0.046* 0.060 0.355
Triglyceride -0.051 0.409 0.061 0.321 0.040 0.521
HDL-C -0.075 0.226 -0.008 0.898 0.067 0.280
LVM -0.003 0.951 0.122 0.025* 0.094 0.084
Daytime Sys BPV -0.033 0.540 0.130 0.017* -0.013 0.816
Daytime Dia BPV -0.047 0.385 0.130 0.017* 0.012 0.819
Nighttime Sys BPV -0.086 0.119 0.091 0.098 0.241 < 0.001*
Nighttime Dia BPV -0.084 0.127 0.105 0.056 0.143 0.009*
BMI. Bosy mass index; DM. diabetes mellitus; HDL-C, high density lipoprotein cholesterol; LVM, left ventricular mass; BPV,Sys, systolic; Dia, diastolic; blood pressure variability
P < 0.05 ;*
Tabel 4. Correlation between hypertension groups and metabolic risk factors including blood pressure variability index.
tribution provided by average BP values in different populations.15
Higher BPV may lead to increased oscillatory shear stress to the vascular endothelium, poten- tially contributing to early atherosclerosis (eg, in- creased expression of adhesion molecules, pro-oxidant processes, and NO synthase reduc- tion) more than steady blood flow.16 Rebellato re- ported ABPM-derived short term BP variability is increased n Cushing’s syndrome.17
In present study. MHT and SHT have a relation- ship with higher BPV and metabolic risk factors comparing to NT and WCHT. BPV is similar in MHT and SHT, which is higher than that of NT and WCHT in elderly patients.18 It was reported that various metabolic risk factors like BMI, waist circumference, fasting glucose, and uric acid were associated with MHT and SHT compared to NT and WCHT.3,19,20 The potential explanation is that BPV is regulated by the autonomic nervous system activation and arterial baroreflex, and related with vascular resistance and arterial stiffness.5,21 Obesity initiates increased sympathetic outflow and vascular resistance, and develops hyper- tension3. Increased fasting glucose hasten the ar-
terial stiffening process, leading to changes in con- tents of arterial vessel wall.22 However, the patho- physiology are still poorly understood.23 Metabolic risks is associated with cardiovascular mortality and morbidity.24 Recent studies have suggested that BPV affects the progression of organ damage and cardiovascular events.22,25,26 This finding sug- gests that BPV and metabolic risks may contribute to the elevated cardiovascular risk observed in pa- tients with MHT and SHT.18
It is unclear whether the presence of WCHT por- tends future risk for cardiovascular complications.
While some studies have suggested WCHT as a risk factor,27 others showed that patients with WCHT had a favorable prognosis.28 Thus the prognostic significance of WCHT remains controversial.29 In the present study, WCHT was similar to NT in terms of LVH and BP parameters, negatively related with DM, and therefore may have a similar cardiovascular prognosis.
This study has several limitations. First, the study was retrospective in nature and included all the patients with ABPM with different onset and se- verity of hypertension. Therefore the hetero- geneity of the study population, the small and un- Variations
MHT SHT
OR 95% CI p OR 95% CI p
BMI 1.128 1.036~1.227 0.005 NS NS NS
Creatinine 4.295 1.219~15.134 0.023 NS NS NS
Fasting glucose NS NS NS 1.016 1.001~1.032 0.040
Multivariate logistic regression analyses related with MHT and SHT was performed after adjustment for clinical variables including age, BMI, DM, Dyslipidemia, Creatinine, Fasting glucose, Triglyceride, and HDL-C
Table 5. Multivariate logistic regression of masked hypertension and sustained hypertension
even number of patients included in the four groups may have influenced our results. Third, each meas- urement was taken once, raising the question of reproducibility. Thus, serial measurements would be better for more accurate interpretation of the results. Fourth, Lastly, although it was acceptable that BP measurements were adequate for classi- fication into 1 of the 4 groups, it would be better if home or self blood pressure monitoring data were available for the patients.
In conclusion, BPV and metabolic risk profile of patients has a different association with different stages of hypertensive progression. Further evalu- ation of BPV and metabolic risk factor relation is needed in multiple states of hypertension progression.
BPV and metabolic risk factors were found to be greater in MHT and SHT compared with NT and WCHT. This suggests that BPV and metabolic risks may contribute to the elevated cardiovascular risk observed in patients with MHT and SHT.
Additional research is required to verify the re- ported results in prospective studies and prove the clinical significance of BPV and metabolic risk factors.
REFERENCES
1. Dolan E, Stanton A, Thijs L, Hinedi K, Atkins N, McClory S, et al. Superiority of ambulatory over clinic blood pressure measurement in pre-
dicting mortality: The Dublin outcome study.
Hypertension 2005;46:156-61.
2. Bobrie G, Clerson P, Menard J, Postel-Vinay N, Chatellier G, Plouin PF. Masked hypertension:
A systematic review. Journal of hypertension 2008;26:1715-25.
3. Afsar B. Comparison of demographic, clinical, and laboratory parameters between patients with sustained normotension, white coat hypertension, masked hypertension, and sustained hypertension.
J Cardiol 2013;61:222-6.
4. Asmar R, Garcia-Puig J, Gosse P, Karpov YA, De Leeuws PW, Magometschniggs D, et al.
Ambulatory blood pressure in hypertensive pa- tients with left ventricular hypertrophy: Efficacy of first-line combination perindopril/in- dapamide therapy. Vasc Health Risk Manag 2007;3:371-80.
5. Leoncini G, Viazzi F, Storace G, Deferrari G, Pontremoli R. Blood pressure variability and multiple organ damage in primary hypertension.
J Hum Hypertens 2013;27:663-70.
6. Mancia G, Bombelli M, Facchetti R, Madotto F, Corrao G, Trevano FQ, et al. Long-term prog- nostic value of blood pressure variability in the general population: Results of the Pressioni Arteriose Monitorate e Loro Associazioni Study.
Hypertension 2007;49:1265-70.
7. Mancia G, Parati G, Hennig M, Flatau B, Omboni S, Glavina F, et al. Relation between blood pres- sure variability and carotid artery damage in hypertension: Baseline data from the european lacidipine study on atherosclerosis (elsa). J
Hypertens 2001;19:1981-9.
8. Grundy SM, Brewer HB Jr, Cleeman JI, Smith SC Jr, Lenfant C. Definition of metabolic syn- drome: Report of the national heart, lung, and blood institute/american heart association con- ference on scientific issues related to definition.
Circulation 2004;109:433-8.
9. Hermida RC, Chayan L, Ayala DE, Mojon A, Fontao MJ, Fernandez JR. Relationship between metabol- ic syndrome, circadian treatment time, and blood pressure non-dipping profile in essential hypertension. Chronobiol int 2011;28:509-19.
10. Du Bois D, Du Bois EF. A formula to estimate the approximate surface area if height and weight be known. 1916. Nutrition 1989;5:303-11; dis- cussion 312-303.
11. Parati G, Ochoa JE, Lombardi C, Bilo G. Assessment and management of blood-pressure variability.
Nat Rev Cardiology 2013;10:143-55.
12. O'Brien E, Asmar R, Beilin L, Imai Y, Mallion JM, Mancia G, et al. European society of hyper- tension recommendations for conventional, am- bulatory and home blood pressure measurement.
J Hypertens 2003;21:821-48.
13. Gottdiener JS, Bednarz J, Devereux R, Gardin J, Klein A, Manning WJ, et al. American society of echocardiography recommendations for use of echocardiography in clinical trials. J Am Soc Echocardiogr 2004;17:1086-119.
14. Lang RM, Bierig M, Devereux RB, Flachskampf FA, Foster E, Pellikka PA, et al. Recommendations for chamber quantification: a report from the American Society of Echocardiography's
Guidelines and Standards Committee and the Chamber Quantification Writing Group, devel- oped in conjunction with the European Association of Echocardiography, a branch of the European Society of Cardiology. J Am Soc Echocardiogr 2005;18:1440-63.
15. Pierdomenico SD, Di Nicola M, Esposito AL, Di Mascio R, Ballone E, Lapenna D, et al. Prognostic value of different indices of blood pressure varia- bility in hypertensive patients. Am J Hypertens 2009;22:842-7.
16. Silacci P, Desgeorges A, Mazzolai L, Chambaz C, Hayoz D. Flow pulsatility is a critical determi- nant of oxidative stress in endothelial cells.
Hypertension 2001;38:1162-6.
17. Rebellato A, Grillo A, Dassie F, Sonino N, Maffei P, Martini C, et al. Ambulatory blood pressure monitoring-derived short-term blood pressure variability is increased in cushing's syndrome.
Endocrine 2014;47:557-63.
18. Cacciolati C, Tzourio C, Hanon O. Blood pressure variability in elderly persons with white-coat and masked hypertension compared to those with nor- motension and sustained hypertension. Am J Hypertens 2013;26:367-72.
19. Bjorklund K, Lind L, Zethelius B, Andren B, Lithell H. Isolated ambulatory hypertension predicts cardiovascular morbidity in elderly men.
Circulation 2003;107:1297-302.
20. Mancia G, Bombelli M, Facchetti R, Madotto F, Quarti-Trevano F, Polo Friz H, et al. Long-term risk of sustained hypertension in white-coat or masked hypertension. Hypertension 2009;54:226-32.
21. Shin JH, Shin J, Kim BK, Lim YH, Park HC, Choi SI, et al. Within-visit blood pressure variability:
Relevant factors in the general population. J Hum Hypertens 2013;27:328-34.
22. Johansson JK, Niiranen TJ, Puukka PJ, Jula AM.
Prognostic value of the variability in home-meas- ured blood pressure and heart rate: The finn-home study. Hypertension 2012;59:212-8.
23. Faramawi MF, Delongchamp R, Said Q, Jadhav S, Abouelenien S. Metabolic syndrome is asso- ciated with visit-to-visit systolic blood pressure variability in the us adults. Hypertens Res 2014;37:875-9.
24. Kaur J. A comprehensive review on metabolic syndrome. Cardiol Res Pract 2014;2014:943162.
25. Rothwell PM. Limitations of the usual blood-pres- sure hypothesis and importance of variability, instability, and episodic hypertension. Lancet
2010;375:938-48.
26. Rothwell PM, Howard SC, Dolan E, O'Brien E, Dobson JE, Dahlof B, et al. Effects of beta block- ers and calcium-channel blockers on with- in-individual variability in blood pressure and risk of stroke. Lancet neurol 2010;9:469-80.
27. Nakashima T, Yamano S, Sasaki R, Minami S, Doi K, Yamamoto J, et al. White-coat hyper- tension contributes to the presence of carotid arteriosclerosis. Hypertens Res 2004;27:739-45.
28. Verdecchia P, Porcellati C, Schillaci G, Borgioni C, Ciucci A, Battistelli M, et al. Ambulatory blood pressure. An independent predictor of prog- nosis in essential hypertension. Hypertension 1994;24:793-801.
29. Mancia G, Parati G. Ambulatory blood pressure monitoring and organ damage. Hypertension 2000;36:894-900.