Cancer of the Prostate Risk Assessment (CAPRA) Preoperative Score Versus Postoperative Score (CAPRA-S): Ability to Predict Cancer Progression and Decision-Making Regarding Adjuvant Therapy after Radical Prostatectomy
The University of California, San Francisco, announced in 2011 Cancer of the Prostate Risk Assessment Postsurgical (CAPRA-S) score which included pathologic data, but there were no results for comparing preoperative predictors with the CAPRA-S score. We evaluated the validation of the CAPRA-S score in our institution and compare the result with the preoperative progression predictor, CAPRA score. Data of 130 patients were reviewed who underwent radical prostatectomy for localized prostate cancer from 2008 to 2013.
Performance of CAPRA-S score in predicting progression free probabilities was assessed through Kaplan Meier analysis and Cox proportional hazards regression test. Additionally, prediction probability was compared with preoperative CAPRA score by logistic regression analysis. Comparing CAPRA score, the CAPRA-S score showed improved prediction ability for 5 yr progression free survival (concordance index 0.80, P = 0.04). After risk group stratification, 3 group model of CAPRA-S was superior than 3 group model of CAPRA for 3-yr progression free survival and 5-yr progression free survival (concordance index 0.74 vs. 0.70, 0.77 vs. 0.71, P < 0.001). Finally the CAPRA-S score was the more ideal predictor concerned with adjuvant therapy than the CAPRA score through decision curve analysis.
The CPARA-S score is a useful predictor for disease progression after radical prostatectomy.
Keywords: Prostatic Neoplasms; Prostatectomy; Disease Progression; Recurrence Won Ik Seo, Pil Moon Kang,
Dong Il Kang, Jang Ho Yoon, Wansuk Kim, and Jae Il Chung Department of Urology, Busan Paik Hospital, Inje University, Busan, Korea
Received: 7 April 2014 Accepted: 3 June 2014 Address for Correspondence:
Jae Il Chung, MD
Department of Urology, Busan Paik Hospital, Inje University College of Medicine, 75 Bokji-ro, Busanjin-gu, Busan 614-735, Korea
Tel: +82.51-890-6384, Fax: +82.51-892-2728 E-mail: [email protected]
Funding: This study was supported by a grant from INJE University 2014 research fund, Korea.
http://dx.doi.org/10.3346/jkms.2014.29.9.1212 • J Korean Med Sci 2014; 29: 1212-1216
INTRODUCTION
A radical prostatectomy is the most common primary treatment for clinically localized prostate cancer (1). In terms of cancer control, a radical prostatectomy gives good results when the cancer is confined within the prostate (2). Nevertheless, approx- imately one third of patients will experience biochemical recur- rence as shown by prostate-specific antigen (PSA) elevation within 10 yr after a prostatectomy (3-6). An unfavorable pathol- ogy such as extraprostatic disease is detected at prostatectomy in 52% of the patients and is associated with biochemical recur- rence (7-10). Consequently, proper risk stratification after pros- tatectomy is important for individualized treatment and patient counseling.
To facilitate risk stratification, many nomograms and predic- tors have been developed. The Cancer of the Prostate Risk As- sessment (CAPRA) score is one of them. After the CAPRA score was introduced for preoperative prostate cancer risk stratifica- tion, its validity was assessed and relatively good predictability was found (11-19). To improve the accuracy of prediction, the pathology findings were added which was named as CAPRA-S
score was developed by The University of California, San Fran- cisco (13). Recently, its external validity was studied using the Shared Equal Access Regional Cancer Hospital (SEARCH) da- tabase and the results validated its effectiveness and ability to predict biochemical recurrence following surgery (20). Howev- er, no study has compared the validity of the CAPRA-S score with preoperative predictors in Asian populations.
Therefore, this study examined the validity of the CAPRA-S score in our institution and its superiority to other preoperative predictors, especially the CAPRA score, which has been validat- ed in large, multi-institutional and head-to-head studies (17, 20).
MATERIALS AND METHODS
A total of 130 patients who underwent prostatectomy between 2008 and 2013 by a single surgeon as analyzed retrospectively.
The sum of scores of each variables were calculated for CAPRA- S score and CAPRA score. The CAPRA-S scores were calculated using the variables and each scores described in Table 1 (13) and the CAPRA scores were calculated in the same manner with only preoperative variables (21). Fifteen patients were ex- Oncology & Hematology
Table 1. Distribution of the data according to the CAPRA-S and CAPRA scores
Variables Range (points) No. (%)
CAPRA-S score
Pathology Gleason score 2-6 (0) 3+4 (1) 4+3 (2) 8-10 (3)
26 (20) 51 (39.2) 40 (30.8) 13 (10)
PSA at diagnosis 0-6 (0)
6.1-10 (1) 10.1-20 (2)
> 20 (3)
32 (24.6) 37 (28.5) 33 (25.4) 28 (21.5) Extracapsular extension Absent (0)
Present (1) 84 (64.6) 46 (35.4) Seminal vesicle invasion Absent (0)
Present (2) 120 (92.3) 10 (7.7) Surgical margin status Negative (0)
Positive (2)
84 (64.6) 46 (35.4) Lymph node invasion Negative (0)
Positive (1) 125 (96.2) 5 (3.8) CAPRA score
PSA (ng/mL) 2.0-6.0 (0)
6.1-10.0 (1) 10.1-20.0 (2) 20.1-30.0 (3)
> 30 (4)
32 (27.8) 35 (30.4) 28 (24.3) 12 (10.4)
8 (7) Biopsy Gleason score 1-3/1-3 (0)
1-3/4-5 (1) 4-5/1-5 (3)
49 (42.6) 24 (20.9) 42 (36.5)
Clinical T stage T1/T2 (0)
T3a (1) 106 (92.2) 9 (7.8) Percent positive biopsies < 34% (0)
≥ 34% (1)
83 (72.2) 32 (27.8) Age at diagnosis (yr) < 50 (0)
≥ 50 (1) 0 (0)
115 (100)
Table 2. Distribution of patients according the CAPRA-S score and three-risk-group model
Groups No. (%)
CAPRA-S each score group 0
1 2 3 4 5 6 7 8
≥ 9
8 (6.2) 17 (13.1) 14 (10.8) 25 (19.2) 20 (15.4) 13 (10)
9 (6.9) 7 (5.4) 7 (5.4) 10 (7.7) CAPRA-S risk group
Low risk (0-2) Intermediate risk (3-5) High risk ( ≥ 6)
39 (30) 58 (44.6) 33 (25.4)
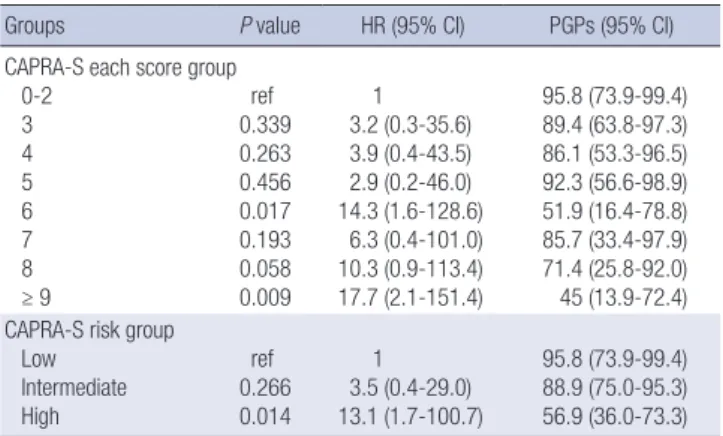
Table 3. The 5-yr progression-free probabilities for the CAPRA-S score groups and three-risk-group model
Groups P value HR (95% CI) PGPs (95% CI)
CAPRA-S 0-2 3 4 5 6 7 8
≥ 9
ref 0.339 0.263 0.456 0.017 0.193 0.058 0.009
1 3.2 (0.3-35.6) 3.9 (0.4-43.5) 2.9 (0.2-46.0) 14.3 (1.6-128.6)
6.3 (0.4-101.0) 10.3 (0.9-113.4) 17.7 (2.1-151.4)
95.8 (73.9-99.4) 89.4 (63.8-97.3) 86.1 (53.3-96.5) 92.3 (56.6-98.9) 51.9 (16.4-78.8) 85.7 (33.4-97.9) 71.4 (25.8-92.0) 45 (13.9-72.4) CAPRA-S risk group
Low Intermediate High
ref 0.266 0.014
1 3.5 (0.4-29.0) 13.1 (1.7-100.7)
95.8 (73.9-99.4) 88.9 (75.0-95.3) 56.9 (36.0-73.3) HR, hazard ratio; CI, confidence interval; PGPs, progression-free probabilities.
each score group
cluded from the CAPRA score group because there were no in- formation about percent positive biopsies. The patients were divided into two groups: each score group and a three-risk level group model (low, intermediate, and high risk). The each score group model means which was stratifying by CAPRA score sum from 0 to 10 point. And of the three-risk group model, low risk groups were 0-2 point and intermediate risk groups were 3-5 point, high risk groups were above 6 point of CAPRA-S score sum (Table 2). Biochemical recurrence after radical prostatec- tomy was defined as two consecutive PSA values ≥ 0.2 ng/mL at any time postoperatively or any additional treatment more than 6 months after the prostatectomy.
The ability of the CAPRA-S score to predict the 3- and 5-yr progression-free probabilities at our institution was examined.
In addition, the 5-yr progression-free probabilities of each score group and the three risk groups were analyzed using Kaplan- Meier analysis and the Cox proportional hazards regression. Fi- nally, the prediction probability of the CAPRA-S score and pre- operative CAPRA score were compared through logistic regres- sion analysis with calculated concordance index (c-index) and decision curve analysis. The statistical analysis was supported by Clinical Trail Center, Inje University Busan Paik Hospital.
Ethics statement
This study protocol was reviewed and approved by the institu- tional review board of the Inje University Busan Paik Hospital (IRB number 13-223). Informed consent was waived due to the retrospective design of the study.
RESULTS
Recurrence occurred in 13.8% of the 130 patients at a median of 13 months (SD 12.1). There was wide distribution of CAPRA-S scores and 25.4% of the patients had scores > 6; these constitut- ed the high-risk group (Table 2).
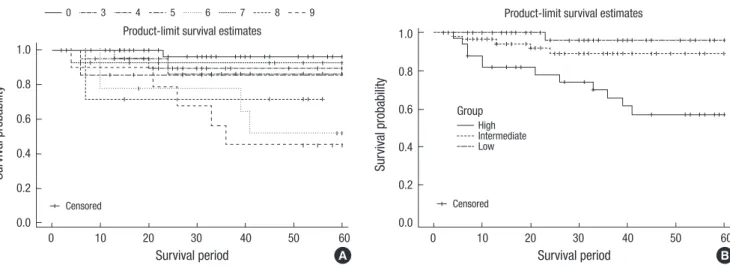
The 5-yr progression-free probabilities for each CAPRA-S score group and the three risk groups are shown in Table 3 and illus- trated in Fig. 1 with Kaplan-Meier curves. For each CAPRA-S score, the progression of disease increased with the risk, although this trend was not significant and had no consistency. Never- theless, the results from the three-risk-group model showed statistical significance in terms of disease progression with in- creasing risk. Especially in the high-risk group (CAPRA-S score
> 6), the 5-yr progression-free probability was 56.9% and its haz- ard ratio was 13.1 (P = 0.014; Fig. 1B).
The CAPRA-S score had a higher c-index than the CAPRA score. Except for the 3-yr progression-free probability, the pre- diction ability of the CAPRA-S score was superior (Table 4). The c-index of each CAPRA-S score group for the 5-yr progression- free probabilities was 0.80, while that of each CAPRA score group was 0.77 (P = 0.041). In the three-risk-group model of the CAP- RA-S score, the 3- and 5-yr progression-free probabilities were significantly higher than for the CAPRA score. The c-index for the 3- and 5-yr progression-free probabilities of the CAPRA-S score was 0.74 and 0.77, respectively, while that of the CAPRA score was 0.70 and 0.71 (P < 0.001).
Finally, the decision curve analysis comparing the CAPRA-S and CAPRA scores indicated a better net benefit of appropri- ately identifying patients for adjuvant therapy with both scoring systems (Fig. 2). Although the CAPRA-S score did not cover all of the threshold probabilities, it resulted in a more ideal curve than the CAPRA score and both curves did not locate below of the reference curves.
DISCUSSION
The CAPRA score has been validated externally in the US and
European multi-institutional studies with high accuracy with c- indexes ranging from 0.66 to 0.81 (12, 16-19). Another study de- monstrated that it predicted recurrence with the PSA doubling time, metastasis, and cancer-specific mortality (22, 23). Its su- periority over other nomograms has been demonstrated (17, 24). The pathology results after radical prostatectomy facilitate prediction of biochemical recurrence and disease progression, so the CAPRA-S score should be better than the CAPRA score for deciding which additional treatments might benefit selected patients (13, 25-27).
The c-index for the CAPRA-S score in a European multi-insti- tutional study was 0.73 and was higher than for the Stephenson Table 4. Comparison of the c-index for progression-free probabilities using logistic
regression between the CAPRA-S and CAPRA scores
PGPs Variables C-index (95% CI) P value
3-yr CAPRA-S score CAPRA score CAPRA-S risk group CAPRA risk group
0.76 (0.64-0.89) 0.74 (0.62-0.86) 0.74 (0.61-0.86) 0.70 (0.56-0.83)
0.414
< 0.001 5-yr CAPRA-S score
CAPRA score CAPRA-S risk group CAPRA risk group
0.80 (0.70-0.91) 0.77 (0.66-0.87) 0.77 (0.67-0.88) 0.71 (0.59-0.83)
0.040
< 0.001
HR, hazrard ratio; CI, confidence interval; CAPRA, cancer of the prostate risk assessment.
Fig. 1. The 5-yr biochemical-progression-free probabilities stratified by CAPRA-S score group (A) and the three-risk-group model (B) using Kaplan-Meier curves.
Survival probability
Survival period
0 10 20 30 40 50 60 1.0
0.8
0.6
0.4
0.2
0.0
Product-limit survival estimates
Survival probability
Survival period
0 10 20 30 40 50 60 1.0
0.8 0.6
0.4
0.2 0.0
Product-limit survival estimates
Censored
0 3 4 5 6 7 8 9
Censored
A B
HighIntermediate Low Group
Fig. 2. Decision curve analysis comparing the CAPRA-S and CAPRA scores. The y axis shows the net increase in the proportion of patients appropriately identified for adjuvant treatment. The solid black line represents the strategy involving treating all patients with adjuvant therapy (assuming all will experience recurrence) and the solid gray line represents the strategy involving treating no patients (assuming none will experience recurrence).
Net benefit
Threshold probability (%)
0 10 20 30 40 50 0.15
0.10
0.05
0.00
-0.05
None All CAPRA score CAPRA S score
nomogram (20). In our study, the c-index of the CAPRA-S score for the 3- and 5-yr progression-free probabilities was 0.76 and 0.80, respectively. The c-index of the CAPRA-S three risk groups was 0.74 and 0.77, respectively. The progression-free probabili- ties for each CAPRA-S score was relatively higher in this study compared with the SEARCH and Cancer of the Prostate Strate- gic Urologic Research Endeavor (CaPSURE) data. We postulat- ed that this result was influenced by the low rate of biochemical recurrences in our patients (13.8%) compared with the SEARCH (33%) and CaPSURE (16%) data. In addition, the small number of patients in our study and the unevenly distributed character- istics might have influenced the results. Also the present study was not a prospective study. Therefore, our study was not rep- resentative and had several limitations. Nevertheless, the valid- ity of the CAPRA-S score in our study was clear and its useful- ness convincing.
Comparing with preoperative nomograms, the CAPRA score was superior (17, 24). We also compared the CAPRA and CAP- RA-S scores, which were constructed from similar items and patients, and examined whether the performance of CAPRA-S score was more accurate. For the three risk groups, the CAPRA- S score had significantly (P < 0.001) greater predictive ability for the 3- and 5-yr progression-free probabilities (0.74 and 0.77, re- spectively) than did the CAPRA score (0.70 and 0.71, respective- ly). In the decision curve analysis, both the CAPRA and CAPRA- S scores had a better net benefit of appropriately identifying pa- tients for adjuvant therapy. The CAPRA-S score traced a more ideal curve than the CAPRA score, as no point below the refer- ence lines was seen. However, neither was clearly superior.
Despite the high accuracy of the CAPRA-S score for predict- ing the progression of prostate cancer after prostatectomy, Ko- rean results, including our study, gave different survival curves and progression-free probabilities compared to results using SEARCH and CaPSURE data. The first Korean study of the CAP- RA-S score found that the survival curves for the progression- free probabilities were inconsistent (28). We also obtained simi- lar results for inconsistence about survival curve of progression- free probabilities using CAPRA-S score. We must consider the baseline characteristics of the patients. In the two Korean stud- ies including present study, high-risk prostate patients comprised 35.8% and 25.4% of the total, compared 17% for the SEARCH data and for 6.5% CaPSURE (13, 20, 28). Although the Korean studies enrolled fewer patients, the race- and nation-specific characteristics of prostate cancer should be considered to de- velop a more accurate prediction model. Koreans with prostate cancer in whom a radical prostatectomy is indicated had poor- er characteristics than Americans (29). It is important that a more specific prediction model in terms of race and nation be devel- oped. Just as no nomograms have shown absolute prediction ability, the CAPRA-S score might also need continuous correction.
Although biochemical recurrence or disease progression does
not correlate with the mortality of prostate cancer directly, ad- juvant therapy might be required given poor pathology results.
As the decision curve analysis showed, the CAPRA-S score should be able to stratify the patients who need adjuvant therapy after radical prostatectomy with good predictability more easily than CAPRA score. A large-scale study should examine the perfor- mance of the CAPRA-S score in stratifying patients who need adjuvant therapy.
Conclusively, the CAPRA-S score, which includes pathology results, is a useful predictor of prostate cancer progression after radical prostatectomy compared with the CAPRA score. It may help clinicians and patients to decide on adjuvant therapy after surgery. After further revision according to race or national char- acteristics, the CAPRA-S score might also be useful in other coun- tries with an increasing incidence of prostate cancer, as in Korea.
DISCLOSURE
The authors have no conflicts of interest or financial disclosures.
ORCID
Won Ik Seo http://orcid.org/0000-0002-3004-101X Jae Il Chung http://orcid.org/0000-0002-8114-1125
REFERENCES
1. Meltzer D, Egleston B, Abdalla I. Patterns of prostate cancer treatment by clinical stage and age. Am J Public Health 2001; 91: 126-8.
2. National Institutes of Health Consensus Development Panel. Consen- sus statement: the management of clinically localized prostate cancer.
NCI Monogr 1988; (7): 3-6.
3. Pound CR, Partin AW, Epstein JI, Walsh PC. Prostate-specific antigen after anatomic radical retropubic prostatectomy: patterns of recurrence and cancer control. Urol Clin North Am 1997; 24: 395-406.
4. Roehl KA, Han M, Ramos CG, Antenor JA, Catalona WJ. Cancer progres- sion and survival rates following anatomical radical retropubic prosta- tectomy in 3,478 consecutive patients: long-term results. J Urol 2004; 172:
910-4.
5. Zincke H, Oesterling JE, Blute ML, Bergstralh EJ, Myers RP, Barrett DM.
Long-term (15 years) results after radical prostatectomy for clinically lo- calized (stage T2c or lower) prostate cancer. J Urol 1994; 152: 1850-7.
6. Catalona WJ, Smith DS. 5-year tumor recurrence rates after anatomical radical retropubic prostatectomy for prostate cancer. J Urol 1994; 152:
1837-42.
7. Ward JF, Zincke H, Bergstralh EJ, Slezak JM, Myers RP, Blute ML. The impact of surgical approach (nerve bundle preservation versus wide lo- cal excision) on surgical margins and biochemical recurrence following radical prostatectomy. J Urol 2004; 172: 1328-32.
8. Bott SR, Freeman AA, Stenning S, Cohen J, Parkinson MC. Radical pros- tatectomy: pathology findings in 1001 cases compared with other major series and over time. BJU Int 2005; 95: 34-9.
9. Antonarakis ES, Feng Z, Trock BJ, Humphreys EB, Carducci MA, Partin AW, Walsh PC, Eisenberger MA. The natural history of metastatic pro- gression in men with prostate-specific antigen recurrence after radical prostatectomy: long-term follow-up. BJU Int 2012; 109: 32-9.
10. Bottke D, Golz R, Störkel S, Hinke A, Siegmann A, Hertle L, Miller K, Hinkelbein W, Wiegel T. Phase 3 study of adjuvant radiotherapy versus wait and see in pT3 prostate cancer: impact of pathology review on anal- ysis. Eur Urol 2013; 64: 193-8.
11. Budäus L, Isbarn H, Tennstedt P, Salomon G, Schlomm T, Steuber T, Haese A, Chun F, Fisch M, Michl U, et al. Risk assessment of metastatic recurrence in patients with prostate cancer by using the Cancer of the Pros- tate Risk Assessment score: results from 2937 European patients. BJU Int 2012; 110: 1714-20.
12. Cooperberg MR, Freedland SJ, Pasta DJ, Elkin EP, Presti JC Jr, Amling CL, Terris MK, Aronson WJ, Kane CJ, Carroll PR. Multiinstitutional vali- dation of the UCSF cancer of the prostate risk assessment for prediction of recurrence after radical prostatectomy. Cancer 2006; 107: 2384-91.
13. Cooperberg MR, Hilton JF, Carroll PR. The CAPRA-S score: a straightfor- ward tool for improved prediction of outcomes after radical prostatecto- my. Cancer 2011; 117: 5039-46.
14. Ishizaki F, Hoque MA, Nishiyama T, Kawasaki T, Kasahara T, Hara N, Takizawa I, Saito T, Kitamura Y, Akazawa K, et al. External validation of the UCSF-CAPRA (University of California, San Francisco, Cancer of the Prostate Risk Assessment) in Japanese patients receiving radical prosta- tectomy. Jpn J Clin Oncol 2011; 41: 1259-64.
15. Loeb S, Carvalhal GF, Kan D, Desai A, Catalona WJ. External validation of the cancer of the prostate risk assessment (CAPRA) score in a single- surgeon radical prostatectomy series. Urol Oncol 2012; 30: 584-9.
16. Seo WI, Kang PM, Chung JI. Predictive value of the cancer of the prostate risk assessment score for recurrence-free survival after radical prostatec- tomy in Korea: a single-surgeon series. Korean J Urol 2014; 55: 321-6.
17. Lughezzani G, Budäus L, Isbarn H, Sun M, Perrotte P, Haese A, Chun FK, Schlomm T, Steuber T, Heinzer H, et al. Head-to-head comparison of the three most commonly used preoperative models for prediction of biochemical recurrence after radical prostatectomy. Eur Urol 2010; 57:
562-8.
18. May M, Knoll N, Siegsmund M, Fahlenkamp D, Vogler H, Hoschke B, Gralla O. Validity of the CAPRA score to predict biochemical recurrence- free survival after radical prostatectomy: results from a european multi- center survey of 1,296 patients. J Urol 2007; 178: 1957-62.
19. Zhao KH, Hernandez DJ, Han M, Humphreys EB, Mangold LA, Partin
AW. External validation of University of California, San Francisco, Can- cer of the Prostate Risk Assessment score. Urology 2008; 72: 396-400.
20. Punnen S, Freedland SJ, Presti JC Jr, Aronson WJ, Terris MK, Kane CJ, Amling CL, Carroll PR, Cooperberg MR. Multi-institutional validation of the CAPRA-S score to predict disease recurrence and mortality after radical prostatectomy. Eur Urol 2014; 65: 1171-7.
21. Cooperberg MR, Pasta DJ, Elkin EP, Litwin MS, Latini DM, Du Chane J, Carroll PR. The University of California, San Francisco Cancer of the Pros- tate Risk Assessment score: a straightforward and reliable preoperative predictor of disease recurrence after radical prostatectomy. J Urol 2005;
173: 1938-42.
22. Schroeck FR, Aronson WJ, Presti JC Jr, Terris MK, Kane CJ, Amling CL, Freedland SJ. Do nomograms predict aggressive recurrence after radical prostatectomy more accurately than biochemical recurrence alone? BJU Int 2009; 103: 603-8.
23. Cooperberg MR, Broering JM, Carroll PR. Risk assessment for prostate cancer metastasis and mortality at the time of diagnosis. J Natl Cancer Inst 2009; 101: 878-87.
24. Vickers A. Prediction models in urology: are they any good, and how would we know anyway? Eur Urol 2010; 57: 571-3.
25. Messing EM, Manola J, Yao J, Kiernan M, Crawford D, Wilding G, di’Sant- Agnese PA, Trump D; Eastern Cooperative Oncology Group study EST 3886. Immediate versus deferred androgen deprivation treatment in pa- tients with node-positive prostate cancer after radical prostatectomy and pelvic lymphadenectomy. Lancet Oncol 2006; 7: 472-9.
26. Thompson IM, Tangen CM, Paradelo J, Lucia MS, Miller G, Troyer D, Messing E, Forman J, Chin J, Swanson G, et al. Adjuvant radiotherapy for pathological T3N0M0 prostate cancer significantly reduces risk of metastases and improves survival: long-term followup of a randomized clinical trial. J Urol 2009; 181: 956-62.
27. Stephenson AJ, Scardino PT, Kattan MW, Pisansky TM, Slawin KM, Klein EA, Anscher MS, Michalski JM, Sandler HM, Lin DW, et al. Predicting the outcome of salvage radiation therapy for recurrent prostate cancer after radical prostatectomy. J Clin Oncol 2007; 25: 2035-41.
28. Seong KT, Lim JH, Park CM, Kim HK, Park JY. External validation of the cancer of the prostate risk assessment-S score in Koreans undergoing rad- ical prostatectomy. Korean J Urol 2013; 54: 433-6.
29. Kang DI, Chung JI, Ha HK, Min K, Yoon J, Kim W, Seo WI, Kang PM, Jung SJ, Kim IY. Korean prostate cancer patients have worse disease charac- teristics than their American counterparts. Asian Pac J Cancer Prev 2013;
14: 6913-7.