ABSTRACT
Purpose: Breast cancer treatments, including chemotherapy, administered in combination with glucocorticoids can induce hyperglycemia. This study aimed to investigate the effect of hyperglycemia during adjuvant chemotherapy on the prognosis of breast cancer patients without a known history of diabetes.
Methods: In this study, 936 patients who underwent breast cancer surgery from 2010 to 2015 were initially selected as participants. Chemotherapy-related hyperglycemia was defined as fasting plasma glucose levels ≥ 100 mg/dL or random blood glucose levels ≥ 140 mg/dL during 2 or more cycles of adjuvant chemotherapy. After dividing the patients into the euglycemia and hyperglycemia groups, univariate and multivariate analyses were performed, and survival outcomes were analyzed by propensity score matching.
Results: The mean age of the patients was 47.4 ± 7.7 years, and the median follow-up period was 70.1 months. Eighty-two patients (19.4%) were diagnosed as having hyperglycemia.
There were significant differences between the euglycemia and hyperglycemia groups with respect to age, hypertension, body mass index, axillary surgery extents, nodal stage, and total steroid dosage. T stage, vascular invasion, and hyperglycemia were identified as prognostic factors of relapse-free survival (RFS). The 5-year RFS rates were 92.0% and 82.3% in the euglycemia and hyperglycemia groups, respectively, and there was a statistically significant difference between the 2 groups (p = 0.011). The 5-year overall survival rates were 94.6% and 92.0% in the euglycemia and hyperglycemia groups, respectively, showing no statistically significant difference between the 2 groups (p = 0.113).
Conclusion: These data suggest that hyperglycemia during adjuvant chemotherapy is a prognostic factor for RFS in breast cancer patients without diabetes.
Keywords: Breast neoplasms; Chemotherapy, adjuvant; Hyperglycemia; Prognosis; Survival
INTRODUCTION
Various factors, such as nutritional imbalances, decreased physical activity, old age, obesity, stress, and infection, contribute to the development of hyperglycemia in cancer patients [1,2]. In addition, chemotherapeutic agents themselves and glucocorticoids used to prevent side effects of chemotherapy can cause treatment-induced hyperglycemia [3].
Original Article
Received: Apr 24, 2020 Accepted: Jun 26, 2020 Correspondence to Hyun Jo Youn
Department of Surgery, Research Institute of Clinical Medicine, Jeonbuk National University Hospital, Jeonbuk National University and Biomedical Research Institute, 20 Gunji-ro, Deokjin-gu, Jeonju 54907, Korea.
E-mail: [email protected]
© 2020 Korean Breast Cancer Society This is an Open Access article distributed under the terms of the Creative Commons Attribution Non-Commercial License (https://
creativecommons.org/licenses/by-nc/4.0/) which permits unrestricted non-commercial use, distribution, and reproduction in any medium, provided the original work is properly cited.
ORCID iDs Ha Rim Ahn
https://orcid.org/0000-0002-8942-7988 Sang Yull Kang
https://orcid.org/0000-0002-3970-174X Hyun Jo Youn
https://orcid.org/0000-0002-2407-8537 Sung Hoo Jung
https://orcid.org/0000-0001-7058-0870 Conflict of Interest
The authors declare that they have no competing interests.
Author Contributions
Conceptualization: Youn HJ, Jung SH; Data curation: Ahn HR, Kang SY; Formal analysis:
Ahn HR, Kang SY; Investigation: Ahn HR;
Methodology: Ahn HR, Kang SY, Jung SH;
Ha Rim Ahn , Sang Yull Kang , Hyun Jo Youn , Sung Hoo Jung
Department of Surgery, Research Institute of Clinical Medicine, Jeonbuk National University Hospital, Jeonbuk National University and Biomedical Research Institute, Jeonju, Korea
Hyperglycemia during Adjuvant
Chemotherapy as a Prognostic Factor in Breast Cancer Patients without
Diabetes
Project administration: Youn HJ; Supervision:
Jung SH; Writing - original draft: Ahn HR;
Writing - review & editing: Kang SY, Youn HJ, Jung SH.
Recent studies have indicated that hyperglycemia affects poor outcomes in cancer patients [1]. In particular, in patients with pancreatic, colorectal, and bladder cancer, hyperglycemia has been reported to increase short and long-term mortality and prevalence [4,5].
Hyperglycemic events during chemotherapy occur in 4%–18% of cancer patients with diabetes [4]. In cancer patients with diabetes, chemotherapy-related hyperglycemia reduces the efficacy of chemotherapeutic agents and increases the risk of chemotherapy-induced toxicities such as neutropenia and neuropathy [5,6]. The incidence of chemotherapy-related hyperglycemia in early breast cancer patients without diabetes has been reported to be 9.8%
[7]; however, no study has investigated the effect of chemotherapy-related hyperglycemia on survival in breast cancer patients without diabetes. Therefore, this study aimed to investigate the effect of hyperglycemia during chemotherapy on survival in breast cancer patients without diabetes.
METHODS
Patient selection
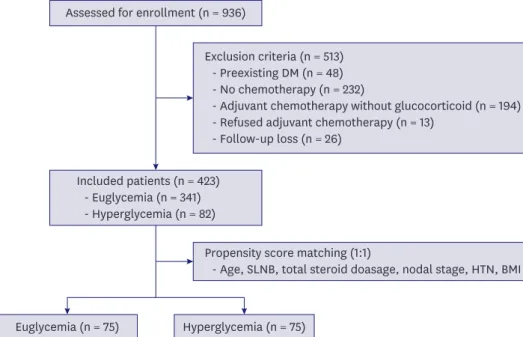
We retrospectively analyzed 936 patients who underwent breast cancer surgery from January 1, 2010 to December 31, 2015. Of 936 patients, 423 were finally included in the analysis by excluding patients diagnosed with diabetes before surgery, those who did not undergo adjuvant chemotherapy, or those who received adjuvant chemotherapy that did not include glucocorticoids (Figure 1). Except for patients who died during follow-up, all patients were followed up for at least 1 year after surgery, and the median follow-up time was 70.1 months (range, 11.4–115.2 months).
Data collection
Patients' medical records were retrospectively reviewed to investigate clinicopathological data, such as gender, age at diagnosis, tumor location, operation methods, pathologic
Euglycemia (n = 75) Hyperglycemia (n = 75) Assessed for enrollment (n = 936)
Included patients (n = 423) - Euglycemia (n = 341) - Hyperglycemia (n = 82)
Exclusion criteria (n = 513) - Preexisting DM (n = 48) - No chemotherapy (n = 232)
- Adjuvant chemotherapy without glucocorticoid (n = 194) - Refused adjuvant chemotherapy (n = 13)
- Follow-up loss (n = 26)
Propensity score matching (1:1)
- Age, SLNB, total steroid doasage, nodal stage, HTN, BMI
Figure 1. Flow chart of patients who met the inclusion/exclusion criteria for the study.
DM = diabetes mellitus; SLNB = sentinel lymph node biopsy; HTN = hypertension; BMI = body mass index.
subtype, T stage, N stage, estrogen receptor (ER), progesterone receptor (PR), human epidermal growth factor receptor-2 (HER-2) status, p53, Ki-67, radiotherapy, hormone therapy, target therapy, recurrence, and death. In addition, the total amount of glucocorticoids used for each chemotherapy regimen was examined. Moreover,
hyperlipidemia, hypertension (HTN), and body mass index (BMI), which are among the signs of metabolic syndrome (MS), were investigated. ER, PR, and HER-2 levels were evaluated using standard avidin-biotin complex immunohistochemical staining methods. The ER and PR statuses were assessed based on the Allred score, which was expressed as the sum of the proportion score and the intensity score of positively stained tumor cells. Tumors with an Allred score of at least 3 were regarded as positive. The intensity of HER-2 staining was scored as 0, 1+, 2+, or 3+. Tumors with a 3+ score were classified as HER-2 positive, and tumors with a 0 or 1+ score were classified as HER-2-negative. For tumors with a 2+ score, gene amplification using silver in situ hybridization was performed to identify HER-2 status.
Adjuvant treatment methods
Adjuvant chemotherapy administered to patients enrolled in this study included anthracycline, cyclophosphamide, and taxane. In the anthracycline + cyclophosphamide regimen, 12 mg of IV dexamethasone was administered for each cycle. In the paclitaxel regimen, 20 mg of IV dexamethasone was administered for each cycle. In docetaxel- containing regimens, 48 mg of oral dexamethasone was administered for each cycle. Four or eight cycles of adjuvant chemotherapy were performed at 3-week intervals considering the patients' general condition and pathological stage. Intravenous glucocorticoids were administered as the pre-chemotherapy medication. Oral antiestrogen hormone medications were administered to patients with hormone receptor-positive breast cancer. For patients with HER-2-positive breast cancer, trastuzumab was intravenously administered for 1 year.
In addition, among patients who underwent breast-conserving surgery or a modified radical mastectomy, radiotherapy was administered to those at a high risk for local relapse.
Definition of chemotherapy-related hyperglycemia
In all patients receiving 4 or 8 cycles of adjuvant chemotherapy, including glucocorticoids, the fasting plasma glucose level or random glucose level was measured before each cycle of chemotherapy was initiated. In this study, chemotherapy-related hyperglycemia was defined as fasting plasma glucose levels ≥ 100 mg/dL or random blood glucose levels ≥ 140 mg/dL during 2 or more cycles of adjuvant chemotherapy with reference to the criteria of impaired glucose tolerance (prediabetes) defined according to the criteria of the American Diabetes Association [8]. The patients were divided into the euglycemia and hyperglycemia groups according to blood glucose values.
Outcomes
Relapse-free survival (RFS) was defined as the duration from the date of breast cancer surgery to the recurrence at a local or regional site, occurrence of metastasis at a distant site, or a recently developed cancer at the contralateral breast. Overall survival (OS) was defined as the duration from the date of breast cancer surgery to death irrespective of the cause of death.
Statistical analysis
The χ
2test or Fisher's exact test was conducted for categorical variables and the independent
t-test for continuous variables. The Kaplan-Meier method and log-rank test were used for
univariate survival analysis. The Cox proportional hazards model was used in univariate and
multivariate analyses. Propensity score matching (PSM) of the euglycemia and hyperglycemia
groups was performed according to age, sentinel lymph node biopsy (SLNB), total steroid dosage, N stage, HTN, and BMI. The euglycemia and hyperglycemia groups were matched at a 1:1 ratio using the nearest-neighbor method. Multivariate analysis was conducted if the p-value was < 0.200 in the univariate analysis. A p-value < 0.05 was considered statistically significant. All statistical analyses were conducted using R version 3.2.5 (Vienna, Austria;
http://www.R-project.org).
Ethical approval
This study was conducted after obtaining the approval of the Institutional Review Board of Jeonbuk National University Hospital (No. 2020-02-010). The requirement for obtaining patient’s informed consent was waived because this was a retrospective analysis related to the follow-up of patients with breast cancer.
RESULTS
Patient characteristics
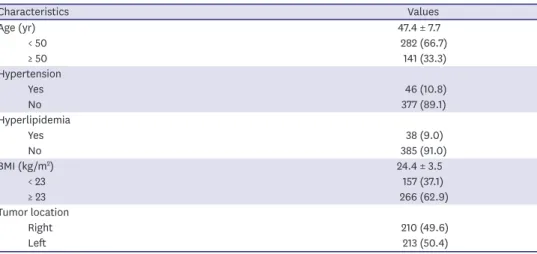
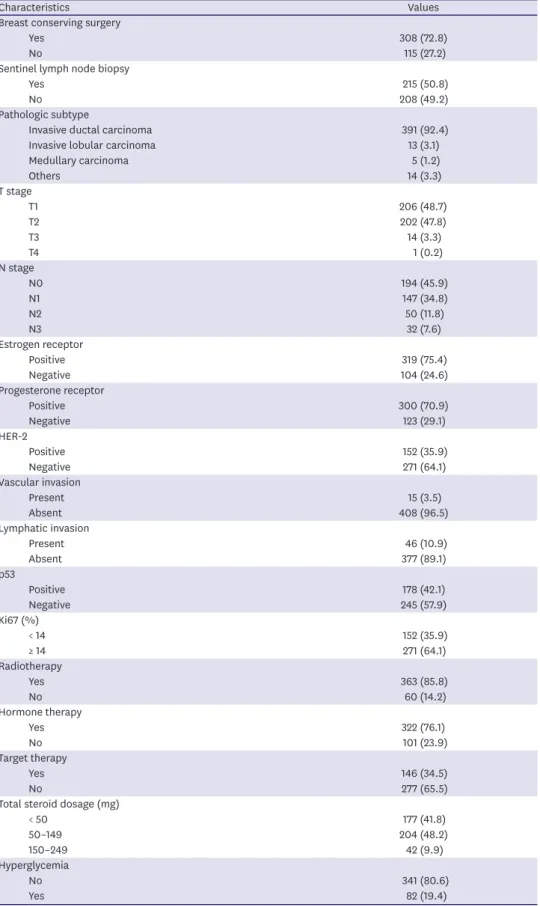
All 423 enrolled patients were female. A summary of the clinicopathological characteristics of the patients is presented in Table 1. The mean age of the patients was 47.4 ± 7.7 years. Of 423 patients, 46 (10.8%) had HTN and 38 (9.0%) had hyperlipidemia. There were 266 patients (62.9%) with a BMI of 23 or higher. There were 391 patients (92.4%) diagnosed with invasive ductal carcinoma. In terms of the pathological stage, 206 patients (48.7%) were T1 cases and 194 patients (45.9%) were N0 cases. In total, 319 patients (75.4%) were ER positive and 300 (70.9%) were PR positive. Moreover, 152 patients (35.9%) were diagnosed with HER- 2-positive breast cancer. Radiotherapy was administered to 363 patients (85.8%), hormone therapy to 322 patients (76.1%), and target therapy to 146 patients (34.5%). The mean amount of corticosteroids administered during chemotherapy was 12 mg in 177 patients who received 4 cycles of anthracycline + cyclophosphamide, 16 mg in 204 patients treated with 4 cycles of anthracycline + cyclophosphamide followed by 4 cycles of paclitaxel, 48 mg in 23 patients treated with 4 cycles of docetaxel + cyclophosphamide, and 30 mg in 19 patients treated with 4 cycles of anthracycline + cyclophosphamide followed by 4 cycles of docetaxel.
In short, a total of 50–149 mg of glucocorticoids was administered during chemotherapy to 204 patients (48.2%).
Table 1. Patient characteristics
Characteristics Values
Age (yr) 47.4 ± 7.7
< 50 282 (66.7)
≥ 50 141 (33.3)
Hypertension
Yes 46 (10.8)
No 377 (89.1)
Hyperlipidemia
Yes 38 (9.0)
No 385 (91.0)
BMI (kg/m
2) 24.4 ± 3.5
< 23 157 (37.1)
≥ 23 266 (62.9)
Tumor location
Right 210 (49.6)
Left 213 (50.4)
(continued to the next page)
Characteristics Values Breast conserving surgery
Yes 308 (72.8)
No 115 (27.2)
Sentinel lymph node biopsy
Yes 215 (50.8)
No 208 (49.2)
Pathologic subtype
Invasive ductal carcinoma 391 (92.4)
Invasive lobular carcinoma 13 (3.1)
Medullary carcinoma 5 (1.2)
Others 14 (3.3)
T stage
T1 206 (48.7)
T2 202 (47.8)
T3 14 (3.3)
T4 1 (0.2)
N stage
N0 194 (45.9)
N1 147 (34.8)
N2 50 (11.8)
N3 32 (7.6)
Estrogen receptor
Positive 319 (75.4)
Negative 104 (24.6)
Progesterone receptor
Positive 300 (70.9)
Negative 123 (29.1)
HER-2
Positive 152 (35.9)
Negative 271 (64.1)
Vascular invasion
Present 15 (3.5)
Absent 408 (96.5)
Lymphatic invasion
Present 46 (10.9)
Absent 377 (89.1)
p53
Positive 178 (42.1)
Negative 245 (57.9)
Ki67 (%)
< 14 152 (35.9)
≥ 14 271 (64.1)
Radiotherapy
Yes 363 (85.8)
No 60 (14.2)
Hormone therapy
Yes 322 (76.1)
No 101 (23.9)
Target therapy
Yes 146 (34.5)
No 277 (65.5)
Total steroid dosage (mg)
< 50 177 (41.8)
50–149 204 (48.2)
150–249 42 (9.9)
Hyperglycemia
No 341 (80.6)
Yes 82 (19.4)
Values are presented as mean ± standard deviation or number (%).
BMI = body mass index; HER-2 = human epidermal growth factor receptor-2.
Table 1. (Continued) Patient characteristics
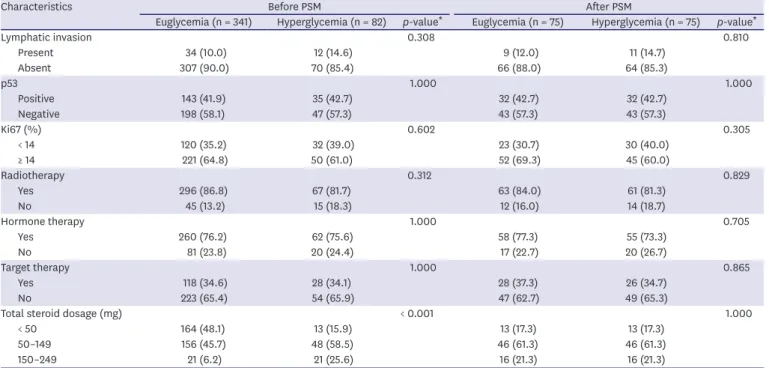
Differences in patient characteristics between the euglycemia and hyperglycemia groups
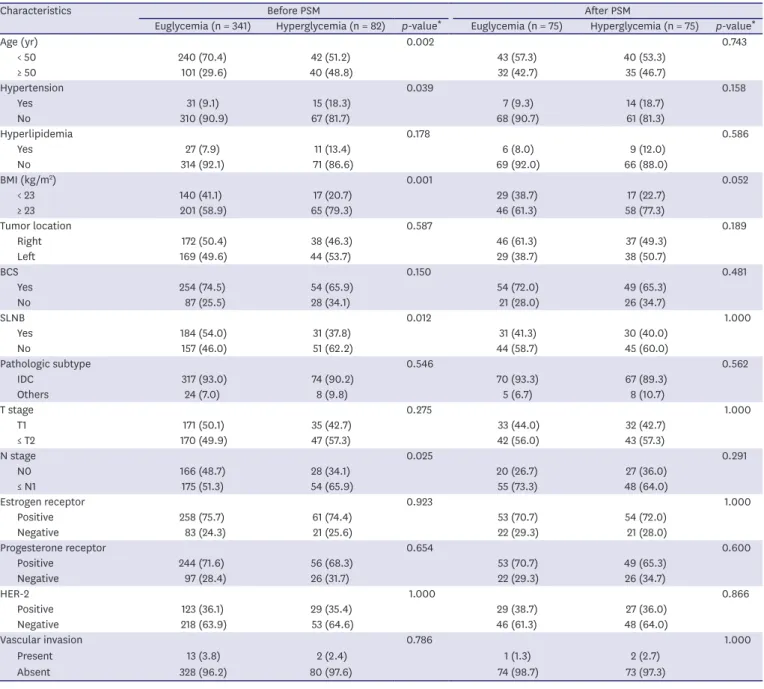
Hyperglycemia occurred in 82 (19.4%) out of 423 patients. There were more patients aged over 50 years (p = 0.002), without SLNB (p = 0.012), lymph node metastasis (p = 0.025), HTN (p = 0.039), and high BMI (p = 0.001) in the hyperglycemic group. Furthermore, there were more steroids used in the hyperglycemic group (p < 0.001) (Table 2). PSM was conducted for the euglycemia and hyperglycemia groups. After matching, the euglycemia and hyperglycemia groups had the same number of patients, with 75 patients in each group, and it was confirmed that there were no statistically significant differences in patient characteristics between the 2 groups (Table 2).
Table 2. The patients' characteristics before and after PSM
Characteristics Before PSM After PSM
Euglycemia (n = 341) Hyperglycemia (n = 82) p-value
*Euglycemia (n = 75) Hyperglycemia (n = 75) p-value
*Age (yr) 0.002 0.743
< 50 240 (70.4) 42 (51.2) 43 (57.3) 40 (53.3)
≥ 50 101 (29.6) 40 (48.8) 32 (42.7) 35 (46.7)
Hypertension 0.039 0.158
Yes 31 (9.1) 15 (18.3) 7 (9.3) 14 (18.7)
No 310 (90.9) 67 (81.7) 68 (90.7) 61 (81.3)
Hyperlipidemia 0.178 0.586
Yes 27 (7.9) 11 (13.4) 6 (8.0) 9 (12.0)
No 314 (92.1) 71 (86.6) 69 (92.0) 66 (88.0)
BMI (kg/m
2) 0.001 0.052
< 23 140 (41.1) 17 (20.7) 29 (38.7) 17 (22.7)
≥ 23 201 (58.9) 65 (79.3) 46 (61.3) 58 (77.3)
Tumor location 0.587 0.189
Right 172 (50.4) 38 (46.3) 46 (61.3) 37 (49.3)
Left 169 (49.6) 44 (53.7) 29 (38.7) 38 (50.7)
BCS 0.150 0.481
Yes 254 (74.5) 54 (65.9) 54 (72.0) 49 (65.3)
No 87 (25.5) 28 (34.1) 21 (28.0) 26 (34.7)
SLNB 0.012 1.000
Yes 184 (54.0) 31 (37.8) 31 (41.3) 30 (40.0)
No 157 (46.0) 51 (62.2) 44 (58.7) 45 (60.0)
Pathologic subtype 0.546 0.562
IDC 317 (93.0) 74 (90.2) 70 (93.3) 67 (89.3)
Others 24 (7.0) 8 (9.8) 5 (6.7) 8 (10.7)
T stage 0.275 1.000
T1 171 (50.1) 35 (42.7) 33 (44.0) 32 (42.7)
≤ T2 170 (49.9) 47 (57.3) 42 (56.0) 43 (57.3)
N stage 0.025 0.291
N0 166 (48.7) 28 (34.1) 20 (26.7) 27 (36.0)
≤ N1 175 (51.3) 54 (65.9) 55 (73.3) 48 (64.0)
Estrogen receptor 0.923 1.000
Positive 258 (75.7) 61 (74.4) 53 (70.7) 54 (72.0)
Negative 83 (24.3) 21 (25.6) 22 (29.3) 21 (28.0)
Progesterone receptor 0.654 0.600
Positive 244 (71.6) 56 (68.3) 53 (70.7) 49 (65.3)
Negative 97 (28.4) 26 (31.7) 22 (29.3) 26 (34.7)
HER-2 1.000 0.866
Positive 123 (36.1) 29 (35.4) 29 (38.7) 27 (36.0)
Negative 218 (63.9) 53 (64.6) 46 (61.3) 48 (64.0)
Vascular invasion 0.786 1.000
Present 13 (3.8) 2 (2.4) 1 (1.3) 2 (2.7)
Absent 328 (96.2) 80 (97.6) 74 (98.7) 73 (97.3)
(continued to the next page)
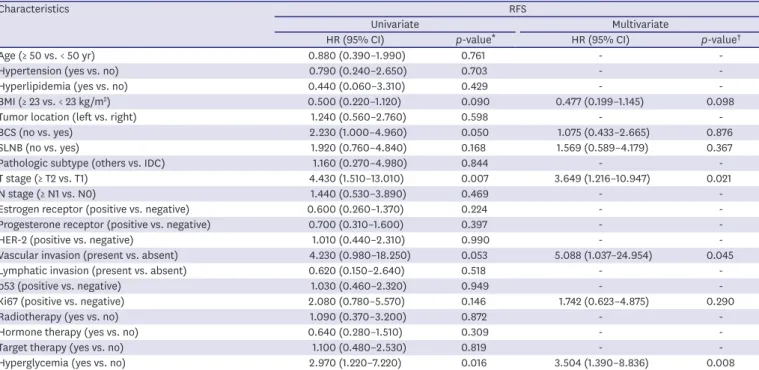
Univariate and multivariate analyses after PSM
A univariate analysis was conducted to identify prognostic factors for RFS, and it was found that there were statistically significant differences in T stage and hyperglycemia between the 2 groups. In multivariate analysis, hyperglycemia (hazard ratio [HR], 3.504; 95%
confidence interval [CI], 1.390–8.836; p = 0.008), T stage (HR, 3.649; 95% CI, 1.216–10.947;
p = 0.021), and presence of vascular invasion (HR, 5.088; 95% CI, 1.037–24.954; p = 0.045) were identified as independent prognostic factors (Table 3). The univariate analysis for OS revealed that there were statistically significant differences in BCS and T stage, but multivariate analysis did not show any significant factors (Table 4).
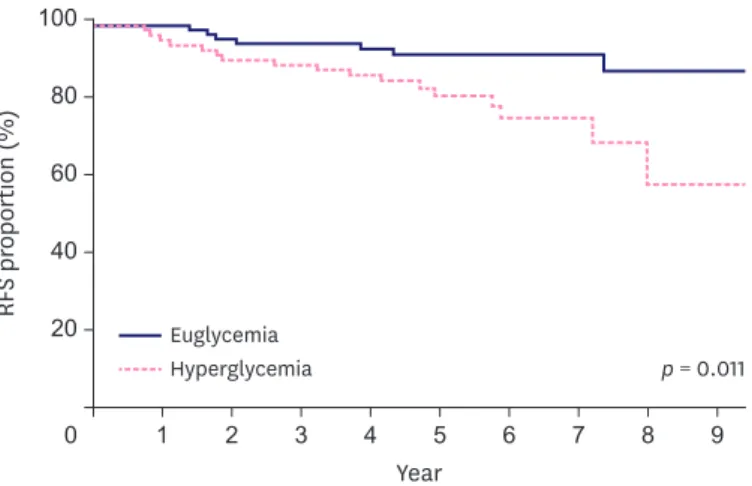
Survival analysis after PSM
Cancer recurrence occurred in 7 and 17 patients of the euglycemia and hyperglycemia groups, respectively, and the 5-year RFS rates in the euglycemia and hyperglycemia groups were 92.0% and 82.3%, respectively (p = 0.011, Figure 2). Four and 9 patients in the euglycemia and hyperglycemia groups, respectively, died, resulting in 5-year OS rates of 94.6% and 92.0%, respectively (p = 0.113, Figure 3).
DISCUSSION
Breast cancer is a very common cancer; it has the second highest incidence rate worldwide among all types of cancers and is ranked as the fifth leading cause of cancer-related mortality [9]. Among several treatment modalities for breast cancer, adjuvant chemotherapy is known to improve RFS and OS in breast cancer patients [10]. Several systemic reviews reported that preexisting diabetes increases all-cause mortality in breast cancer patients and is an independent factor of poor RFS and OS [11,12]. Hyperglycemia may develop because of chemotherapeutic agents or
Characteristics Before PSM After PSM
Euglycemia (n = 341) Hyperglycemia (n = 82) p-value
*Euglycemia (n = 75) Hyperglycemia (n = 75) p-value
*Lymphatic invasion 0.308 0.810
Present 34 (10.0) 12 (14.6) 9 (12.0) 11 (14.7)
Absent 307 (90.0) 70 (85.4) 66 (88.0) 64 (85.3)
p53 1.000 1.000
Positive 143 (41.9) 35 (42.7) 32 (42.7) 32 (42.7)
Negative 198 (58.1) 47 (57.3) 43 (57.3) 43 (57.3)
Ki67 (%) 0.602 0.305
< 14 120 (35.2) 32 (39.0) 23 (30.7) 30 (40.0)
≥ 14 221 (64.8) 50 (61.0) 52 (69.3) 45 (60.0)
Radiotherapy 0.312 0.829
Yes 296 (86.8) 67 (81.7) 63 (84.0) 61 (81.3)
No 45 (13.2) 15 (18.3) 12 (16.0) 14 (18.7)
Hormone therapy 1.000 0.705
Yes 260 (76.2) 62 (75.6) 58 (77.3) 55 (73.3)
No 81 (23.8) 20 (24.4) 17 (22.7) 20 (26.7)
Target therapy 1.000 0.865
Yes 118 (34.6) 28 (34.1) 28 (37.3) 26 (34.7)
No 223 (65.4) 54 (65.9) 47 (62.7) 49 (65.3)
Total steroid dosage (mg) < 0.001 1.000
< 50 164 (48.1) 13 (15.9) 13 (17.3) 13 (17.3)
50–149 156 (45.7) 48 (58.5) 46 (61.3) 46 (61.3)
150–249 21 (6.2) 21 (25.6) 16 (21.3) 16 (21.3)
PSM = propensity score matching; BMI = body mass index; BCS = breast conserving surgery; SLNB = sentinel lymph node biopsy; IDC = invasive ductal carcinoma;
HER-2 = human epidermal growth factor receptor 2.
*
Pearson's χ
2test.
Table 2. (Continued) The patients' characteristics before and after PSM
glucocorticoids used to prevent side effects. Fifteen percent of breast cancer patients treated with regimens including docetaxel experienced hyperglycemic events, and 9% of patients receiving chemotherapy with doxorubicin plus cyclophosphamide developed hyperglycemia [13].
Table 4. Univariate and multivariate analyses of the OS
Characteristics OS
Univariate Multivariate
HR (95% CI) p-value
*HR (95% CI) p-value
†Age (≥ 50 vs. < 50 yr) 0.580 (0.180–1.900) 0.372 - -
Hypertension (yes vs. no) 0.980 (0.750–2.130) 0.129 - -
Hyperlipidemia (yes vs. no) 0.920 (0.120–7.140) 0.936 - -
BMI (≥ 23 vs. < 23 kg/m
2) 0.710 (0.230–2.180) 0.553 - -
Tumor location (left vs. right) 1.080 (0.360–3.210) 0.893 - -
BCS (no vs. yes) 3.320 (1.080–10.180) 0.035 1.764 (0.544–5.715) 0.344
SLNB (no vs. yes) 2.020 (0.550–7.390) 0.286 - -
Pathologic subtype (others vs. IDC) 2.230 (0.490–2.510) 0.298 - -
T stage (≥ T2 vs. T1) 10.220 (1.330–78.770) 0.026 7.781 (0.998–60.690) 0.050
N stage (≥ N1 vs. N0) 4.530 (0.590–35.010) 0.148 4.363 (0.520–36.572) 0.175
Estrogen receptor (positive vs. negative) 0.460 (0.150–1.410) 0.128 - -
Progesterone receptor (positive vs. negative) 0.680 (0.220–2.070) 0.493 - -
HER-2 (positive vs. negative) 0.770 (0.240–2.510) 0.666 - -
Vascular invasion (present vs. absent) 3.400 (0.440–26.240) 0.241 - -
Lymphatic invasion (present vs. absent) 0.640 (0.080–4.900) 0.664 - -
p53 (positive vs. negative) 1.240 (0.420–3.700) 0.700 - -
Ki67 (positive vs. negative) 1.180 (0.360–3.830) 0.785 - -
Radiotherapy (yes vs. no) 0.730 (0.200–2.670) 0.638 - -
Hormone therapy (yes vs. no) 0.510 (0.170–1.560) 0.237 0.460 (0.150–1.407) 0.173
Target therapy (yes vs. no) 0.840 (0.260–2.730) 0.773 - -
Hyperglycemia (yes vs. no) 2.510 (0.770–8.160) 0.126 2.775 (0.828–9.308) 0.098
OS = overall survival; HR = hazard ratio; CI = confidence interval; BMI = body mass index; BCS = breast conserving surgery; SLNB = sentinel lymph node biopsy;
IDC = ninvasive ductal carcinoma; HER-2 = human epidermal growth factor receptor 2.
*
Kaplan-Meier survival estimates compared by log-rank test;
†Cox proportional hazards model.
Table 3. Univariate and multivariate analyses of the RFS
Characteristics RFS
Univariate Multivariate
HR (95% CI) p-value
*HR (95% CI) p-value
†Age (≥ 50 vs. < 50 yr) 0.880 (0.390–1.990) 0.761 - -
Hypertension (yes vs. no) 0.790 (0.240–2.650) 0.703 - -
Hyperlipidemia (yes vs. no) 0.440 (0.060–3.310) 0.429 - -
BMI (≥ 23 vs. < 23 kg/m
2) 0.500 (0.220–1.120) 0.090 0.477 (0.199–1.145) 0.098
Tumor location (left vs. right) 1.240 (0.560–2.760) 0.598 - -
BCS (no vs. yes) 2.230 (1.000–4.960) 0.050 1.075 (0.433–2.665) 0.876
SLNB (no vs. yes) 1.920 (0.760–4.840) 0.168 1.569 (0.589–4.179) 0.367
Pathologic subtype (others vs. IDC) 1.160 (0.270–4.980) 0.844 - -
T stage (≥ T2 vs. T1) 4.430 (1.510–13.010) 0.007 3.649 (1.216–10.947) 0.021
N stage (≥ N1 vs. N0) 1.440 (0.530–3.890) 0.469 - -
Estrogen receptor (positive vs. negative) 0.600 (0.260–1.370) 0.224 - -
Progesterone receptor (positive vs. negative) 0.700 (0.310–1.600) 0.397 - -
HER-2 (positive vs. negative) 1.010 (0.440–2.310) 0.990 - -
Vascular invasion (present vs. absent) 4.230 (0.980–18.250) 0.053 5.088 (1.037–24.954) 0.045
Lymphatic invasion (present vs. absent) 0.620 (0.150–2.640) 0.518 - -
p53 (positive vs. negative) 1.030 (0.460–2.320) 0.949 - -
Ki67 (positive vs. negative) 2.080 (0.780–5.570) 0.146 1.742 (0.623–4.875) 0.290
Radiotherapy (yes vs. no) 1.090 (0.370–3.200) 0.872 - -
Hormone therapy (yes vs. no) 0.640 (0.280–1.510) 0.309 - -
Target therapy (yes vs. no) 1.100 (0.480–2.530) 0.819 - -
Hyperglycemia (yes vs. no) 2.970 (1.220–7.220) 0.016 3.504 (1.390–8.836) 0.008
RFS = relapse-free survival; HR = hazard ratio; CI = confidence interval; BMI = body mass index; BCS = breast conserving surgery; SLNB = sentinel lymph node biopsy; IDC = invasive ductal carcinoma; HER-2 = human epidermal growth factor receptor 2.
*
Kaplan-Meier survival estimates compared by log-rank test;
†Cox proportional hazards model.
Chemotherapeutic agents cause direct toxic effects of reducing the production and release of insulin by pancreatic β-cells [1]. This functional decline in pancreatic β-cells persists even after chemotherapy is completed [14]. A previous study reported that of 24,976 postmenopausal breast cancer survivors, 9.7% were newly diagnosed with type 2 diabetes mellitus (T2DM). The study also found that patients were most often diagnosed with T2DM within 2 years of cancer treatment, and adjuvant chemotherapy was a risk factor for T2DM [15]. In this study, 10 patients (12.2%) in the hyperglycemic group had newly diagnosed T2DM after chemotherapy. Glucocorticoids used to reduce chemotherapy- induced toxicity also cause insulin resistance and hyperglycemia in the body. All patients enrolled in this study were treated with chemotherapy regimens including glucocorticoids, and the incidence of hyperglycemic events was 19.4% (82 patients). In previous studies, the incidence of hyperglycemic events in patients who received the docetaxel regimen including glucocorticoids was reported to be 13.7%–43% [13,16]. Glucocorticoid use leads to the decrease of glucose intake and increase of glucose production in muscle and adipose tissue. In addition, long-term glucocorticoid therapy has a proapoptotic effect on pancreatic β-cells, which leads to the reduction of insulin secretion. It has also been reported that when glucocorticoids are used in patients without diabetes, hyperglycemic events occur in more than 50% of patients, and after treatment using glucocorticoids, the odds ratio for diabetes is
RF S pr oportion (%)
Year 40
60 80 100
20
0 1 2 3 4 5 6 7 8 9
p = 0.011 Euglycemia
Hyperglycemia
Figure 2. RFS in the euglycemia and hyperglycemia groups.
RFS = relapse-free survival.
OS pr oportion (%)
Year 40
60 80 100
20
0 1 2 3 4 5 6 7 8 9
p = 0.113 Euglycemia
Hyperglycemia
Figure 3. OS in the euglycemia and hyperglycemia groups.
OS = overall survival.
increased to 1.36–2.31. The hyperglycemic effects of glucocorticoids have been reported to be the greatest within 6–8 hours after glucocorticoid injection [17].
This study analyzed the association between hyperglycemia and survival during adjuvant chemotherapy in breast cancer patients without diabetes. In this study, hyperglycemia occurred in 19.4% of enrolled patients, and there were significant differences in age, HTN, BMI, SLNB, N stage, and total steroid dosage between the euglycemia and hyperglycemia groups. The 5-year RFS rates were 92.0% and 82.3% in the euglycemia and hyperglycemia groups, respectively, with the hyperglycemia group showing a statistically significantly lower rate. The 5-year OS rates were 94.6% and 92.0% in the euglycemia and hyperglycemia groups, respectively, so the 5-year OS rate was lower in the hyperglycemia group than in the euglycemia group, although there was no statistically significant difference between the 2 groups. In this regard, a retrospective cohort study of cervical cancer patients without diabetes also reported that hyperglycemia during neoadjuvant chemotherapy acted as a negative prognostic factor that reduces recurrence-free survival and cancer-specific survival [18]. Hyperglycemia was also found to be a poor prognostic factor for 5-year OS and RFS in acute lymphocytic leukemia patients without diabetes [19].
With respect to biological mechanisms based on which hyperglycemia leads to poor cancer outcomes, the following mechanisms have been reported to be involved in the association between hyperglycemia and cancer outcomes. First, in the hyperglycemic condition, the production of pro-inflammatory factors, such as interleukin-6, tumor necrosis factor-α, and cyclooxygenase-2, is increased. These factors stimulate oncogene expression, cell cycle regulation, and breast tumor cell proliferation [20]. Second, hyperglycemia increases tumor cell invasion and metastasis. In human lung epithelial cells, the expression of heme oxigenase-1 (HO-1) in cells is increased by high glucose concentrations [21]. HO-1 increases the expression of cluster of differentiation 147 and matrix metalloproteinase-9 protein, which are involved in tumor cell invasion, thereby indicting tumor cell invasion [22]. Third, hyperglycemia increases hydrogen peroxide levels in vivo and in vitro, thereby promoting the migration of cancer cells [23]. Fourth, hyperglycemia inhibits p53 apoptotic activity, thus inducing cell apoptotic resistance [24].
MS is characterized by central adiposity, insulin resistance, low serum high-density lipoprotein cholesterol, high serum triglyceride and high blood pressure, and high blood glucose levels. Several studies have reported that MS is an independent risk factor for outcomes in postmenopausal female breast cancer patients [25,26]. In this study, the proportion of patients with HTN and high BMI was statistically significantly higher in the hyperglycemia group than in the euglycemia group. These results can be attributed to the fact that risk factors for hyperglycemia, such as nutritional imbalances, obesity, stress, and infection, overlap with the characteristics or causes of MS in cancer patients. In this study, univariate and multivariate analyses performed to identify prognostic factors for RFS revealed that hyperglycemia, high N stage, and presence of vascular invasion were statistically significant prognostic factors. Except for hyperglycemia, hyperlipidemia, HTN, and high BMI, which are among the signs of MS, were not identified as prognostic factors.
This study had several limitations. First, because this study is a single-institution retrospective
study, there are limitations in generalizing the results. Second, patients enrolled in this study
underwent a blood glucose test to measure the serum fasting glucose level or the random
glucose level once in the morning on the day when they were admitted to the hospital for
chemotherapy. Therefore, in the participants of this study, serial measurements of blood glucose levels were not performed as in normal patients with diabetes. Third, although intensive hyperglycemia control in patients with nondiabetic leukemia has been reported to improve survival outcomes of patients [27], we did not investigate whether appropriate interventions had been provided to patients with chemotherapy-related hyperglycemia included in this study. However, despite the aforementioned limitations, this study had the following major strengths. First, although many studies have been conducted on poor prognosis of hyperglycemia in breast cancer patients with diabetes, this study is the first research to investigate the prognostic role of hyperglycemia during chemotherapy in breast cancer patients without diabetes. Second, all patients enrolled in this study were treated with a uniform chemotherapy regimen. Third, the PSM method was applied to adjust for factors, such as age, N stage, and the total amount of steroids used during chemotherapy, which could affect the analysis. In the future, a well-designed multicenter prospective study should be conducted to investigate whether an active intervention in patients with chemotherapy-related hyperglycemia will contribute to the improvement of the survival rate of breast cancer patients.
In conclusion, hyperglycemia occurring during adjuvant chemotherapy in breast cancer patients without diabetes was found to be associated with poor RFS. Because hyperglycemia is a prognostic factor that can be controlled, a follow-up study should be conducted to explore methods for adequate glucose monitoring and control in patients with chemotherapy-related hyperglycemia.
REFERENCES
1. Hwangbo Y, Lee EK. Acute hyperglycemia associated with anti-cancer medication. Endocrinol Metab (Seoul) 2017;32:23-9.
PUBMED | CROSSREF
2. Martin-Salces M, de Paz R, Canales MA, Mesejo A, Hernandez-Navarro F. Nutritional recommendations in hematopoietic stem cell transplantation. Nutrition 2008;24:769-75.
PUBMED | CROSSREF
3. Psarakis HM. Clinical challenges in caring for patients with diabetes and cancer. Diabetes Spectr 2006;19:157-62.
CROSSREF
4. Barone BB, Yeh HC, Snyder CF, Peairs KS, Stein KB, Derr RL, et al. Long-term all-cause mortality in cancer patients with preexisting diabetes mellitus: a systematic review and meta-analysis. JAMA 2008;300:2754-64.
PUBMED | CROSSREF
5. Brunello A, Kapoor R, Extermann M. Hyperglycemia during chemotherapy for hematologic and solid tumors is correlated with increased toxicity. Am J Clin Oncol 2011;34:292-6.
PUBMED | CROSSREF
6. Zeng L, Biernacka KM, Holly JM, Jarrett C, Morrison AA, Morgan A, et al. Hyperglycaemia confers resistance to chemotherapy on breast cancer cells: the role of fatty acid synthase. Endocr Relat Cancer 2010;17:539-51.
PUBMED | CROSSREF
7. Accordino MK, Lin A, Wright JD, Trivedi MS, Kalinsky K, Crew KD, et al. Incidence of hyperglycemia in non-diabetic patients with early-stage breast cancer treated with chemotherapy. 2018 San Antonio Breast Cancer Symposium. 2019;79. Abstract P1-20-02.
8. American Diabetes Association. Diagnosis and classification of diabetes mellitus. Diabetes Care 2008;31 Suppl 1:S55-60.
PUBMED | CROSSREF
9. Bray F, Ferlay J, Soerjomataram I, Siegel RL, Torre LA, Jemal A. Global cancer statistics 2018: GLOBOCAN estimates of incidence and mortality worldwide for 36 cancers in 185 countries. CA Cancer J Clin 2018;68:394-424.
PUBMED | CROSSREF
10. Early Breast Cancer Trialists' Collaborative Group (EBCTCG). Effects of chemotherapy and hormonal therapy for early breast cancer on recurrence and 15-year survival: an overview of the randomised trials.
Lancet 2005;365:1687-717.
PUBMED | CROSSREF
11. Zhao XB, Ren GS. Diabetes mellitus and prognosis in women with breast cancer: a systematic review and meta-analysis. Medicine (Baltimore) 2016;95:e5602.
PUBMED | CROSSREF
12. Peairs KS, Barone BB, Snyder CF, Yeh HC, Stein KB, Derr RL, et al. Diabetes mellitus and breast cancer outcomes: a systematic review and meta-analysis. J Clin Oncol 2011;29:40-6.
PUBMED | CROSSREF
13. Lee YJ, Doliny P, Gomez-Fernandez C, Powell J, Reis I, Hurley J. Docetaxel and cisplatin as primary chemotherapy for treatment of locally advanced breast cancers. Clin Breast Cancer 2004;5:371-6.
PUBMED | CROSSREF
14. Mohn A, Di Marzio A, Capanna R, Fioritoni G, Chiarelli F. Persistence of impaired pancreatic β-cell function in children treated for acute lymphoblastic leukaemia. Lancet 2004;363:127-8.
PUBMED | CROSSREF
15. Lipscombe LL, Chan WW, Yun L, Austin PC, Anderson GM, Rochon PA. Incidence of diabetes among postmenopausal breast cancer survivors. Diabetologia 2013;56:476-83.
PUBMED | CROSSREF
16. Yoo KE, Kang RY, Lee JY, Lee YJ, Suh SY, Kim KS, et al. Awareness of the adverse effects associated with prophylactic corticosteroid use during docetaxel therapy. Support Care Cancer 2015;23:1969-77.
PUBMED | CROSSREF
17. Clore JN, Thurby-Hay L. Glucocorticoid-induced hyperglycemia. Endocr Pract 2009;15:469-74.
PUBMED | CROSSREF
18. Chen S, Tao M, Zhao L, Zhang X. The association between diabetes/hyperglycemia and the prognosis of cervical cancer patients: a systematic review and meta-analysis. Medicine (Baltimore) 2017;96:e7981.
PUBMED | CROSSREF
19. Sonabend RY, McKay SV, Okcu MF, Yan J, Haymond MW, Margolin JF. Hyperglycemia during induction therapy is associated with poorer survival in children with acute lymphocytic leukemia. J Pediatr 2009;155:73-8.
PUBMED | CROSSREF
20. Hou Y, Zhou M, Xie J, Chao P, Feng Q, Wu J. High glucose levels promote the proliferation of breast cancer cells through GTPases. Breast Cancer (Dove Med Press) 2017;9:429-36.
PUBMED | CROSSREF
21. Kang X, Kong F, Wu X, Ren Y, Wu S, Wu K, et al. High glucose promotes tumor invasion and increases metastasis-associated protein expression in human lung epithelial cells by upregulating heme oxygenase-1 via reactive oxygen species or the TGF-β1/PI3K/Akt signaling pathway. Cell Physiol Biochem 2015;35:1008-22.
PUBMED | CROSSREF
22. Tsai JR, Wang HM, Liu PL, Chen YH, Yang MC, Chou SH, et al. High expression of heme oxygenase-1 is associated with tumor invasiveness and poor clinical outcome in non-small cell lung cancer patients. Cell Oncol (Dordr) 2012;35:461-71.
PUBMED | CROSSREF
23. Li W, Ma Z, Ma J, Li X, Xu Q, Duan W, et al. Hydrogen peroxide mediates hyperglycemia-induced invasive activity via ERK and p38 MAPK in human pancreatic cancer. Oncotarget 2015;6:31119-33.
PUBMED | CROSSREF
24. Garufi A, D'Orazi G. High glucose dephosphorylates serine 46 and inhibits p53 apoptotic activity. J Exp Clin Cancer Res 2014;33:79.
PUBMED | CROSSREF
25. Capasso I, Esposito E, Pentimalli F, Crispo A, Montella M, Grimaldi M, et al. Metabolic syndrome affects breast cancer risk in postmenopausal women: National Cancer Institute of Naples experience. Cancer Biol Ther 2010;10:1240-3.
PUBMED | CROSSREF
26. Rosato V, Bosetti C, Talamini R, Levi F, Montella M, Giacosa A, et al. Metabolic syndrome and the risk of breast cancer in postmenopausal women. Ann Oncol 2011;22:2687-92.
PUBMED | CROSSREF
27. Ali NA, O'Brien JM Jr, Blum W, Byrd JC, Klisovic RB, Marcucci G, et al. Hyperglycemia in patients with acute myeloid leukemia is associated with increased hospital mortality. Cancer 2007;110:96-102.
PUBMED | CROSSREF