Endocrinol Metab 2020;35:290-297 https://doi.org/10.3803/EnM.2020.35.2.290 pISSN 2093-596X · eISSN 2093-5978
Original Article
Fasting and Postprandial Hyperglycemia: Their Predictors and Contributions to Overall Hyperglycemia in Korean Patients with Type 2 Diabetes
Jaecheol Moon1,*, Ji Young Kim1,*, Soyeon Yoo1,2, Gwanpyo Koh1,2
1Department of Internal Medicine, Jeju National University Hospital; 2Department of Internal Medicine, Jeju National University School of Medicine, Jeju, Korea
Background: This study aimed to identify factors that affect fasting hyperglycemia (FHG) and postprandial hyperglycemia (PPG) and their contributions to overall hyperglycemia in Korean patients with type 2 diabetes mellitus (T2DM).
Methods: This was a retrospective study conducted on 194 Korean T2DM patients with 7-point self-monitoring blood glucose (SMBG) profiles plotted in 4 days in 3 consecutive months. We calculated the areas corresponding to FHG and PPG (area under the curve [AUC]FHG and AUCPPG) and contributions (%) in the graph of the 7-point SMBG data. The levels of glycated hemoglobin (HbA1c) were categorized by tertiles, and the contributions of FHG and PPG were compared.
Results: The relative contribution of FHG increased (44.7%±5.6%, 58.0%±4.4%, 66.5%±2.8%; PANOVA=0.002, PTREND
<0.001), while that of PPG decreased (55.3%±5.5%, 42.0%±4.4%, 33.5%±2.8%; PANOVA=0.002, PTREND <0.001) with the elevated HbA1c. Multivariate analysis showed that HbA1c (β=0.615, P<0.001), waist circumference (β=0.216, P=0.042), and tri- glyceride (β=0.121, P=0.048) had a significant association with AUCFHG. Only HbA1c (β=0.231, P=0.002) and age (β=0.196, P=0.009) was significantly associated with AUCPPG.
Conclusion: The data suggested that in Korean T2DM patients, FHG predominantly contributed to overall hyperglycemia at higher HbA1c levels, whereas it contributed to PPG at lower HbA1c levels. It is recommended that certain factors, namely age, degree of glycemic control, obesity, or triglyceride levels, should be considered when prescribing medications for T2DM patients.
Keywords: Hyperglycemia; Fasting; Glycated hemoglobin A
INTRODUCTION
Various research and debates have been conducted about wheth- er glycated hemoglobin (HbA1c)—an index for the overall hy- perglycemia—is more related to fasting hyperglycemia (FHG) or postprandial hyperglycemia (PPG). In 1997, Avignon et al.
[1] first measured blood glucose at different times of the day to
study the relative effect of FHG and PPG on HbA1c. They found that PPG was a better predictor of overall hyperglycemia than FHG. Analyzing the diabetes control and complication trial (DCCT) data, Rohlfing et al. [2] also showed that PPG had a linear association with HbA1c and had a stronger association with overall hyperglycemia than FHG. In contrast, Bonora et al.
[3] reported that FHG had a stronger association with overall
Received: 1 January 2020, Revised: 15 February 2020, Accepted: 1 April 2020 Corresponding author: Gwanpyo Koh
Department of Internal Medicine, Jeju National University School of Medicine, 15 Aran 13-gil, Jeju 63241, Korea
Tel: +82-64-754-8163, Fax: +82-64-717-1131, E-mail: [email protected]
*These authors contributed equally to this work.
Copyright © 2020 Korean Endocrine Society
This is an Open Access article distributed under the terms of the Creative Com- mons Attribution Non-Commercial License (https://creativecommons.org/
licenses/by-nc/4.0/) which permits unrestricted non-commercial use, distribu- tion, and reproduction in any medium, provided the original work is properly cited.
hyperglycemia than PPG.
To re-examine these associations, Monnier et al. [4] had pa- tients with type 2 diabetes mellitus (T2DM) blood glucose mea- sured at four points of time and calculated the area under the blood glucose curve. In their study, the contribution of PPG to overall hyperglycemia was high in the group with relatively good blood glucose control, while that of FHG increased with poorer blood glucose control.
Following the study by Monnier et al. [4], several other inves- tigations were conducted using the same method. For example, the study by Riddle et al. [5] classified targets according to HbA1c in the same way as Monnier et al. [4] and recognized the contribution of FHG and PPG. The authors also categorized participants by HbA1c into the same groups as in the study by Monnier et al. [4] and examined the contributions of FHG and PPG. They pointed out that the contribution of FHG in all groups was 70% or greater. Furthermore, despite a slight rise in the contribution of FHG as HbA1c increased, no statistically significant difference was observed.
Previous studies have shown conflicting results despite using the same analysis methods, and only a few studies have been carried out on Asian populations. Therefore, we conducted this study aiming to do the following: (1) examine how the contribu- tion of FHG and PPG changes with HbA1c in Korean T2DM patients and (2) analyze the factors, other than HbA1c, associat- ed with FHG and PPG.
METHODS
Participants
In this study, we retrospectively collected and analyzed the data of patients visiting the outpatient clinic in the Division of Endo- crinology and Metabolism, Department of Internal Medicine, Jeju National University Hospital, from August 2009 to October 2011. The patients must meet the inclusion criteria as follows:
(1) they suffered from T2DM; (2) their age range must be be- tween 20 and 80 years old; and (3) they had performed 7-point self-monitoring blood glucose (SMBG), i.e., had recorded their own blood glucose levels seven times a day, for 4 days (sessions) as recommended by a medical professional. Days 1, 2, and 3 were in the beginning of the first, second, and third months, re- spectively, while day 4 was at the end of the third month (Fig. 1).
Patients were excluded from the study if (1) they had type 1 diabetes (serum C-peptide <0.6 ng/mL or increased anti-glu- tamic acid decarboxylase antibody titer, if they received multi- ple doses of insulin from the time of diagnosis, or if they had a
history of diabetic ketoacidosis); and (2) they were administered insulin or α-glucosidase inhibitors. They were excluded because the medications can have certain effects on PPG. After applying the inclusion and exclusion criteria, we had a final sample of 194 patients.
This study was approved by the Institutional Review Board of the Jeju National University Hospital (IRB File No. JE- JUNUH 2015-06-006) and was exempted from informed con- sent requirements because of its retrospective nature.
Study procedure
All participants performed 7-point SMBG immediately before each meal, 2 hours after each meal, and before sleeping. The re- cording of SMBG was conducted for 4 days (sessions) selected in the 3 consecutive months. In the last session, HbA1c was also measured (Fig. 1).
Using 7-point SMBG profiles, we calculated the area under the curve (AUC). The AUCtotal was defined as the area that cor- responds to 5.6 mmol/L (100 mg/dL) or greater. We used 100 mg/dL as the cut-off point because it is defined as the upper limit of normal fasting glucose by the American Diabetes Asso- ciation [6]. AUCFHG was calculated by AUCtotal-AUCPPG, and the contribution of FHG was AUCFHG/AUCtotal (%). AUCPPG refers to the area above the fasting glucose level in the graph, and the contribution of PPG on the overall hyperglycemia was calculat- ed by AUCPPG/AUCtotal (%) (Fig. 2). We used these calculations (i.e., the mean values of contribution) to identify the association between FHG and PPG with HbA1c. We divided the patients into three groups according to HbA1c tertiles: Group 1 (6.6% or below), Group 2 (6.7% to 7.1%), and Group 3 (7.2% or above).
The mean contributions of FHG and PPG were then compared among the three groups.
Demographic characteristics, medical history, and the history of hypoglycemic agent use were investigated through inter- views and electronic medical records, and physical examina- tions were performed by a physician. Some blood tests were
1st mo 2nd mo 3rd mo
7-point SMBG 7-point SMBG 7-point SMBG HbA1c 7-point SMBG
Fig. 1. Measurement of seven-point self-monitoring of blood glu- cose (SMBG) and glycated hemoglobin (HbA1c).
performed after 12 hours of fasting. They included HbA1c, C- peptide, high sensitivity C-reactive protein (hsCRP), total cho- lesterol, triglyceride (TG), high-density lipoprotein cholesterol, low-density lipoprotein cholesterol, creatinine, aspartate trans- aminase (AST), and alanine transaminase (ALT).
Statistical analysis
The results are presented as mean±standard deviation (SD) for continuous variables and as percentages for categorical vari- ables. Moreover, graphs were plotted with mean±SD. We used analysis of variance (ANOVA) with the linear trend test to ex- amine the difference between the contribution of FHG and that of PPG to overall hyperglycemia by HbA1c tertile, and the change in the contributions. Additionally, to identify the factors affecting the two types of hyperglycemia, we performed a mul- tivariate linear regression model in which AUCPPG and AUCFHG were treated as dependent variables, while independent vari- ables included those significantly associated with AUCPPG and AUCFHG in the simple correlation analysis and Student’s t test.
Non-normally distributed variables were logarithmically trans- formed and analyzed. In this study, we used SPSS version 18.0 (SPSS Inc., Chicago, IL, USA) to analyze data and set the level of significance at P<0.05.
RESULTS
Clinico-biochemical characteristics of patients
This study included 194 patients with the mean age of 57.6±9.0 years old. Male patients (n=137, 69%) outnumbered female ones (n=57, 31%). Their mean duration of having diabetes was 7.6±6.7 years, and the mean HbA1c as 7.0%±0.9%. Among
hypoglycemic agents, sulfonylurea was most commonly taken (81.5%) followed by metformin (57.4%), and dipeptidyl pepti- dase-4 inhibitor (DPP4i; 11.3%) (Table 1).
Changes in FHG and PPG, by HbA1c value
We divided patients into three groups according to HbA1c ter- tiles. Then, we examined whether the contributions of FHG and PPG changed significantly by HbA1c. The mean percentage of contribution of FHG was 44.7±5.6 in Group 1, compared to 58.0±4.4 in Group 2 and 66.5±2.8 in Group 3. Meanwhile, the Table 1. Baseline Clinical and Laboratory Characteristics of the Subjects
Characteristic Value
Number 194
Sex, male/female 137/57
Age, yr 57.6±9.0
Smoking 70 (35.9)
Height, cm 162.0±14.3
Body weight, kg 69.9±11.6
BMI, kg/m2 26.0±3.1
WC, cm 89.7±8.3
Systolic BP, mm Hg 138.3±17.0
Diastolic BP, mm Hg 82.2±10.0
Duration of DM, yr 7.6±6.7
C-peptide, ng/mL 2.2±0.9
HbA1c, % 7.0±0.9
Creatinine, mg/dL 1.0±0.2
hsCRP, mg/dL 0.17±0.4
ALT, IU/L 31.7±19.4
AST, IU/L 26.67 ±12.2
TC, mg/dL 169.5±34.1
TG, mg/dL 128.7±80.3
HDL-C, mg/dL 48.0±11.7
LDL-C, mg/dL 102.4±30.9
Use of sulfonylurea 159 (81.5)
Use of metformin 112 (57.4)
Use of thiazolinedione 16 (8.2)
Use of DPP4i 22 (11.3)
Values are expressed as mean±standard deviation or number (%).
BMI, body mass index; WC, waist circumference; BP, blood pressure;
DM, diabetes mellitus; HbA1c, glycated hemoglobin; hsCRP, high sen- sitivity C-reactive protein; ALT, alanine transaminase; AST, aspartate transaminase; TC, total cholesterol; TG, triglyceride; HDL-C, high- density lipoprotein cholesterol; LDL-C, low-density lipoprotein choles- terol; DPP4i, dipeptidyl peptidase-4 inhibitor.
Fig. 2. The relative contributions of fasting hyperglycemia (FHG) and postprandial hyperglycemia (PPG) to overall hyperglycemia according to the tertiles of glycated hemoglobin (HbA1c). AUC, area under the curve.
FHG 100 mg/dL (5.5 mmol/L)
0 mg/dL
7:00 9:00 12:00 14:00 18:00 20:00 22:00 7:00 AUCTOTAL
AUCPPG
AUCFHG(TOTAL-PPG)
figures for PPG were 55.3±5.6 in Group 1, 42.0±4.4 in Group 2, and 33.5±2.8 in Group 3. Here, it can be seen that as HbA1c increased, the mean percentage of contribution of FHG in- creased (PANOVA=0.002, PTREND <0.001) while that of PPG decreased (PANOVA=0.002, PTREND <0.001) (Table 2, Fig. 3).
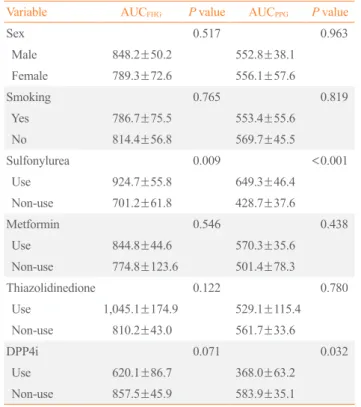
Predictors of FHG and PPG
To identify predictors of FHG and PPG, we used univariate and multivariate models with sex, age, illness duration, medication, and certain blood test results as independent variables, and AUCFHG and AUCPPG as dependent variables. The correlation analysis and Student’s t test showed significant associations be- tween AUCFHG and several factors, included age, body mass in- dex, waist circumference, HbA1c, C-peptide, ALT, TG, and sul- fonylurea use. Meanwhile, factors significantly associated with AUCPPG, including age, systolic blood pressure, and duration of diabetes, HbA1c, C-peptide, hsCRP, sulfonylurea, and DPP4i
use (Tables 3, 4). In the multivariate linear regression analysis, we only included factors that were significantly associated with AUCFHG and AUCPPG in the univariate analysis. In this analysis, besides HbA1c (β=0.615, P<0.001), only waist circumference (β=0.216, P=0.042) and TG (β=0.121, P=0.048) were associ- ated with AUCFHG. Apart from HbA1c (β=0.231, P=0.002), only age showed a significant association with AUCPPG (β=
0.196, P=0.009) (Table 5).
DISCUSSION
This study assessed not only the contribution of FHG and PPG to overall hyperglycemia but also the factors affecting these two types of hyperglycemia.
Many studies have been conducted on the contributions of fasting or PPG to overall blood glucose control; nevertheless, their results were found to be inconsistent. Monnier et al. [4] re- ported that the relative contributions of FHG and PPG differed Table 2. Comparisons of Percentages of Contributions of FHG and PPG between Tertiles of HbA1c
Tertiles of HbA1c
PANOVA PTREND
≤6.6% 6.7%–7.1% ≥7.2%
Contribution of FHG 44.7±5.55 58.0±4.35 66.5±2.80 0.002 <0.001
Contribution of PPG 55.3±5.55 42.0±4.35 33.5±2.80 0.002 <0.001
Values are expressed as mean±standard deviation.
FHG, fasting hyperglycemia; PPG, postprandial hyperglycemia; HbA1c, glycated hemoglobin; PANOVA, P value by analysis of variance; PTREND, P value by linear trend test.
70 65 60 55 50 45 40 35 30
65 60 55 50 45 40 35 30
Contribution of FHG (%) Contribution of PPG (%)
Tertiles of HbA1c Tertiles of HbA1c
≤6.6% 6.7%−7.1% ≥7.2% ≤6.6% 6.7%−7.1% ≥7.2%
Fig. 3. The relative contributions of (A) fasting hyperglycemia (FHG) and (B) postprandial hyperglycemia (PPG) to overall hyperglycemia according to the tertiles of glycated hemoglobin (HbA1c). Data are expressed as the mean±standard error. PANOVA, P value by analysis of variance; PTREND, P value by linear trend test.
A B
PANOVA=0.002
PTREND<0.001 PANOVA=0.002
PTREND<0.001
by the progression of diabetes. To assess these contributions, they categorized patients into different groups based on HbA1c tertiles and calculated the AUC. We based on their methods to analyze data of Korean patients; however, our study differed from theirs in several respects [4]. First, the number of patients in our study was small (n=194); therefore, we divided patients into three groups according to HbA1c tertiles instead of five groups as categorized by Monnier et al. [4]. Second, to have more accurate calculation of the areas and contributions, we se- lected patients who measured their own blood glucose at 7 points of time during the day (i.e., immediately before each meal, 2 hours after each meal, and before sleeping), compared to 4 points of time as mentioned in the study by Monnier et al.
[4]. Third, Monnier et al. [4] calculated AUCtotal with the cut-off point of 6.1 mmol/L (110 mg/dL), compared to 5.5 mmol/L (100 mg/dL) in our present study (To use this cut-off point, we referred to the American Diabetes Association’s upper limit of the normal fasting glucose) [6]. Finally, patients in our present
study had better blood glucose control than those in the study by Monnier et al. [4], as the mean HbA1c value in our study was lower (7.0% vs. 8.8%). Despite these differences, both studies shared the same result that the contribution of FHG increased and that of PPG decreased as HbA1c increased. This result was consistent with that of a study by Kikuchi et al. [7] and that of another study by Wang et al. [8]. Kikuchi et al. [7] conducted a study to assess the correlation between AUC and HbA1c in Jap- anese T2DM patients, but not the contributions of FHG and PPG. Their study results, however, pointed out that postprandial and fasting glucose were significantly associated with HbA1c in groups with better and poorer blood glucose control, respective- ly. In 2011, Wang et al. [8] categorized participants into five groups by HbA1c in a similar manner as the present study to as- sess the contributions of FHG and PPG among Asian T2DM patients. Like our study results, theirs also showed that the con- tribution of PPG tended to increase in the group with low HbA1c and FHG in the group with high HbA1c.
Unlike previous research, this study also analyzed factors Table 3. Simple Correlations between the AUC of PPG and
FHG and Continuous Variables in the Subjects
Variable AUCFHG AUCPPG
r P value r P value
Age –0.146 0.042 0.191 0.008
BMI 0.152 0.035 0.117 0.105
Waist circumference 0.185 0.010 0.123 0.009
Systolic BP 0.092 0.202 0.185 0.010
Diastolic BP 0.078 0.282 0.060 0.406
Duration of diabetes 0.093 0.199 0.185 0.010
HbA1c 0.658 <0.001 0.282 <0.001
C-peptide 0.217 0.002 0.198 0.006
hsCRP –0.043 0.549 0.145 0.043
ALT 0.228 0.001 0.047 0.516
AST 0.132 0.067 0.131 0.070
Creatinine –0.070 0.330 0.096 0.182
Total cholesterol 0.073 0.309 –0.081 0.264 Triglyceride 0.278 <0.001 0.080 0.268
HDL-C 0.007 0.924 –0.119 0.098
LDL-C 0.000 0.886 –0.063 0.384
P values are calculated using the Pearson’s correlation analysis.
AUC, area under the curve; PPG, postprandial hyperglycemia; FHG, fasting hyperglycemia; r, Pearson’s correlation coefficient; BMI, body mass index; BP, blood pressure; HbA1c, glycated hemoglobin; hsCRP, high sensitivity C-reactive protein; ALT, alanine transaminase; AST, as- partate transaminase; HDL-C, high-density lipoprotein cholesterol;
LDL-C, low-density lipoprotein cholesterol.
Table 4. Differences in the AUC of FHG and PPG According to Categorical Variables in the Subjects
Variable AUCFHG P value AUCPPG P value
Sex 0.517 0.963
Male 848.2±50.2 552.8±38.1
Female 789.3±72.6 556.1±57.6
Smoking 0.765 0.819
Yes 786.7±75.5 553.4±55.6
No 814.4±56.8 569.7±45.5
Sulfonylurea 0.009 <0.001
Use 924.7±55.8 649.3±46.4
Non-use 701.2±61.8 428.7±37.6
Metformin 0.546 0.438
Use 844.8±44.6 570.3±35.6
Non-use 774.8±123.6 501.4±78.3
Thiazolidinedione 0.122 0.780
Use 1,045.1±174.9 529.1±115.4
Non-use 810.2±43.0 561.7±33.6
DPP4i 0.071 0.032
Use 620.1±86.7 368.0±63.2
Non-use 857.5±45.9 583.9±35.1
Values are expressed as mean±standard deviation. P values are calcu- lated using Student’s t test.
AUC, area under the curve; FHG, fasting hyperglycemia; PPG, post- prandial hyperglycemia; DPP4i, dipeptidyl peptidase-4 inhibitor.
other than HbA1c that might affect FHG and PPG. When con- trolling for HbA1c and other factors, FHG showed a significant correlation with TG and waist circumference. It has been sug- gested in previous studies that TG and waist circumference in- creased fasting glucose by affecting insulin resistance. In 2002, Kametani et al. [9] followed-up patients for 9 years and found that obesity, hypertension, hypertriglyceridemia, and family his- tory of diabetes were significant risk factors of impaired fasting glucose. Furthermore, in 2013, Lin et al. [10] reported that the risk of impaired fasting glucose increased with heightened lev- els of TG. However, most previous studies showed that obesity and hypertriglyceridemia were factors related to impaired fast- ing glucose. Unlike our study, they did not thoroughly assess the effects of TG or waist circumference on fasting glucose in patients with diabetes.
Apart from HbA1c, age was the only factor affecting PPG.
The correlation between hyperglycemia and age has been previ- ously reported [11]. In 2013, Munshi et al. [12] analyzed the
fasting and postprandial contribution to overall hyperglycemia using the AUC method. They found that in higher age groups, the contribution of postprandial glucose was greater than that of fasting glucose. Chiu et al. [13] explained that as age increases, the functions of beta-cells decrease, resulting in the relative rise in the contribution of postprandial glucose.
Based on the results of this study, we provided the following recommendations for the treatment of patients with diabetes.
First, the contribution of PPG is generally higher in well-con- trolled patients; therefore, it is difficult to reach the target HbA1c by reducing only fasting glucose levels. In a previous study by Woerle et al. [14], patients who reached the target HbA1c of below 7.0% had a significantly lower postprandial glucose level than that of those who did not. However, the study also showed no differences in the fasting glucose level. As the relative contribution changes with the degree of glycemic con- trol, medications should be prescribed accordingly. Second, medication must be selected considering the age even if the HbA1c is the same, as the relative contribution of PPG increas- es with age which is typically accompanied by the decreased se- cretion of insulin. Third, the contribution of FHG is high in pa- tients with obesity or high levels of TG. The use of drug that usually reduces fasting glucose level, such as metformin and thiazolidinedione, should therefore be considered with priority.
This study encountered some limitations that should be ad- dressed. The first limitation was the retrospective nature of this study. Second, the number of patients (n=194) was relatively small compared to that of the previous study conducted by Monnier et al. [4]. Third, the patients in this present study had relatively good control of their blood glucose, which was re- flected in their relatively low HbA1c levels. When using tertiles to categorize the study sample into different groups, the group with the poorest control of blood glucose showed a mean HbA1c of 8%. Therefore, it remains unclear whether the results of our study apply to patients with poor blood glucose control.
However, our results of high contribution of fasting glucose in higher HbA1c levels and high contribution of postprandial glu- cose in lower HbA1c levels are consistent with the results of studies outside Korea that include patients with various levels of blood glucose control [4,5,7,8,14]. Thus, we can predict simi- lar results from Korean patients with poor glucose control.
Fourth, our study calculated the contribution of FHG and PPG using 7-point SMBG instead of continuous glucose monitoring (CGM). Most international studies that have shown proportional relationship between contribution of FHG and HbA1c used 4-point or 7-point SMBG [4,5,7,12,14-16]. Thus, we also used Table 5. Multiple Regression Analysis to Identify the Factors
Associated with FHG and PPG
Dependent variable Independent variable β P value AUCFHG (R2=0.436) HbA1c 0.615 <0.001
Age –0.068 0.222
Sex –0.011 0.854
Basal C-peptide 0.026 0.699 Waist circumference 0.216 0.042
BMI –0.168 0.096
Triglyceride 0.121 0.048
ALT 0.031 0.597
Sulfonylurea 0.036 0.533
AUCPPG (R2=0.161) HbA1c 0.231 0.002
Age 0.196 0.009
Sex 0.060 0.400
Systolic BP 0.084 0.265
Duration of DM 0.056 0.481
C-peptide 0.072 0.358
hsCRP 0.117 0.100
Sulfonylurea 0.094 0.257
DPP4i –0.132 0.088
FHG, fasting hyperglycemia; PPG, postprandial hyperglycemia; β, cor- rected regression coefficient; AUC, area under the curve; HbA1c, gly- cated hemoglobin; BMI, body mass index; ALT, alanine transaminase;
BP, blood pressure; DM, diabetes mellitus; hsCRP, high sensitivity C- reactive protein; DPP4i, dipeptidyl peptidase-4 inhibitor.
the same method and validated that the contribution of FHG is high at higher levels of HbA1c in Korean diabetes patients.
However, as measuring blood glucose using CGM can more ac- curately differentiate fasting and postprandial glucose than us- ing SMBG, detailed studies assessing the contribution of FHG and PPG in Korean patients using CGM are further required.
None the less, this present study made certain contributions to the current literature, as it, to our best knowledge, is the first to use 7-point SMBG in Korean T2DM patients to examine the re- search topic of interest.
This study assessed the contributions of FHG and PPG in 194 Korean T2DM patients and analyzed data of three HbA1c groups. The contribution of PPG was high in the group with rel- atively good control of blood glucose, whereas that of FHG gradually increased with elevated HbA1c. Two other factors, namely waist circumference and TG, were also significantly as- sociated with FHG. However, apart from HbA1c, age was the only factor that had a statistically significant association with PPG.
CONFLICTS OF INTEREST
No potential conflict of interest relevant to this article was re- ported.
ACKNOWLEDGMENTS
This research was supported by the 2020 scientific promotion program funded by Jeju National University.
AUTHOR CONTRIBUTIONS
Conception or design: G.K. Acquisition, analysis, or interpreta- tion of data: J.M., J.Y.K., S.Y., G.K. Drafting the work or revis- ing: J.M., J.Y.K. Final approval of the manuscript: G.K.
ORCID
Jaecheol Moon https://orcid.org/0000-0002-6617-6477 Ji Young Kim https://orcid.org/0000-0003-1016-9902 Gwanpyo Koh https://orcid.org/0000-0002-6020-2777
REFERENCES
1. Avignon A, Radauceanu A, Monnier L. Nonfasting plasma glucose is a better marker of diabetic control than fasting plas-
ma glucose in type 2 diabetes. Diabetes Care 1997;20:1822-6.
2. Rohlfing CL, Wiedmeyer HM, Little RR, England JD, Ten- nill A, Goldstein DE. Defining the relationship between plasma glucose and HbA(1c): analysis of glucose profiles and HbA(1c) in the Diabetes Control and Complications Trial. Diabetes Care 2002;25:275-8.
3. Bonora E, Calcaterra F, Lombardi S, Bonfante N, Formenti- ni G, Bonadonna RC, et al. Plasma glucose levels through- out the day and HbA(1c) interrelationships in type 2 diabe- tes: implications for treatment and monitoring of metabolic control. Diabetes Care 2001;24:2023-9.
4. Monnier L, Lapinski H, Colette C. Contributions of fasting and postprandial plasma glucose increments to the overall di- urnal hyperglycemia of type 2 diabetic patients: variations with increasing levels of HbA(1c). Diabetes Care 2003;26:
881-5.
5. Riddle M, Umpierrez G, DiGenio A, Zhou R, Rosenstock J.
Contributions of basal and postprandial hyperglycemia over a wide range of A1C levels before and after treatment inten- sification in type 2 diabetes. Diabetes Care 2011;34:2508-14.
6. American Diabetes Association. Standards of medical care in diabetes. Diabetes Care 2004;27 Suppl 1:S15-35.
7. Kikuchi K, Nezu U, Shirakawa J, Sato K, Togashi Y, Kiku- chi T, et al. Correlations of fasting and postprandial blood glucose increments to the overall diurnal hyperglycemic sta- tus in type 2 diabetic patients: variations with levels of HbA1c. Endocr J 2010;57:259-66.
8. Wang JS, Tu ST, Lee IT, Lin SD, Lin SY, Su SL, et al. Con- tribution of postprandial glucose to excess hyperglycaemia in Asian type 2 diabetic patients using continuous glucose monitoring. Diabetes Metab Res Rev 2011;27:79-84.
9. Kametani T, Koshida H, Nagaoka T, Miyakoshi H. Hypertri- glyceridemia is an independent risk factor for development of impaired fasting glucose and diabetes mellitus: a 9-year longitudinal study in Japanese. Intern Med 2002;41:516-21.
10. Lin SX, Berlin I, Younge R, Jin Z, Sibley CT, Schreiner P, et al. Does elevated plasma triglyceride level independently predict impaired fasting glucose?: the Multi-Ethnic Study of Atherosclerosis (MESA). Diabetes Care 2013;36:342-7.
11. Bando Y, Ushiogi Y, Okafuji K, Toya D, Tanaka N, Fujisawa M. The relationship of fasting plasma glucose values and other variables to 2-h postload plasma glucose in Japanese subjects. Diabetes Care 2001;24:1156-60.
12. Munshi MN, Pandya N, Umpierrez GE, DiGenio A, Zhou R, Riddle MC. Contributions of basal and prandial hyperglyce- mia to total hyperglycemia in older and younger adults with
type 2 diabetes mellitus. J Am Geriatr Soc 2013;61:535-41.
13. Chiu KC, Lee NP, Cohan P, Chuang LM. Beta cell function declines with age in glucose tolerant Caucasians. Clin Endo- crinol (Oxf) 2000;53:569-75.
14. Woerle HJ, Neumann C, Zschau S, Tenner S, Irsigler A, Schirra J, et al. Impact of fasting and postprandial glycemia on overall glycemic control in type 2 diabetes Importance of postprandial glycemia to achieve target HbA1c levels. Dia- betes Res Clin Pract 2007;77:280-5.
15. Schernthaner G, Guerci B, Gallwitz B, Rose L, Nicolay C, Kraus P, et al. Impact of postprandial and fasting glucose concentrations on HbA1c in patients with type 2 diabetes.
Diabetes Metab 2010;36:389-94.
16. Monnier L, Colette C, Dunseath GJ, Owens DR. The loss of postprandial glycemic control precedes stepwise deteriora- tion of fasting with worsening diabetes. Diabetes Care 2007;
30:263-9.