¶ Corresponding Author: Jong-Ho Lee, Department of Foodservice Management, Kyungsung University, 309, Suyeong-ro, Nam-gu, Busan 608-736, South Korea. Tel. +82-10-663-4473, Fax. +82-51-627-6830, E-mail: [email protected]
Culinary Science & Hospitality Research. 2016;22(1):61-69.
https://cshr.jams.or.kr/ ISSN 2466‐0752 (Print) ISSN 2466‐1023 (Online)
Evaluating the Effects of Product Quality and Branding on Perceived Price and Purchase Intention in
International Cafés, Selangor, Malaysia
Sang-Hyeop Lee1, Pong Chee Weng1 and Jong-Ho Lee2
1Centre for Tourism, Hospitality, and Culinary Management, Sunway University
2¶Department of Foodservice Management, Kyungsung University
ABSTRACT: Little is known regarding the impacts of product quality and branding on perceived price and purchase intention in international cafes, Selangor, Malaysia. This study tested the relationships among product quality, branding, perceived price, and purchase intention within the context of interna- tional cafes. A total of 301 customers at 6 international cafes in Selangor state in Malaysia completed questionnaires. It was found that product quality and branding positively influence perceived price. In addition, perceived price has a significant impact on purchase intention.
Keywords: product quality, branding, perceived price, purchase intention
INTRODUCTION
Today's the café industry has been growing fast with different concepts and varieties of products in the cafes to attract to the customers. The demand of pleasures on both fashion and food has been a growing trend just like a good concept with good food. Therefore, some of the brands have diversify into the café industry since there are huge demand.
The café shops are the leading lights on the eatery industry and fastest growing niche by offering differ- ent types of brewed coffees and others which in- creased 7% growth rate per annum in Asia included Malaysia. With the habits of the Malaysian going out to cafes to relax and gathering or the students spending their time on the assignments at the cafes been motivated more cafés to establish in Malaysia.
A increased of international brands coming into Malaysia since Malaysian are getting more know- ledgeable to enjoy the lifestyle by differentiating
good and bad coffee now towards the coffee and became as potential market for the international cafes. Branding is a part of the element for a com- pany to be success. Most of the successful compa- nies have their own concepts and brand equity to differentiate themselves from the competitors. The- refore, branding could be one of the core elements for a café to have its own concept and products.
According to Ambrose & Harris[1], international brands is able to deliver the same message and the similar qualities to the different international mar- kets by using the concepts which are recognizable and translatable to deliver the brand message su- ccessfully to the different types of cultures. Based on Diehl and Terlutter[6], international brand has given brand awareness related to the customers' purchase intention to believe on their products and some- thing that ensure it is better than other products which able to attract the potential customers.
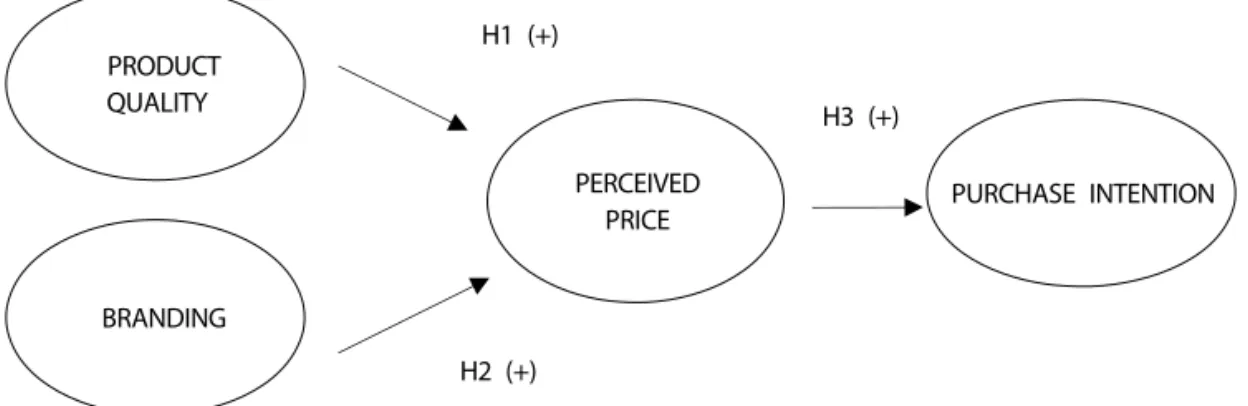
The objectives of this study were (1) to test the
effect of product quality on perceived price, (2) to explore the impact of branding on perceived price, (3) to identify the influence of perceived price on purchase intention.
BACKGROUND AND HYPOTHESES
International Café
The culture and the consumption of coffee in Malaysia have been increasing for the past few years and the people are starting to have more know- ledge on the coffees which allowed them to know on differentiating the coffees in the cafes now. The statistic of the coffee drinking habits in Malaysia showed 81.2% of Malaysians consider themselves as a coffee person[5]. Closed to 44% of the Malaysians consume 2 and 3 cups per day.The point of the in- ternational cafes is not only the signature products but also the concept of the café, the culture of the café, atmosphere, and environment which differ- entiating themselves with the other competitors[5].
The international cafes such as Starbucks, Caffe Bene, and The Coffee Bean have the own specialty products from the origin country which is different from Malaysia.
Product Quality
Infood and beverage industry, product quality is one dimension that could able to judge by the con- sumers after the dining based on the taste of the food, the freshness of the food, the presentation and portion size[3]. Product quality also often see from the attribute performance of the product. The food suppliers have to understand the consumer's perception on the quality products since the quality product would be the impact on what the custo- mers paying for and their repurchase intention the products in future. Product quality would defined al- so excellence and for instance, the customer's per- ceived quality would defined as the judgmental of the customers towards the product quality either failed or success after experienced the products[37].
The product quality is defined as the tangible pro- ducts and also the customers use the product qual- ity to measure the output[2]. Moreover, Raajpoot[27]
build the TANGSERV model for measure the tangible quality. It is vital to know the food quality is one
of the main construct in the model for the building the restaurant experience for customers. Product quality has significantly influenced the customer's future purchase intention in several of service set- tings[37]. Moreover, Rust and Oliver[28] supported that perceived product quality have both pre-pur- chase and post-purchase elements which they have argued that previous product experience would not be needed in order to evaluate the product quality.
Tsiotsou[35] found out that there is dual effect which are indirect and direct of perceived product quality on the purchase intention and on the other hand, the other studies stated single effect which al- so have indirect and direct focuses on services.
Branding
Branding would defined as what the company is based on the high quality, low price or certain tech- nologies which would benefit for the new product of the brand[22]. Besides, branding would able to help to shape the attitude of the customers for iden- tifying or differentiating the products from the other competitors[18,23]. Branding is the own character- istic and unique of a product or service to use as the competitive advantages[17]. Identity is vital for the companies in order to compete with the com- petitor and without an identification, it is hard for the company to compete with the other competi- tors[1]. The brands serve as the identification would able to help the customers to categorize and select the products easily with confidences[16]. A success- ful brand would have several of products and ser- vices under the same brand which is the brand stretching and also known as brand extension[12, 15]. According to Moutinho and Chien[24], the brand stretching would help the new products or services to take the advantages such as the value and the trust which already established by the main brand.
Price Perceived
As price could affect the satisfaction is service quality assessment which depending on the factors of service quality, product quality, price, situation and personal factors[38]. Schafer[32] stated that it is important to set the right prices because the prices would determine how much satisfaction or value of
PRODUCT QUALITY
BRANDING
PERCEIVED
PRICE PURCHASE INTENTION
H1 (+)
H2 (+)
H3 (+)
Figure 1. Conceptual model.
every customers get from the product. Zeithaml[37]
shows that marketing tool have determined both objective price and perceived price are significantly important factors when it comes to evaluating the product quality by the customers. Therefore, the perceived price has become the indicator to mea- sure the quality of the products based on different prices that set by the restaurant[1]. The customers would expecting higher quality if the price is higher and on the other hand, the customers would ex- pecting lower quality if the price is lower. Dodd and Monroe[7] insisted the interaction of the price hea- vily influenced by the perceived quality. The custo- mers would be price conscious even though their perceived quality are higher in order to have pur- chase intention which prove that price is the most common factor influence the customers' purchase intentions[7].
Purchase Intention
Purchase intention which is also called behavioral intention gets involved with a purpose of buying the products or services in future which turns into repetition purchases and interact with the desirable product or service[13,19]. Purchase intention has dif- ferent of alternatives under consideration by the customers with the options among the products or services which would influence the customer's pur- chase intention[36]. Satisfaction would be the judg- ment with cognitive and affective response to the customers to repurchase intention which is part of the behavioral factor[14]. On the other hand, Ryu and Jang[30] mentioned that improving customer satisfaction level is important for the customers to
patronage and recommendation intention in the up- scale restaurant setting. Positive of post-purchase behavioral intention such as good feedbacks about the product quality from the customers to the oth- ers which proves the products would have success- fully obtained the potential customers[4].
Positive behaviors shows that the customers would be bonding with the company such as post-pur- chase behavior intention[4]. Customers would be spreading the good feedbacks about the products to the others which shows the customers are recom- mending to the others and heavily depending on the companies' products[4]. Negative behaviors such as complaining to the retailers, family and friends, switching to other brand and stop purchasing the products which would decrease the business of the company.
METHODOLOGY
Survey and Sampling Measure
A self-administrated survey was established. The survey instrument was extended on the common re- lation of the literature. The self-administered ques- tionnaire included 19 items divided into 5 sections:
(a) Demographic questions ; (b) Product Quality (six items) adopted from[9] ; (c) Branding (two items) adopted from[20] ; (d) Perceived Price (two items) adopted from[29] ; and (e) Purchase Intention (three items) adopted from[30]. All items were measured on a 5-point likert scales ranging from 1 (Strongly disagree) to 5 (Strongly agree).
Frequency Percentage (%) Gender
Male 124 41.2
Female 177 58.8
Monthly allowance/income
Less than RM 800 105 34.9
RM 801~RM 1,600 95 31.6
RM 1,601~RM 2,400 74 24.6
More than RM 2,401 27 8.9
Education
SPM 54 17.9
Diploma 152 50.5
Degree 87 28.9
MS/Ph.D 8 2.7
Time visited
Once a week 122 40.6
2~4 times a week 141 46.8
5~7 times a week 26 8.6
More than 7 times a week 12 4.0 Length to stay
Less than 1 hour 102 33.9
1~3 hours 149 49.5
3~5 hours 39 12.9
Longer than 5 hours 11 3.7
*1 USD=RM 3.6 as of Feb, 2015.
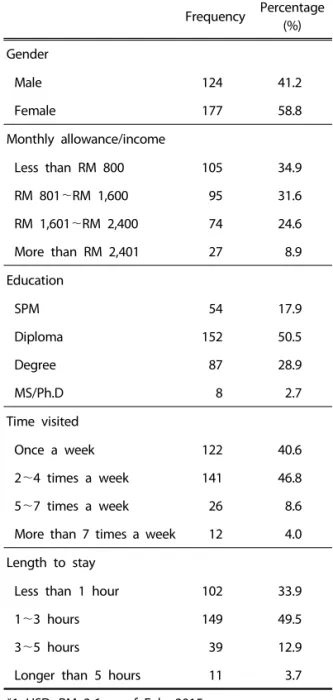
Table 1. Demographic characteristics (n=301) Data Collection
A self-reported questionnaire was distributed di- rectly (face-to-face) to 301 visitors over 7 days in February 2015 (a usable response rate of 95.2%) at the international cafes in Selangor State where many universities are located. All respondents were given a well and precise explanation of the survey. Each of the respondents was asked to answer the ques- tions on the questionnaire based on their experi- ence or feeling towards the international cafes. Also, a majority of respondents were attending uni- versities in Selangor State since the data collection was conducted in a college town.
Profile of the Sample
Table 1 shows the demographic information of the respondents. The sample (n=301) was 41.2%
male (n=124) and 58.8% (n=177). The monthly al- lowance of the respondents ranged from less than RM800 to more than RM2,401. The largest monthly allowance group was less than RM800 (34.9%), and followed by RM801 to RM1,600 (31.6%). Majority of the respondents were Diploma holders (50.5%), and followed by Degree holders (28.9%). Most of the re- spondents visit the international café 2 to 4 times a week (46.8%), and followed by once a week (40.6%). Majority of the respondents were spent 1~
3 hours for a visit on average (49.5%), and followed by stay less than 1 hour (33.9%).
RESULTS
Reliability
The reliability of the measures used in this study is stated in Table 2. The use of the Cronbach’s alpha was to analyze the reliability of the measurement for the result. The values that exceeded the cut-off point for Cronbach’s alpha of 0.70 to determine the items that correlated with each other in this re- sult[34]. The result shows that the reliability of the measures used in this current research acts ade- quately to measure each construct and analyze the research hypothesis.
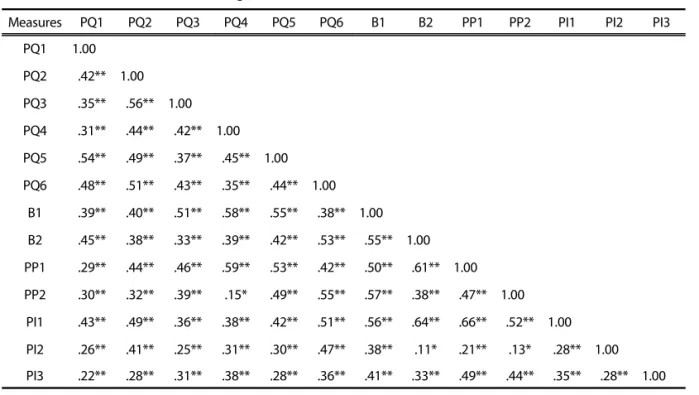
Correlation Analysis
A correlation matrix of the measurement items
was used for analyzing the obtained measures such as the convergent and the discriminant validity.
Convergent validity would be involved if the be- tween-construct item correlations are lesser than the within-construct item correlations. Discriminant val- idity is involved if the correlation sequences be- tween constructs are not same as the correlation se- quences within construct. As it shown in Table 3, the correlation patterns between indices are not same as the correction patterns within indices and the
Measures Cronbach’s alpha Product quality (PQ)
0.764 PQ1: Was the presentation of the food attractive?
PQ2: Were you satisfied with the quality of the food?
PQ3: Did you get your food at the proper temperature?
PQ4: Was the presentation of the beverage attractive?
PQ5: Was the beverage as nice as the presentation?
PQ6: Was the beverage served at the proper temperature?
Branding (B)
0.804 B1: Does branding ensure you the quality of the product?
B2: Does branding make you feel good?
Perceived price (PP)
0.783 PP1: The price at the international cafe is reasonable.
PP2: Was it worth to spend at the international café?
Purchase Intention (PI)
0.838 PI1: I would like to dine out in the international café again.
PI2: I would like tore commend the international café to my friend or others.
PI3: I would like to spread positive things about the international café to others.
Table 2. Reliability of the measures
Measures PQ1 PQ2 PQ3 PQ4 PQ5 PQ6 B1 B2 PP1 PP2 PI1 PI2 PI3
PQ1 1.00 PQ2 .42** 1.00 PQ3 .35** .56** 1.00 PQ4 .31** .44** .42** 1.00 PQ5 .54** .49** .37** .45** 1.00 PQ6 .48** .51** .43** .35** .44** 1.00
B1 .39** .40** .51** .58** .55** .38** 1.00 B2 .45** .38** .33** .39** .42** .53** .55** 1.00 PP1 .29** .44** .46** .59** .53** .42** .50** .61** 1.00 PP2 .30** .32** .39** .15* .49** .55** .57** .38** .47** 1.00 PI1 .43** .49** .36** .38** .42** .51** .56** .64** .66** .52** 1.00 PI2 .26** .41** .25** .31** .30** .47** .38** .11* .21** .13* .28** 1.00 PI3 .22** .28** .31** .38** .28** .36** .41** .33** .49** .44** .35** .28** 1.00
* Correlation is significant at .01 level.
** Correlation is significant at .05 level.
Table 3 Correlation matrix of the regression variables
Independent variables
Perceived price
Model 1 Model 2
Control variables
Gender .007 .009
Length of stay at the café
Less than 1 hour .047 .051
1~3 hours 3~5 hours More than 5 hours
.098 .047 .031
.076 .039 .055 Time visited at the café
Once a week 2~4 times a week 5~7 times a week More than 7 times a week
.087 .091 .065 .046
.070 .066 .041 .043 Hypothesized variables
Product Quality .226**
Branding .393**
R2 .022 .196
* p<.05, ** p<.01.
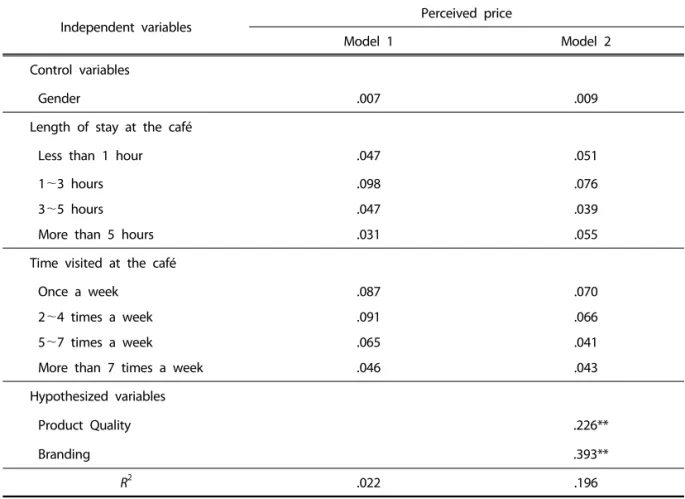
Table 4. Standardized regression coefficients predicting perceived price correlations between indices are lesser than the cor-
relations within indices. Both have justified that con- vergent validity and discriminant of the measures used in this research is relatively suitable.
Regression Analysis
Multiple regression was used to examine the de- pendent variables. Table 4 shows the relationship of perceived price and selected other variables. The re- gression analysis indicates that product quality (t=3.762, p<.01), and branding (t=2.814) had signi- ficant influences on perceived price. Thus, hypothe- sis 1 and 2 were supported. Product quality, brand- ing, and control variables, (i.e., gender, length of stay at café and average visit to the café) explained 19.6% of variance in perceived price.
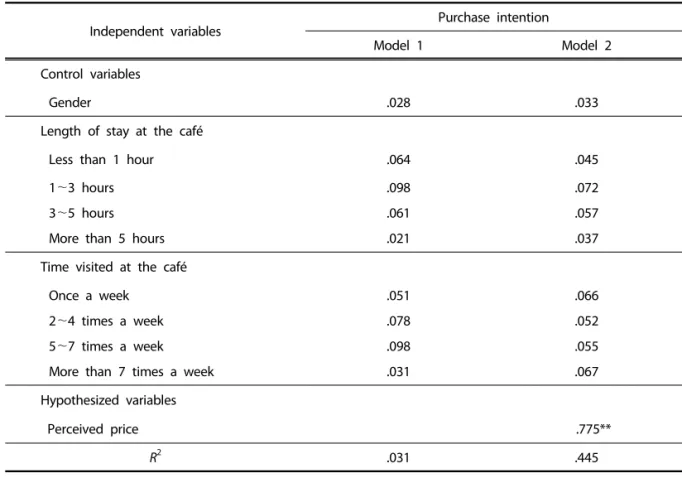
Table 5 shows the relationship between perceived price and purchase intention. The regression analysis indicates that perceived price was a significant pre-
dictor of purchase intention (t=11.361, p<.01), thus supporting hypothesis 3. Perceived price and control variables explained 44.5% of variance in purchase intention.
CONCLUSION AND LIMITATION
In the competitive international café markets whe- re café hoppers have many options which providing the café hoppers lower price perceived is important to the success of the business. Besides, if most of the café hoppers are more willing to purchase more beverages or foods in the international café, it helps the international cafés to able make more revenues without spending more time and effort to attract new comers. Owners and managers of the interna- tional cafes should know have the control of the product quality such as the presentation and quality of the foods and beverages. Also, international cafes
Independent variables Purchase intention
Model 1 Model 2
Control variables
Gender .028 .033
Length of stay at the café
Less than 1 hour .064 .045
1~3 hours 3~5 hours More than 5 hours
.098 .061 .021
.072 .057 .037 Time visited at the café
Once a week 2~4 times a week 5~7 times a week More than 7 times a week
.051 .078 .098 .031
.066 .052 .055 .067 Hypothesized variables
Perceived price .775**
R2 .031 .445
* p<.05, ** p<.01.
Table 5. Standardized regression coefficients predicting purchase intention
should know the significance of the product quality on influencing customers’ price perceived. On the basis of the findings of this study on international cafes, the product quality and branding of the inter- national cafes are more important than cafes layout.
Based on a high level of product quality and brand- ing on the international cafes, more satisfied café hoppers are able to be less price perceived which would leads to their purchase intentions. Good branding would help to involve the purchase in- tention of the customers[11]. Imported goods are of- ten generate better sales than the local goods be- cause some of the imported goods have better product quality which increase the purchase in- tention of the customers[21]. Customers have other options for services and products among the many international cafes in Malaysia. Therefore, service providers of the international cafes should know what exactly needs to be deliver in order to have the café hoppers’ purchase intentions.
The findings have few theoretical and managerial
implications. In terms of a theoretical perspective, this research contributes to knowledge about the price perceived and purchase intentions of the cus- tomers towards the international cafes. This study showed that product quality and branding have a positive impact on the price perceived on the inter- national cafes and a low level of price perceived which closely related to the customers’ purchase intentions. It indicates that product quality and branding should be considered when owners and managers evaluate the customers’ purchase inten- tions toward the international cafes.
In terms of a managerial perspective, the study re- sults indicate that success in promoting practical in- dicators of customer price perceived depends on the international cafes ability to improve product quality and branding of their international cafes. A low level of the customer perceived price towards the interna- tional cafés would have higher possibility to increase the customer purchase intention. Therefore, bring- ing customers’ price perceived to a low level is the
key to more success on the international cafes.
The present study has several limitations; (a) the findings of this study is not supposed to be general- ized to all of the cafes in the Malaysia because the data were collected using a convenience sampling approach. All data was collected at the cafes in the Selangor state (e.g., Subang Jaya). Thus, the results can be generalized to only cafes that are in similar demographic areas, (b) bias could involve when the respondents turned their survey into the resear- chers. Future study would be able to combine in- tangible elements (i.e., assurances, reliability, respon- siveness and empathy of the service providers) to better realize the significance of service offerings and physical environment in international cafes. Be- sides, this study only discovered two factors. These two factors might not reveal the whole features of the purchase intention of the international cafes.
Future studies could contain Future research should provide more factors (e.g., café layout, ambience) of the segmentation and classification of the interna- tional cafes in order to clarify the behavior intention of the customers.
REFERENCES
[1] Ambrose G, Harris P (2011). Packaging the Brand:
The Relationship between Packaging Design and Brand Identity. AVA Publishing.
[2] Baker DA, Crompton JL (2000). Quality, satisfac- tion and behavioral intentions. Annals of Tourism Research 27(3):785-804.
[3] Brotherton B (2008). Researching Hospitality and Tourism: A Student Guide. Sage.
[4] Boulding W, Kalra A, Staelin R, Zeithaml VA (1993). A dynamic process model of servicequa- lity: From expectations to behavioral intentions.
Journal of Marketing Research 30:7-27.
[5] Chen PT, Hu HH (2010). How determinant attri- butes of service quality influence customer-per- ceived value: an empirical investigation of the Australian coffee outlet industry. International Journal of Contemporary Hospitality Management 22(4):535-551.
[6] Diehl S, Terlutter R (Eds.) (2006). International Advertising and Communication: Current Insi- ghts and Empirical Findings. Springer Science &
Business Media.
[7] Dodds WB, Monroe KB(1985). The effect of brand and price informationon subjective product eva- luations. Advances in Consumer Research 12(1):
85-90.
[8] Garvin DA (1984). What does product quality really mean. Sloan Management Review 26(1).
[9] Gupta S, McLaughlin E, Gomez M (2007). Guest satisfaction and restaurant performance. Cornell Hotel and Restaurant Administration Quarterly 48(3):284-298.
[10] Grunert KG (2005). Food quality and safety: con- sumer perception and demand. European Re- view of Agricultural Economics 32(3):369-391.
[11] Guillet BD, Tasci AD (2009). Travelers' takes on hotel-restaurant co-branding: Insights for Chi- na. Journal of Hospitality & Tourism Research 34 (2):143-163.
[12] Hankinson G, Cowking P (1993). Branding in Action: cases and Strategies for Profitable Br- and Management. McGraw-Hill Book Company Limited.
[13] Halim WZW, Hamed AB (2005). Consumer pur- chase intention at traditional restaurant and fast food restaurant. In Proceedings of the Australian and New Zealand Marketing Acade- my (ANZMAC) Conference, Australia 107-112.
[14] Jolliffe L(Ed.) (2010). Coffee Culture, Destina- tions and Tourism. Channel View Publications Vol.24.
[15] Kang BN, Moon SS (2014). A study on mediating effect of customer satisfaction and attitudinal loyalty between the brand image and beha- vioral loyalty in coffee shops-focusing on capi- tal area and non-capital area. Culinary Science
& Hospitality Research 20(1):205-219.
[16] Keller KL (1993). Conceptualizing, measuring, and managing customer-based brand equity.
The Journal of Marketing 1-22.
[17] Kim JS, Choi SH (2011). A study on the effects of brand individuality of speciality coffee shops on brand loyalty. Culinary Science & Hospitality Research 17(1):125-142.
[18] Kim KY, Lee YH, Choi DH (2011). The effect of a family restaurant’s brand symbol on brand image, preference, and purchasing intention.
Culinary Science & Hospitality Research 17(3):
33-46.
[19] Kim MJ, Lee SB, Seo KH (2013). A study on the structural relationships among brand person- ality, customer-brand relationships quality and repurchase intention: Focusing on domestic pizza market. Culinary Science & Hospitality Research 19(2):130-148.
[20] Knight DK, Young Kim E (2007). Japanese con- sumers' need for uniqueness: Effects on brand perceptions and purchase intention. Journal of Fashion Marketing and Management: An Interna- tional Journal 11(2):270-280.
[21] LiuS, Smith JR, Liesch PW, Gallois C, Ren Y, Daly S (2010). Through the lenses of culture: Chinese consumers' intentions to purchase imported products. Journal of Cross-Cultural Psychology 0022022110383315.
[22] Lee SM (2014). The impacts of experience value on brand image, satisfaction, and customer lo- yalty in context of full-service restaurants:
Moderating effect of gender. Culinary Science &
Hospitality Research 20(5):93-100.
[23] Meenaghan T (1995). The role of advertising in brand image development. Journal of Product
& Brand Management 4(4):23-34.
[24] Moutinho L, Chien CS (2007). Problems in Mar- keting: Applying Key Concepts and Techniques.
Sage.
[25] Namkung Y, Jang S (2007). Does food quality reallymatter inrestaurants? Its impact on cus- tomer satisfaction and behavioral intentions.
Journal of Hospitality & Tourism Research 31(3):
387-409.
[26] O'Rourke N, Psych R, Hatcher L (2013). A Step- by-step Approach to Using SAS for Factor Ana- lysis and Structural Equation Modeling. Sas In- stitute.
[27] Raajpoot NA (2002). TANGSERV: A multiple item scale for measuring tangible quality in foodser- vice industry. Journal of Foodservice Business Research 5(2):109-127.
[28] Rust RT, Oliver RL(Eds.) (1993). Service Quality:
New Directions in Theory and Practice. Sage
Publications.
[29] Ryu K, Han H (2009). Influence of the quality of food, service, and physical environment on customer satisfaction and behavioral intention inquick-casual restaurants: Moderating role of perceived price. Journal of Hospitality & Tourism Research 34(3):310-329.
[30] Ryu K, Jang SS (2007). The effect of environ- mental perceptions on behavioral intentions through emotions: The case of upscale restau- rants. Journal of Hospitality & Tourism Research 31(1):56-72.
[31] SaadAndaleebS, Conway C (2006). Customer satisfaction in the restaurant industry: an exa- mination of the transaction-specific model.
Journal of Services Marketing 20(1):3-11.
[32] Schafer DP (2008). Revolution or Renaissance:
Making the Transition from an Economic Age to a Cultural Age. University of Ottawa Press Vol. 16.
[33] Siguaw JA, Mattila A, Austin JR (1999). The brand-personality scale. The Cornell Hotel and Restaurant Administration Quarterly 40(3):48-5.
[34] Sjovold E, Baker HG (2005). Analysis of Social Interaction Systems: SYMLOG Research and App- lications. University Press of America.
[35] Tsiotsou R (2006). The role of perceived product quality and overall satisfaction on purchase intentions. International Journal of Consumer Stu- dies 30(2):207-217.
[36] Wells V, Foxall GR (2012). Handbook of Devel- opments in Consumer Behavior. Edward Elgar Publishing.
[37] Zeithaml VA (1988). Consumer perceptions of- price, quality, and value: a means-end model and synthesis of evidence. The Journal of Mar- keting 2-22.
[38] Zeithaml VA, Bitner MJ (1996). Customer ex- pectations of services. Services Marketing 75-79.
Received: 17 SEP, 2015 Revised: 6 OCT, 2015 Accepted: 13 JAN, 2016