INTRODUCTION
Phytoplankton can be categorized as micro- plankton (20~200µm), nanoplankton (2~20µm) and picoplankton (0.2~2µm) (Pick and Caron, 1987). The contribution of picoplankton to pri- mary production and phototorphic biomass in- creases in oligotrophic environments, where it can be as much as 90% of total primary produc- tion (Li et al., 1983; Stockner and Antia, 1986).
Because of their smaller size, picoplankton have long been unrecognized in limological studies on phytoplankton.
From the studies of large lakes in the tem- perate zone (Nagata, 1986, 1990; Weisse, 1988;
Fahrenstiel et al., 1991), it has been suggested that contributions of picoplankton to total pri-
mary production are high, particulary in sum- mer, and consumption of picoplankton by proto- zoan grazers is important in trophic transfer and nutrient cycling. Munawar and Fahnenstiel (1982) reported that 37~50% of chlorophyll a and 28~55% of 14C-bicarbonate uptake were attributed to the phytoplankton of the ⁄3µm fraction in Lake Superior. Craig (1984) also re- ported that 24~97% of the photoassimilation of
14C-bicarbonate was found in the ⁄3µm frac- tion in a Canadian oligotrophic lake. Thus, it is assumed that the microbial loop operates acti- vely in large lakes. The soluble organic carbon has been produced by several planktonic pro- cesses, and a part of particulate organic carbon that is not edible for zooplankton operate into the grazing food chain cycling through the micro- bial loop. However, it is difficult to determine the
* Corresponding Author: Tel: (82) 42-520-5384, Fax: (82) 42-520-5854, E-mail: [email protected]
─
─ 277 ──
Seasonal Fluctuation of Chlorophyll a Concentration in the Size Fractionation of Phytoplankton in Daechung Reservoir
Mun, Jong--Jeon, Sang--Wook Lee, Soon--Jin Hwang1and In--Hye Oh*
(Division of Life Sciences, PaiChai University, Taejon 302-735, Korea and
1Dept. of Biological Systems Engineering, Konkuk University, Seoul 143-701, Korea)
Since a substantial part of the total planktonic primary production is due to the activity of the picoplankton, seasonal change of chlorophyll a in the picoplankton, nanoplankton and microplankton was determined at four locations in Daechung Reservoir from September in 1998 to September in 1999. Chlorophyll a concen- tration (⁄200µµm) was 0.7~36.9µµg/l in TAE (Taejeon site), 0.5~23.5µµg/l in MAN (Man site), 1.9~20.1µµg/l in HOE (Hoenam site), and 0.5~17.4µµg/l in DAM (Dam site).
Generally it was observed the the highest concentration of chlorophyll a was in September and the lowest in April to June. The relative contribution of chlorophyll a of each fraction was changed dramatically through the year. Relative contribution of chlorophyll a of microplankton was high from June to October, and low in March in all locations except HOE. However chlorophlyll a concentration of picoplankton fraction was 2.0~24.3% of total chlorophyll a (⁄200µµm) through the year and did not show any dramatic changes at all locations.
Key words : Daechung Reservoir, Chlorophyll a concentration, microplankton, nanoplankton, picoplankton
Sampling locations
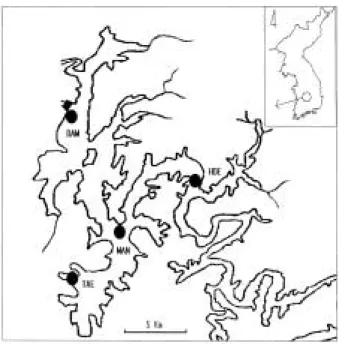
The sampling was carried out between Septem- ber in 1998 and September in 1999 at four loca- tions in Daechung Reservoir (Fig. 1). Since the water is stagnant in the vicinity of Taejon Intake Tower (TAE site), algal bloom was common every summer. Estuary (MAN site) is located in the mi- ddle distance between Dam and TAE. The water from upstream is mixed with the stagnant water near dam. Hoenam Bridge (HOE site) is located in the upper part of the Reservoir and water quality parameters have strongly been influenc- ed by the precipitation. It was reported that algal growth potential in the semdiment pore- water was high (Shin and Cho, 2001) and algal bloom was common in summer at this location.
Dam site (DAM) is the deepest and is located in lower part of the main stream.
Water quality parameters
10 L of water was sampled once to four times a month from September in 1998 to September in 1999. The temperature, pH and DO of the water was measured by multiprobe (YSI 6000) on site.
Samples for measuring water quality parameters (DO, SS, NH3-N, TN, TP) was taken separately and carried in the ice box to the laboratory and stored in the refrigerator before analysis. Water samples for nutrient measurements were filtered through 47 mm Whatman GF/C glass fiber fil- ters. All the water quality parameters was an- alyzed according to APHA-AWWA-WPCF (1989). For SS (suspended solids) measurement, water samples was f iltered through GF/C filter and dried in 105�C for 2 hours and calculated the differences of the weight of the filter. NH3-N was measured by phenate method. TN and TP was analyzed by UV specrophotmetric method
and ascorbic method respectively after persulfate digestion.
Measurement of chlorophyll a fractions
Whole water sample (0.5~2 L) was filtered through various meshes (3, 20, 200µm) separa- tely in the dark and the f iltrate was ref iltered through GF/C f ilter. The GF/C f ilters was homo- genized with 90% acetone in the chilled mortar and pestle and stored in the refrigerator for 24 hours. The opaque samples were centrifuged at 500 g for 20 minutes and the absorbance of the upper part was measured at 630 nm, 647 nm, 664 nm, 750 nm with spectrophotometer (Shimazu UV-2401PC). From those values, chlorophyll a concentration in picoplankton (0.2~2µm), nano- plankton (2~20µm) and microplankton (20~200 µm) were calculated. For this study, picoplank- ton were defined as organisms ⁄3µm in all dimensions. This size is slightly larger than the 2µm definition used by Pick and Caron (1987) but similar to the size used by Stockner and Antia (1986). Either definition could be used with similar results (Sicko-Goad and Stoermer, 1984;
Nagata, 1986; Fahnenstiel and Carrick, 1992).
Fig. 1. The sampling sites in Daechung Reservoir. TAE, Taejon Intake tower: MAN, Estuary: HOE, Hoe- nam Bridge: DAM, Daechung Dam.
RESULTS AND DISCUSSION
Climate
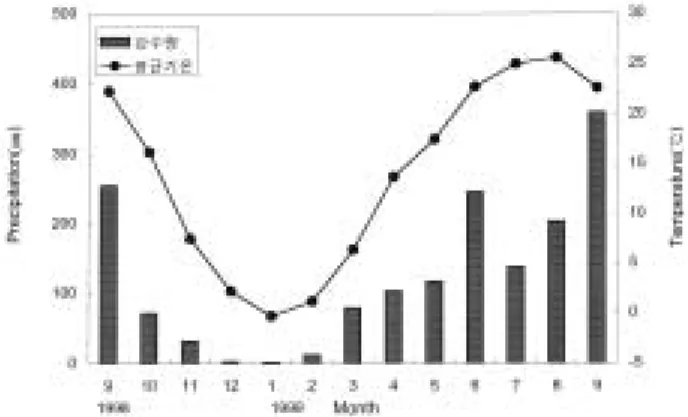
It was reported the annual rainfall was 1,137 mm since Daechung Reservoir was constructed and 85% of rainfall was concentrated in the rainy season (June-September). The annual rainfall was 1,246 mm and air temperature was -0.3~25.6�C during the experiment period (Fig.
2). The temperature and rainfall data were ob- tained from Taejon Meteorological station.
Seasonal abundance of Chlorophyll a concentration (⁄200µµm)
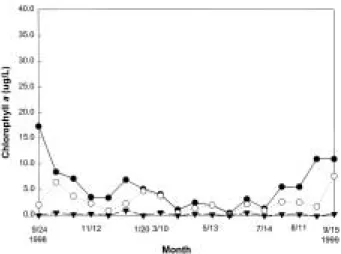
Chlorophyll a concentration (⁄200µm) increas- ed in July to October and decreased in winter and spring at all locations. In TAE site, the chlo- rophyll a concentration was 27.4~36.9µg/l in September to October, decreased to 5µg/l in April and began to increase in May (Fig. 3). The highest concentration of chlorophyll a was 36.9 µg/l in September at TAE site. In MAN site, Chlorophyll a concentration was 22.2~23.5µg/l in September and October and began to decrease at the end of October (Fig. 4). In HOE site, Chlorophyll a concentration was 13.9~20.1µg/l in September and October and increased in June (Fig. 5). In DAM site, chlorophyll a was 8.4~17.4 µg/l in September and October and lower than those in three other sites (Fig. 6). Generally, there were two peaks of chlorophyll a in Dae- chung reservoir. One peak was observed in September to October due to the increase of blue -green algae. The other one was in January due to the increase of Stephanodiscus (Shin et al.,
1999). Two peaks were observed in all locations.
Chlorophyll a concentration (⁄200µm) at all locations were almost the same as those of total chlorophyll a concentration in the previous re- ports (Oh, 1998; Shin and Cho, 1999).
Seasonal changing pattern of the chlorophyll a concentration of each size fraction
Chlorophyll a concentration of picoplankton (0.2~2µm), nanoplankton (2~20µm) and micro- plankton (20~200µm) was calculated. Chloro- phyll a concentration of microplankton was 0.1~
27.4µg/l in TAE, 0.2~20.1µg/l in MAN, 0.1~
Fig. 2. Monthly variation of temperature and precipita- tion in Taejon.
Fig. 3. Monthly variation of chlorophyll a concentration by size classes at TAE site.
Fig. 4. Monthly variation of chlorophyll a concentration by size classes at MAN site. The symbols are same as in Fig. 3.
14.1µg/l in HOE and 0.3~15.4µg/l in DAM. The lowest value was observed in March to April and the highest value in September to October. Chl- orophyll a concentration of nanoplankton is 0.1~
15.7µg/l at all locations in September in 1998~
September in 1999. Nanoplankton was 0.1~
13.4µg/l in TAE, 0.1~13.9µg/l in MAN, 0.1~1.5 µg/l in HOE and 0.1~3.0µg/l in DAM. The changing pattern of the chlorophyll a concen- tration of nanoplankton was almost similar to that of microplankton, but the degree of change was not drastic. The changing pattern of the
picoplankton was 0.4~0.7µg/l in June to July, a peak (0.9µg/l) in August and maintained a level of 0.3~0.4µg/l in Lake Biwa, Japan. Microscopic examination demonstrated that the major bio- mass of the picoplankton was attributable to chroococcoid cyanobacteria in Lake Biwa (Nagata, 1986). In marine systems this population con- sists largely of chroococcoid cyanobactearia and minute eukaryotic algae (Johnson and Sieburth, 1979; Waterbury et al., 1979; Johnson and Sieburth, 1982).
For this study, we measured only chlorophyll a concentration of phytoplankton fraction, but epifluorescence microscopic techniques were us- ed for the study of nanoplankton and picoplank- ton because it enabled the accurate determina- tion of bacterial densities in the picoplankton size class (0.2~2µm) (Hobbie et al., 1977; Watson et al., 1977; Caron et al., 1985). These estimates are much greater than estimates from tradi- tional procedures (Jannasch and Jones, 1959).
Fahnenstiel and Carrick (1992) measured the density and seasonal pattern of occurrence of picoplankton in Lakes Huron and Michigan and found that the picoplankton abundance in sur- face waters is from 10,000 to 20,000 cells/mL and similar to values reported for freshwater and shelf marine environments (Nagata, 1986; Wei- sse, 1988). In temperature aquatic environments, maximum seasonal picoplankton abundance occurs during thermal stratification (Caron et al., 1985).
The relative contribution of the chlorophyll a of each size fraction
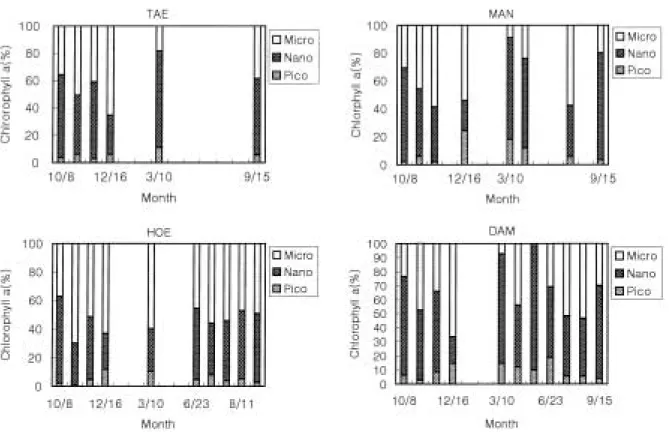
Fig. 7 shows the seasonal changes occurring in the size composition of chlorophyll a. Seasonally, a clear changes in the size structure of chloro- phyll a was found. From June to October the major proportion (82.2%) of chlorophyll a was
Fig. 5. Monthly variation of chlorophyll a concentration by size classes at HOE site. The symbols the same as in Fig. 3.
Fig. 6. Monthly variation of chlorophyll a concentration by size classes at DAM site. The symbols the same as in Fig .3.
found in the nano- and microplankton fraction while only 1.0~18.8% of the chlorophyll a (⁄200 µm) was found in the picoplankton fraction.
From November to May in the next year, the relative contribution of the ¤20µm was de- creased to a minimum of 40%, while that of the picoplankton chlorophyll a were relatively con- stant, ranging from 6.0~24.3%. The contribution of the chlorophyll a concentration of nanoplank- ton were higher and relatively constant, ranging from 18.8~76.4%. Similar results was reported by Nagata (1986). We did not observed the verti- cal changes in this study, Nagata (1986) reported that no clear vertical trend in the distribution and composition of the ⁄3µm chlorophyll a to the total chlorophyll a was found.
Phytoplankton that passed through 3- and 1- µm screens were responsible for 48 and 20% of the primary production respectively in Lake Superior (Fahnenstiel et al., 1986). Their impor- tance appeared to be a consistent feature of Lake Superior, since little seasonal or yearly variabi- lity was found. The exact role of these small cyanobacteria in the Lake Superior food web is uncertain; inevitably some portion of this pro-
duction must be consumed directly. In many ma- rine systems, protozoans are an important link in the food web as part of the so-called “micro- bial loop” (Azam et al., 1983). Heterotrophic pro- tozoans provide the link between small producers and larger multi-cellular zooplankton (Linsley et al., 1983). Picoplankton-protozoan trophic coup- ling is important in the pelagic food web and bio- geochemical cycling of Lake Baikal during sum- mer (Nagata et al., 1994)
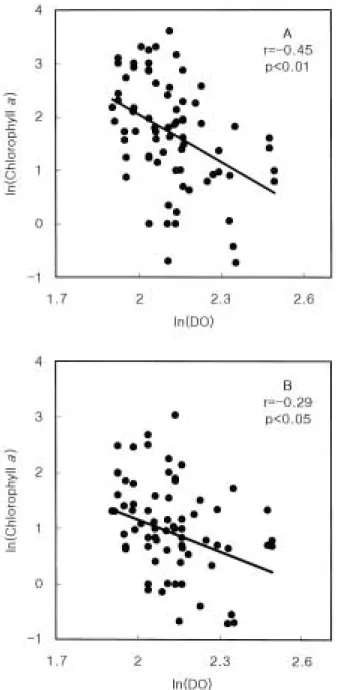
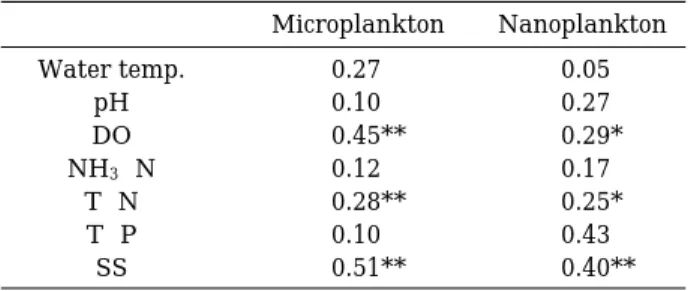
Correlation with water quality parameters pH, DO, NH3-N, TN, TP and SS (Suspended solids) was measured and calculated the corre- lation coefficient of chlorophyll a concentration and water quality parameter to f ind out which factor is the main factor related with chlorophyll a fraction (Table 1). All data from all locations were collected and the correlation coefficient between chlorophyll a concentration of each size fraction and environmental factor was calculat- ed. Microplankton and nanoplankton has a nega- tive correlation with DO (Fig. 8). Correlation co- efficient of chlorophyll a concentration with DO
Fig. 7. Percent of chlorophyll a concentration by size classes at TAE, MAN, HOE and DAM site.
is -0.45 (p⁄0.01) in microplankton and -0.29 (p⁄0.05) in nanoplankton. However correlation coefficient of chlorophyll a fraction with SS is 0.51 (p⁄0.01) in micorplankton and 0.40 (p⁄
0.01) in nanoplankton (Fig. 9). We do not know how SS influences the abundance of microplank- ton and nanoplankton.
Generally, DO was low and SS was high in
eutrophic lakes. It seemed that high chlorophyll a concentration of larger phyoplankton might have some effect to decrease of DO and increase of SS.
In this work, a quite different pattern of sea- sonal change in chlorophyll a of the picoplankton from those of larger phytoplankton was demon- strated in the Daechung Reservoir. The contri-
Fig. 8. Relationship between DO (Dissolved Oxygen) and chlorophyll a concentration (A: microplankton, B:
nanoplankton).
Fig. 9. Relationship between SS (Suspended solids) and chlorophyll a concentration (A: microplankton, B:
nanoplankton)
bution of the picoplankton chlorophyll a increas- ed from 1.0 to 18.8% of the chlorophyll a (⁄200 µm). The drastic change in the size structure of the phytoplankton community seemed to involve some interesting problems associated with the physiological and morphological properties (nutrient uptake, sinking loss, and grazing pre- ssure) of the phytoplankton of each size fraction, which deserved further study. Moreover, further research will be needed to clarify the contribu- tion of picoplankton to the primary production of Daechung Reservoir, and the trophic linkages be- tween picoplankton and the feeders which ingest picoplankton.
REFERENCES
APHA-AWWA-WPCF. 1989. Standard Methods for the Examination of Water and Wastewater. 17th ed. American Public Health Association, Wa- shington DC.
Azam, F., T. Fenchel, J.C. Field, J.S. Gray, L.A.
Meyer-Reil and F. Thingstand. 1983. The ecologi- cal role of water-column microbes in the sea.
Mar. Ecol. Prog. Ser. 10: 257-263.
Caron, D.A., F.R. Pick and D.R.S. Lean. 1985. Chro- ococcoid cyanobacteria in Lake Ontario: vertical and seasonal distributions during 1982. J. Phycol.
21: 171-175.
Craig, S.R. 1984. Productivity of algae picoplankton in a small meromictic lake. Verh. Int. Ver. Limnol.
22: 351-354.
Fahnenstiel, G.L., H.J. Carrick and R. Iturriaga. 1991.
Physiological characteristics and food-web dyna- mics of Synechococcus in Lake Huron and Michi- gan. Limnol. Oceanogr. 36: 219-234.
Fahnenstiel, G.L., L. Sicko-Goad, D. Scavia and E.
F. Stoermer. 1986. Importance of picoplankton in Lake Superior. Can. J. Fish. Aquat. Sci. 43: 235-
240.
Fahnenstiel, G.L. and H.J. Carrick. 1992. Phototro- phic picoplankton in Lakes Huron and Michigan : Abundance, Distribution, Composition and Con- tribution to Biomass and Production. Can. J. Fish Aquat. Sci. 49: 379-388.
Hobbie, J.E., R.J. Daley and E. Jones. 1977. Use of nuclepore f ilters for counting bacteria by f luore- scence microscophy. Appl. Environ. Microbiol. 33:
1225-1228.
Jannasch, H.W. and G.E. Jones. 1959. Bacterial pop- ulations in sea water as determined by different methods of enumeration. Limnol. Oceanogr. 4:
128-139.
Johnson, P.W. and J. McN Sieburth. 1979. Chroo- coccois cyanobacteria in the sea: a ubiquitous and diverse phototrophic biomass. Limnol. Oceanogra.
24: 928-935.
Johnson, P.W. and J. McN Sieburth. 1982. In situ morphology and occurrence of eukaryotic photo- trophs of bacterial size in the picoplankton of estuarine and oceanic water. J. Phycol. 18: 318- 327.
Li, W.K.W., D.V. Subba Rao, W.G., Harrison, J.C.
Smith, J.J. Cullen, B. Irwin and T. Platt. 1983.
Autotrophic picoplankton in the tropical ocean.
Science (Washington DC) 219: 292-295.
Linley, E.A.S., R.C. Newell and M.I. Lucas. 1983.
Quantitiative relationships between phytoplank- ton, bacteria and heterotrophic micro-flagellates in shelf waters. Mar. Ecol. Prog. Ser. 12: 77-89.
Munawar, M. and Fahnenstiel, G.L. 1982. The abun- dance and signif icance of ultraplankton and micro -algaes at an offshore station in central Lake Superior. Can Tech. Rep. Fish. Aquat. Sci. 1153:
1-13.
Nagata, T. 1986. The seasonal abundance and verti- cal distribution of the ⁄3µm-phytoplankton in the north basin of Lake Biwa. Ecol. Res. 1: 207- 221.
Nagata, T. 1990. Contribution of picoplankton to the grazer food chain of Lake Biwa. In: Large Lakes (ed. by) M.M. Tilzer and C. Serruya. Springer- Verlag. Berlin Heidelberg.
Nagata, T., K. Takai, K. Kawanobe, D. Kim, R.
Nakazato, N. Guselnikova, N. Bondarenko, O.
Mologawaya, T. Kostrnov, V. Drucker, Y. Stoh and Y. Watanabe. 1994. Autotrophic picoplankton in sourthern Lake Baikal; abundance, growth and grazing mortality during summer. J. Plank. Res.
16: 945-959.
Oh, In-Hye. 1988. Ecological Studies on Daechung Reservoir. Korean J. Lim. 31: 79-87.
Pick, F.R. and D.A. Caron. 1987. Picoplankton and nanoplankton biomass in lake Ontario: relative contribution of phototrophic and heterotrophic communities. Can. J. Fish. Aquat. Sci. 44: 2164- 2172.
Table 1. Correlation coeff icients calculated with Chloro- phyll a concentration and Environmental para- meters.
Microplankton Nanoplankton
Water temp. 0.27 0.05
pH 0.10 -0.27
DO -0.45** -0.29*
NH3-N -0.12 -0.17
T-N -0.28** -0.25*
T-P -0.10 0.43
SS 0.51** 0.40**
*: Signif icant
**: Highly signif icant
Stockner, J.G. and N.J. Antia. 1986. Algal picoplank-
ton from marine freshwater ecosystems: a multi- (Received 1 Nov. 2001, Manuscript accepted 9 Dec. 2001)
⁄ ¤
대청호에서 식물플랑크톤 크기에 따른 엽록소 농도의 계절적 변화
문종전∙이상욱∙황순진1∙오인혜*
(배재대학교 생명과학부, 1건국대학교 지역생태시스템공학과)
여러 지역의 호소환경에서 picoplankton이 중요한 일차 생산자로 보고되고 있는데 대청호에서 이 를 조사하기 위하여 1998년 9월부터 1999년 9월까지 식물플랑크톤 크기에 따른 엽록소 농도의 계절적 변화를 조사하였다. 200µm 이하의 식물플랑크톤은 대전취수탑에서 0.7~36.9µg/l, 만입부 에서 0.5~23.5µg/l회남대교에서 1.9~20.1µg/l, 대청댐에서 0.5~17.4µg/l이었는데, 조사지점4곳 에서 모두 9월에 최대치를 나타내었으며 그 이후는 서서히 감소되어 4~6월에 최소값을 보이는 경향을 나타내었다. 계절에 따른 엽록소 농도의 크기별 조성비율을 보면, 연중 microplankton과 nanoplankton 조성비율은 큰 변이를 보였는데, 회남 대교를 제외한 조사지역 3 곳에서 6~10월에 는 microplankton의 비율이 높았으나 3월에는 조성비율이 매우 낮은 경향을 보였다. 그러나 조사 지역4곳 모두에서picoplankton은 연중2.0~24.3%로 거의 일정하였다.