2008 한국암반공학회춘계학술발표회 / 2008.3.20
Systematic analysis of deformation behavior using Artificial Neural Network model and field database
in NATM tunnel
인공신경망과 현장 데이터베이스를
이용한 NATM 터널의 조직적인 변형거동 분석
Jae-Ho Lee, Post-Doctoral Researcher, Dept. of Civil Engng., KyungPook National Univ.
Young-Su Kim, Professor, Dept. of Civil Engng., Kyungpook National University.
Shinish Akutagawa, Assistant Professor, Dept. of Architecture & Civil Engng., Kobe Univ., Japan.
Guang-Ri Jin, Graduate Student, Dept. of Civil Engng., Kyungpook National University.
Gyo-Won Kim, Professor, Dept. of Dep. of Geology, Kyungpook National Univ.
Ii-Han Jeong, Assistant manager, Korea Rural Community & Agriculture Corporation.
1. Introduction
Currently an increasing number of urban and mountain tunnels with small or deep overburden are excavated according to the principle of the New Austrian Tunneling Method (NATM). Successful planning, excavation, lining installation and maintenance of NATM tunnel demands prediction, control and monitoring of tunnel behavior, face stability, surface settlement, gradient and ground displacement with high accuracy.
Various analytical methods (Akutagawa et al., 2001, Swoboda, 1979, Sakurai and Akayuli, 1998) have studied for prediction accuracy and improvement of tunnel behavior, as FEM simulation and empirical method using function. However, no method is available for prediction tunnel behavior, since this indicates that more than one parameter influences the magnitude of tunnel behavior. Tunnel engineer have experienced complex geology, unpredictability in material behaviors, difficult match up of analytical values and field data. One can be understand the importance of effective sharing of knowledge and experience, as tunnel construction information. Of several possible methods of incorporating tunnel construction information for this prediction accuracy and improvement of tunnel behavior, this paper proposes the use of Artificial Neural Networks (Rumelhart et al., 1986, 1995, Toll, 1996) as a key technique. As this method requires firstly preparation of database that contains information to relate input parameters to output parameters,
a database is created by performing the acquirement of field data. Artificial Neural Networks (ANN) model are then created studying the database and establishing selected relationships between input and output parameters. Once this preparation is made, a user only requires the input parameters relating output parameters to immediately perform ANN analysis for remaining construction sequence.
This paper discussed the prediction of tunnel displacement by the three categories due to excavation stage using ANN analysis with acquired field data. It firstly introduces a brief framework of an ANN approach concept on the application of field database. Secondly, the outline of studied tunnel site and ANN analysis then described in detail. Finally, it is shown the design and development process of ANN model for predicting tunnel displacement, and discussed by the result of ANN analysis.
2. Artificial Neural Network approach concept on Tunnel design/construction
Numerical analysis or empirical method carried out for the validity the selected support system and tunnel geometry. However, it is difficult to understand that ground estimation over all tunnel section. For reason them, on construction, various measures and investigation carried out for the understanding of stress and displacement field, and ground estimation. Monitored parameters are the geology and geo-mechanical properties of the rocks, tunnel face observation recorded, the presence of underground water, surface settlement, subsurface displacement and the tunnel displacement so on. ANN analysis carried out for the tunnel displacement prediction of next excavation and un-constructed area with acquired tunnel information. Fig. 1 shows a scheme of ANN model for prediction of tunnel behavior. ANN model (Rumelhart et al., 1986, Rumelhart et al., 1995, Toll, 1996) is used in non-linear interrelationship problem of pattern recognition or the mapping problem of cause factor and result ones. The neural network in the input layer receives tunnel geometric, ground condition, excavation method and support system, as input values. Tunnel behaviors are to be determined from output values.
Data interpretation
•Parameter identification
•Predictive analysis
Construction and Monitoring Design
Database ANN model
Field investigation
Data interpretation
•Parameter identification
•Predictive analysis
Construction and Monitoring Design
Database ANN model
Field investigation
Data division Field database
Data processing
Tunnel behavior Tunnel geometrics
Ground condition
Support system Excavation system
ANN model Data division Field database
Data processing
Tunnel behavior Tunnel geometrics
Ground condition
Support system Excavation system
ANN model
(a) Generally flow (b) Process of ANN analysis Fig. 1 ANN based tunnel design and construction
3. Outline of Artificial Neural Network model
ANN is a form of artificial intelligence that attempts to mimic the behavior of the human brain and nervous system. Back Propagation Neural Network (BPNN) is the most popularly used ANN and it is well suited for problem of classification, prediction, adaptation control, system identification, and so on (Rumelhart et al., 1986; Rumelhart et al., 1995; Baheer, 2000). The BPNN always consists of at least three layers; input layer, hidden layer and output layer. Each layer consists of a number of elementary processing units, called neurons, and each neuron is connected to the next layer through weights, i.e. neurons in the input layer will send its output as input for neurons in the hidden layer and similar is the connection between hidden and output layer. All neurons in the BPNN are associated with a bias neuron and a transfer function, except for the input layer.
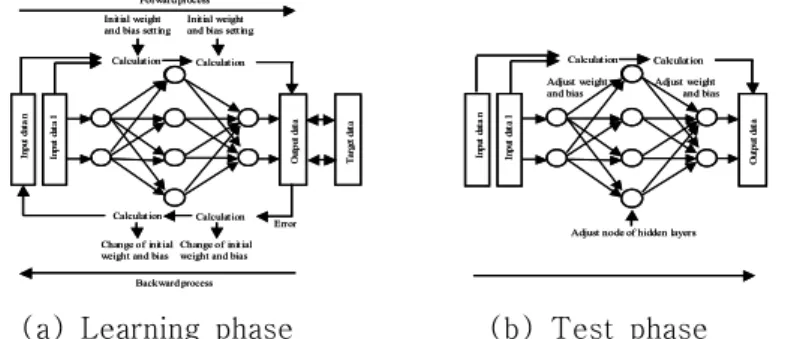
The bias has a constant input of 1, while the transfer function filters the summed signals received from this neuron. The application of these transfer functions depends on the purpose of the neural network. The output layer produces the calculated output vectors corresponding to the solution. BPNN performs in two phases; learning (training) phase and testing (or validation) phase. During learning of the network, as in Fig. 2 (a), data is processed through the input layer to hidden layer, until it reaches the output layer, as is called forward process. In this layer, the output is compared to the targeted values (the "true" output). The difference or error between both is processed back through the network, as is called backward process, updating the individual weights of the connections and the biases of the individual neurons. The input and output data are mostly represented as vectors called training pairs. Each path through the entire training pattern is called a cycle or epoch. The process is then repeated as many epochs as needed until the error within the user specified goal is reached successfully. The process as mentioned above is repeated for all the training pairs in the dataset, until the network error converged to a threshold minimum defined by a corresponding sum square error function. A network could provide almost perfect answers to the set of problems with which it was trained, but fail to produce meaningful answers to other examples. Testing phase is a calculation process that is undertaken after training has been completed, as shown in Fig. 2 (b). Fig. 3 illustrates a typical two hidden-layer BPNN architecture used in this research. In order to perform a BPNN analysis, one needs to be aware of several parameters and operations associated with network training (Hagazy et al., 1994). They are database size and partitioning, data preprocessing, balancing, data normalization, input / output representation, network weight initialization, BPNN learning rate and momentum coefficient, transfer function, convergence criteria, number of training cycles, training modes, hidden layer size and parameter optimization so on (Baheer, 2000). Details of the BPNN
algorithm are beyond the xcope of this study and can be found in Hecht-Nielsen.
Initial weight and bias setting Initial weight
and bias setting Calculation Calculation
Error Calculation Calculation
Change of initial weight and bias Change of initial weight and bias
Input data 1
Input data n Output data
Forward process
Backward process
Target data
Initial weight and bias setting Initial weight
and bias setting Calculation Calculation
Error Calculation Calculation
Change of initial weight and bias Change of initial weight and bias
Input data 1
Input data n Output data
Forward process
Backward process
Target data
Adjust weight and bias
Calculation Calculation
Input data 1
Input data n Output data
Adjust weight and bias
Adjust node of hidden layers Adjust weight and bias
Calculation Calculation
Input data 1
Input data n Output data
Adjust weight and bias
Adjust node of hidden layers
(a) Learning phase (b) Test phase Fig. 2. Learning and testing phase in neural network system
Iir-1
Iir
Iir+1 Input vector (Input pattern)
Input layer, i Hidden layer, h Output layer, o r-1
r
r+1
q-1
k+1 q
k-1
k
q+1
1 1
compare
compare
compare
Yok-1
Yok
Yok+1 Output vector Target vector W i rhq
θh q
W hqok
θok
Ook
Ook+1 Ook-1
Error
Adjust weights and bias Iir-1
Iir
Iir+1 Input vector (Input pattern)
Input layer, i Hidden layer, h Output layer, o r-1
r
r+1
q-1
k+1 q
k-1
k
q+1
1 1
compare
compare
compare
Yok-1
Yok
Yok+1 Output vector Target vector W i rhq
θh q
W hqok
θok
Ook
Ook+1 Ook-1
Error
Adjust weights and bias
Fig. 3. Scheme of Three-layered BPNN
4. Studied tunnel site
4.1 Tunnel construction characteristic
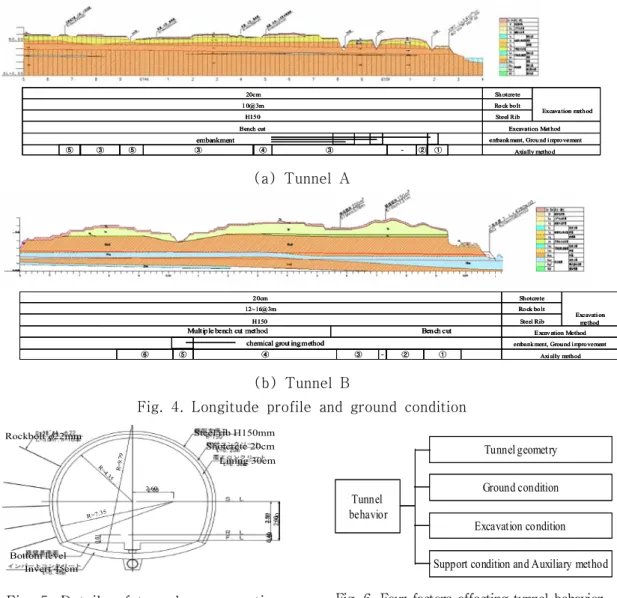
Acquirement of field data is performed by two tunnel of the TOHOKU SHINKANSEN Project in Japan. These tunnels are located at the northern end of the Honshu, between Hachinohe and Shin-Aomori. The longitudinal profile with geological conditions illustrated in Fig. 4 (a) tunnel A and (b) tunnel B. In Figure, it is know that NATM tunnel excavated through sandy layer under shallow depth and Auxiliary method is applied for face stabilization and water inflow control. The geological interpretation is based on the geological records of the tunnel excavation and the former geological investigations. The geological profile of the ground consisted of sandy layer. The standard tunnel cross section are given in Fig. 5.
Supports reinforcements are rock bolt, shotcrete and steel support as show in Fig.
5. The excavation was conducted by the top heading and three bench cut method.
Excavation method
Axially metho d embankment, Grou nd i mpro vement
Excavation Met hod Steel Rib Ro ck bolt Sh otcrete
Bench cut H150 1 0@3m
20cm
⑤ ③ ⑤ ③ ④ ③ - ② ①
embankment
Excavation method
Axially metho d embankment, Grou nd i mpro vement
Excavation Met hod Steel Rib Ro ck bolt Sh otcrete
Bench cut H150 1 0@3m
20cm
⑤ ③ ⑤ ③ ④ ③ - ② ①
embankment
Excavation method
Axially metho d embankment, Grou nd i mpro vement
Excavation Met hod Steel Rib Ro ck bolt Sh otcrete
Bench cut H150 1 0@3m
20cm
⑤ ③ ⑤ ③ ④ ③ - ② ①
embankment
(a) Tunnel A
Excavati on method
Axi ally method embank ment, Grou nd i mpro vement
Excav ation Method Steel Rib Ro ck bo lt Sh otcrete H150
12~16@3m 2 0cm
⑥ ⑤ ④ ③ - ②
chemical grout ing method
Bench cut Multiple bench cut method
①
Excavati on method
Axi ally method embank ment, Grou nd i mpro vement
Excav ation Method Steel Rib Ro ck bo lt Sh otcrete H150
12~16@3m 2 0cm
⑥ ⑤ ④ ③ - ②
chemical grout ing method
Bench cut Multiple bench cut method
①
Excavati on method
Axi ally method embank ment, Grou nd i mpro vement
Excav ation Method Steel Rib Ro ck bo lt Sh otcrete H150
12~16@3m 2 0cm
⑥ ⑤ ④ ③ - ②
chemical grout ing method
Bench cut Multiple bench cut method
①
(b) Tunnel B
Fig. 4. Longitude profile and ground condition
Rockboltφ22mm
Bottom level
Lining 30cm Shotcrete 20cm Steel rib H150mm
Invert 45cm
R=7.35 R=4.35
0.40
2.60 R=9.7
9
2.50 2.90
Fig. 5. Details of tunnel cross section
Tunnel behavior
Tunnel geometry
Support condition and Auxiliary method Ground condition Excavation condition Tunnel
behavior
Tunnel geometry
Support condition and Auxiliary method Ground condition Excavation condition
Fig. 6. Four factors affecting tunnel behavior
4.2 Relationship of factors affecting tunnel behavior
Factors affecting tunnel behavior can be grouped into four major categories.
These parameters shown in Fig. 6 are as input data to design ANN model for prediction the tunnel behavior. Geological and geometry of NATM tunnel used in ANN analysis are illustrated in Fig. 7.
Forepoling
Tunnel depth Ground type; Clay, Sand and Alter o f strata
Steel pipe forepiling Face bolt and
face shotcrete Rock bolt
Shotcrete Steel support
Groundwater
Auxiliary method Surface p lane
Specification of Steel pipe forepiling Forepoling
Tunnel depth Ground type; Clay, Sand and Alter o f strata
Steel pipe forepiling Face bolt and
face shotcrete Rock bolt
Shotcrete Steel support
Groundwater
Auxiliary method Surface p lane
Specification of Steel pipe forepiling
Fig. 7. Tunnel geological and geometry parameters used in ANN analysis
Face observation records, rock strength and their qualities such as joint spacing, weathering etc., are processed in a timely manner so as to grasp the present condition of tunnel, and to reflect the findings in subsequent predictions. The rating was calculated by equation (1).
{ } { } { }
{ } { } { }
{( 1) 100/3} {( 1) 100/3} {( 1) 100/3}]/9 3 / 100 ) 1 ( 3 / 100 ) 1 ( 3 / 100 ) 1 (
3 / 100 ) 1 ( 3 / 100 ) 1 ( 3 / 100 ) 1 ( [ 100
×
− +
×
− +
×
− +
×
− +
×
− +
×
− +
×
− +
×
− +
×
−
−
I H
G
F E
D
C B
A
(1) In equation (1), A, B, C, D, E, F, G, H and I are face condition, condition of unsupported excavation surface, compressive strength, weathering/alteration, crack/fissure frequency, crack/fissure conditions, mode of cracking/fissuring, water in flow and the deterioration due to water, respectively. And, J and K are the longitudinal and transverse direction of crack/fissure. Tunnel depth, geological conditions are considered. In case of tunnel diameter, the entire length of the TOHOKU SINKANSEN Project has a constant diameter of 10m, the effect of tunnel diameter is negligible. Geological condition is represented by the numeric value, as the rating of tunnel face record. Fig. 8 showed the relation of Tunnel depth, face rating, face condition and crown settlement. Tunnel face rating was calculated by equation (1).
Excavation and support condition are considered as the factors affecting tunnel behavior. Two types of excavation methods, which are its top heading and multiple bench cut methods, are consisted in this study. Support condition includes shotcret, rock bolt length and number, H-steel type. In addition, another support system affecting tunnel behavior is auxiliary method. forepoling and steel pipe forepiling are generally applied to prevent surface settlement and crown settlement. And, face shotcrete, face rock bolt, temporary invert and tunnel side bolt are used for the control of crown settlement and foot settlement. In general practice, tunnel support system with appropriate auxiliary method can considerably reduce the magnitude of tunnel deformation. Factor affecting tunnel behavior on the auxiliary method in this study are the technique (type) of auxiliary reinforcements, steel pipe forepiling specification as diameter, length, number, construction degree etc., and the exist of ground-water control method and tunnel face reinforcement.
-20 0 20 40 60 80 100 120
0 10 20 30 40 50
Tunnel depth(m)
Crown (mm)
-20 0 20 40 60 80 100 120
0 10 20 30 40
Face rating
Crown (mm)
-20 0 20 40 60 80 100 120
0.5 1.0 1.5 2.0 2.5 3.0 3.5 4.0 4.5
Face condition
Crown (mm)
(a) Tunnel depth (b) Face rating (c) Face condition Fig. 8. Relation of Tunnel depth, face rating, face condition and crown settlement
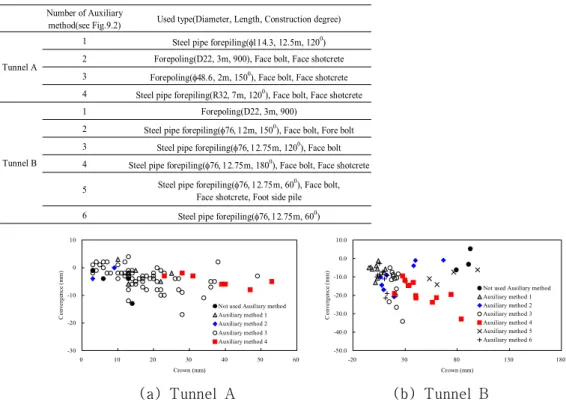
Table 1. Applied auxiliary method in A and B tunnel
Number of Auxiliary
method(see Fig.9.2) Used type(Diameter, Length, Construction degree) 1 Steel pipe forepiling(φ114.3, 12.5m, 1200) 2 Forepoling(D22, 3m, 900), Face bolt, Face shotcrete 3 Forepoling(φ48.6, 2m, 1500), Face bolt, Face shotcrete 4 Steel pipe forepiling(R32, 7m, 1200), Face bolt, Face shotcrete
1 Forepoling(D22, 3m, 900)
2 Steel pipe forepiling(φ76, 12m, 1500), Face bolt, Fore bolt 3 Steel pipe forepiling(φ76, 12.75m, 1200), Face bolt 4 Steel pipe forepiling(φ76, 12.75m, 1800), Face bolt, Face shotcrete 5 Steel pipe forepiling(φ76, 12.75m, 600), Face bolt,
Face shotcrete, Foot side pile 6 Steel pipe forepiling(φ76, 12.75m, 600) Tunnel B
Tunnel A
-30 -20 -10 0 10
0 10 20 30 40 50 60
Crown (mm)
Convergence (mm)
Not used Ausiliary method Auxiliary method 1 Auxiliary method 2 Auxiliary method 3 Auxiliary method 4
-50.0 -40.0 -30.0 -20.0 -10.0 0.0 10.0
-20 30 80 130 180
Crown (mm)
Convergence (mm)
Not used Ausiliary method Auxiliary method 1 Auxiliary method 2 Auxiliary method 3 Auxiliary method 4 Auxiliary method 5 Auxiliary method 6
(a) Tunnel A (b) Tunnel B
Fig. 9. Relation of Tunnel behavior and auxiliary method with tunnel depth
Table 1 shows the applied auxiliary method in tunnel A and B. Relation of tunnel behavior and auxiliary method is represented in Fig. 9. A relationship between the auxiliary reinforcement technique and tunnel behavior is shown in this figure. From Fig. 8 and 9, there are no strong trends in the relationship between each parameter and tunnel behavior. This indicates that more than one parameter influence the magnitude of tunnel behavior. This led to the use of ANN with the intent to relate several parameters to tunnel behavior.
5. Design and development of Artificial Neural Network model for tunnel behavior prediction
5.1 Outline of Artificial Neural Network model
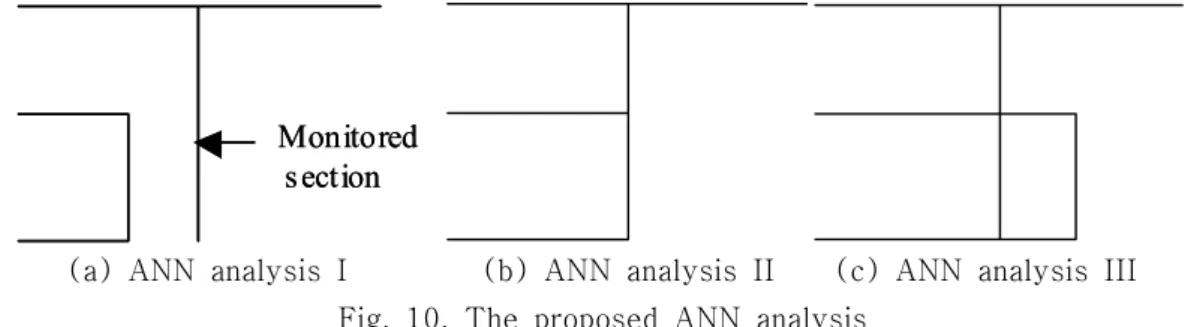
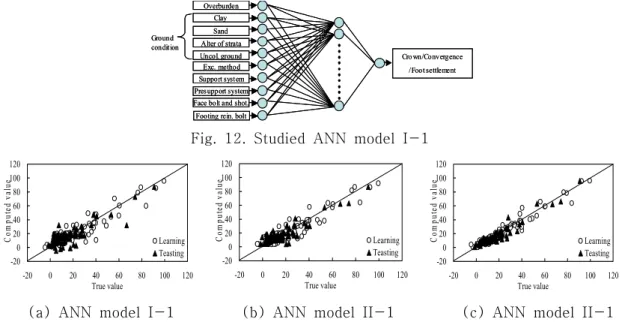
The main focus of the ANN approach is to make the prediction model of tunnel behavior through existing data. The ANN maps input vectors onto output vectors. It can be trained to map given input vectors onto respective given output vectors referred to as desired output vector. The neural network in the input layer receives tunnel geometric, ground condition, excavation method and support system, as input values. Tunnel behaviors are to be determined from output values. In this paper, ANN analysis was performed in the three categories due to tunnel excavation, as
shown in Fig. 10. Applied ANN analyses are summarized as following.
1) ANN analysis I ; Prediction of tunnel behavior using acquired data before construction (see Fig. 10 (a))
2) ANN analysis II ; Prediction of tunnel behavior using data acquired when the tunnel face arrives at monitored section (see Fig. 10 (b))
3) ANN analysis III ; Prediction of Tunnel behavior using data acquired when the tunnel face is 1D away from the monitored section (see Fig. 10 (c))
Monitored s ection Monitored
s ection
(a) ANN analysis I (b) ANN analysis II (c) ANN analysis III Fig. 10. The proposed ANN analysis
5.2 Artificial Neural Network analysis
5.2.1 Section of input and output parameters
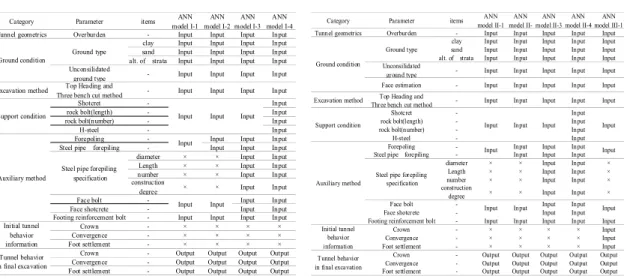
Model input parameters are tunnel overburden, ground condition, excavation method, support condition, auxiliary method. And, output parameters of model are tunnel behavior in final excavation, as shown in Table 2.
Table 2. Input variables
Category Parameter items
Tunnel geometrics Overburden -
clay sand alt. of strata Unconsilidated
ground type -
Face estimation -
Longitudinal direction Transverse
direction Excavation method Top Heading and
Three bench cut method -
Shotcret -
rock bolt(length) - rock bolt(number) -
H-steel -
Forepoling -
Steel pipe forepiling - diameter
Length number construction
degree
Face bolt -
Face shotcrete -
Footing reinforcement bolt -
Crown -
Convergence -
Foot settlement -
Crown -
Convergence -
Foot settlement -
Face Crack/fissure orientation Ground type
Ground condition
Tunnel behavior in final excavation
Initial tunnel behavior information Support condition
Auxiliary method
Steel pipe forepiling specification
Ground condition in the tunnel used for neural network input are divided into three categories: (1) ground type around tunnel face, (2) the existence of unconsolidated soil and (3) one face record rating of the total geological at the tunnel. Geology type around tunnel face is divided into clay, sandy and alt. of strata. The rating of geology characteristic at the tunnel face is calculated as according to the Japan standard specifications. The categories of 'excavation method' are divided into two categories: bench cut and three bench cut method.
Support conditions are selected in four factors as length and number of rock bolt, shotcrete and Steel beam type. Auxiliary reinforcements were especially considered because NATM tunneling method was commonly used NATM construction in non-stability ground. Five auxiliary reinforcement techniques, forepoling, steel pipe forepiling, face bolt, face shotcrete and footing reinforcement, were major methods as a countermeasure of settlement due to tunneling in Japan. Details of input and output parameters of ANN analysis and various models are shown in Tables 3 and 4. In ANN analysis I, input parameters are tunnel overburden, initially investigated ground condition, excavation method, support condition and auxiliary method, as design stage. In model I-1, support condition used as the input parameters in the logical variables, which applied to case 1 and did not apply to case 0 in ANN analysis. The input parameters of forepoling and steel pipe forepiling were used as one input variable, which was applied forepoling used as 0 and steel pipe forepiling used as 1. Input variables of steel pipe forepiling specification were not used in ANN analysis. In model I-2, the input parameters of forepoling and steel pipe forepiling were used as two input variable. In model I-3, steel pipe forepiling specifications were used as four variables in ANN analysis. In model I-4, support conditions were used as four input variable. Input parameters of ANN analysis model II included the face rating with ANN analysis model I ones, as tunnel face arrival stage. In ANN analysis model III, input parameters included the initial measure data with the ANN analysis model II.
Category Parameter items ANN
model I-1 ANN model I-2
ANN model I-3
ANN model I-4
Tunnel geometrics Overburden - Input Input Input Input
clay Input Input Input Input
sand Input Input Input Input
alt. of strata Input Input Input Input Unconsilidated
ground type - Input Input Input Input
Excavation method Top Heading and
Three bench cut method - Input Input Input Input
Shotcret - Input
rock bolt(length) - Input
rock bolt(number) - Input
H-steel - Input
Forepoling - Input Input Input
Steel pipe forepiling - Input Input Input
diameter × × Input Input
Length × × Input Input
number × × Input Input
construction
degree × × Input Input
Face bolt - Input Input
Face shotcrete - Input Input
Footing reinforcement bolt - Input Input Input Input
Crown - × × × ×
Convergence - × × × ×
Foot settlement - × × × ×
Crown - Output Output Output Output
Convergence - Output Output Output Output
Foot settlement - Output Output Output Output
Auxiliary method
Steel pipe forepiling specification
Tunnel behavior in final excavation
Initial tunnel behavior information Ground condition
Input Ground type
Input Support condition
Input
Input Input
Input
Table 3. Description of input an output parameter in ANN model I
Category Parameter items ANN
model II-1 ANN model II-
ANN model II-3
ANN model II-4
ANN model III-1
Tunnel geometrics Overburden - Input Input Input Input Input
clay Input Input Input Input Input
sand Input Input Input Input Input
alt. of strata Input Input Input Input Input Unconsilidated
ground type - Input Input Input Input Input
Excavation method Top Heading and
Three bench cut method - Input Input Input Input Input
Shotcret - Input
rock bolt(length) - Input
rock bolt(number) - Input
H-steel - Input
Forepoling - Input Input Input
Steel pipe forepiling - Input Input Input
diameter × × Input Input ×
Length × × Input Input ×
number × × Input Input ×
construction
degree × × Input Input ×
Face bolt - Input Input
Face shotcrete - Input Input
Footing reinforcement bolt - Input Input Input Input Input
Crown - × × × × Input
Convergence - × × × × Input
Foot settlement - × × × × Input
Crown - Output Output Output Output Output
Convergence - Output Output Output Output Output
Foot settlement - Output Output Output Output Output
Input
Input Input
Input
Input
Input Input
Input Input
Input Input Ground type
Input Ground condition
Input Input
Face estimation -
Support condition
Auxiliary method
Steel pipe forepiling specification
Tunnel behavior in final excavation
Initial tunnel behavior information
Table 4. Description of input an output parameter in ANN model II and III
5.2.2 Field database and data-division
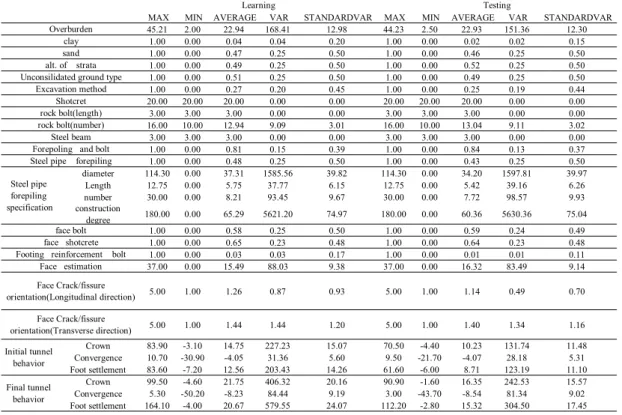
In this study, field data are obtained by two NATM tunnel in TOHOKU SHINKANSEN Project. It is a common practice to divide available data into two subsets; training set to construct a neural network model, and an independent testing set to estimate model performance in the deployed environment. Recent studies have found that the way of dividing the data can have a significant impact on the results (Takar and Johnson, 1999). ANN model is unable to extrapolate beyond the range of their training data. To develop the best possible model, which gave the available data, all patterns are contained in the data, which are needed to be included in the training set. Testing material properties were considered above comment, as the same population in training and testing data set. Statistical value of used in learning and testing were shown in Table 5. In data number, 55% of the dataset (102case) was used for training and 45% of the dataset (83cases) was used for testing of the ANN model. The statistical parameters considered in this study are average (AVE.), standard deviation (STAN.), minimum (MIN), maximum (MAX) and variation (VAR.). There are still slight differences in the statistical parameters for the training and testing sets. However, as a whole, the two data sets may be considered to represent the same population in nature.
Table 5. Statistical values of parameters
MAX MIN AVERAGE VAR STANDARDVAR MAX MIN AVERAGE VAR STANDARDVAR
45.21 2.00 22.94 168.41 12.98 44.23 2.50 22.93 151.36 12.30
1.00 0.00 0.04 0.04 0.20 1.00 0.00 0.02 0.02 0.15
1.00 0.00 0.47 0.25 0.50 1.00 0.00 0.46 0.25 0.50
1.00 0.00 0.49 0.25 0.50 1.00 0.00 0.52 0.25 0.50
1.00 0.00 0.51 0.25 0.50 1.00 0.00 0.49 0.25 0.50
1.00 0.00 0.27 0.20 0.45 1.00 0.00 0.25 0.19 0.44
20.00 20.00 20.00 0.00 0.00 20.00 20.00 20.00 0.00 0.00
3.00 3.00 3.00 0.00 0.00 3.00 3.00 3.00 0.00 0.00
16.00 10.00 12.94 9.09 3.01 16.00 10.00 13.04 9.11 3.02
3.00 3.00 3.00 0.00 0.00 3.00 3.00 3.00 0.00 0.00
1.00 0.00 0.81 0.15 0.39 1.00 0.00 0.84 0.13 0.37
1.00 0.00 0.48 0.25 0.50 1.00 0.00 0.43 0.25 0.50
diameter 114.30 0.00 37.31 1585.56 39.82 114.30 0.00 34.20 1597.81 39.97
Length 12.75 0.00 5.75 37.77 6.15 12.75 0.00 5.42 39.16 6.26
number 30.00 0.00 8.21 93.45 9.67 30.00 0.00 7.72 98.57 9.93
construction
degree 180.00 0.00 65.29 5621.20 74.97 180.00 0.00 60.36 5630.36 75.04
1.00 0.00 0.58 0.25 0.50 1.00 0.00 0.59 0.24 0.49
1.00 0.00 0.65 0.23 0.48 1.00 0.00 0.64 0.23 0.48
1.00 0.00 0.03 0.03 0.17 1.00 0.00 0.01 0.01 0.11
37.00 0.00 15.49 88.03 9.38 37.00 0.00 16.32 83.49 9.14
5.00 1.00 1.26 0.87 0.93 5.00 1.00 1.14 0.49 0.70
5.00 1.00 1.44 1.44 1.20 5.00 1.00 1.40 1.34 1.16
Crown 83.90 -3.10 14.75 227.23 15.07 70.50 -4.40 10.23 131.74 11.48
Convergence 10.70 -30.90 -4.05 31.36 5.60 9.50 -21.70 -4.07 28.18 5.31
Foot settlement 83.60 -7.20 12.56 203.43 14.26 61.60 -6.00 8.71 123.19 11.10
Crown 99.50 -4.60 21.75 406.32 20.16 90.90 -1.60 16.35 242.53 15.57
Convergence 5.30 -50.20 -8.23 84.44 9.19 3.00 -43.70 -8.54 81.34 9.02
Foot settlement 164.10 -4.00 20.67 579.55 24.07 112.20 -2.80 15.32 304.50 17.45
Steel beam rock bolt(number)
Final tunnel behavior
Face Crack/fissure orientation(Transverse direction)
Face Crack/fissure orientation(Longitudinal direction)
Face estimation Excavation method
Shotcret rock bolt(length)
Initial tunnel behavior
Footing reinforcement bolt face shotcrete
face bolt Steel pipe forepiling specification
Steel pipe forepiling Forepoling and bolt
clay sand alt. of strata Unconsilidated ground type
Learning Testing
Overburden
5.2.3 Data pre-processing
After data division, it is important to pre-process the data to a suitable form before they are brought in to an ANN making procedure. Pre-processing the data, such as scaling, is important to ensure that all variables receive equal attention during training. The output variables have to be scaled to be commensurate with the limits of the transfer functions used in the output layer. Scaling the input variables is not necessary but is always recommended (Hassoum, 1993).
(2)
where Xnew is the normalized value ; X is original value ; Xmax is the maximum value of all data; and Xmin is the minimum of all data. The input and output variables are scaled between 0.1 and 0.9, as the sigmoid transfer function is used in the output layer.
5.2.4 Used Artificial Neural Network architectures and parameters
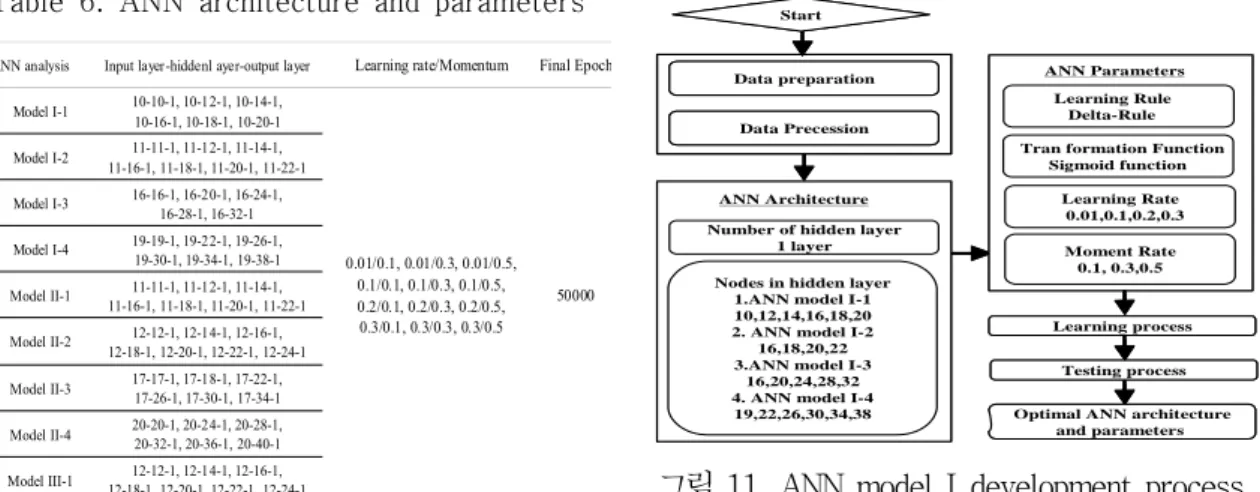
Despite its versatility, BPNN often faces shape criticism about the high computation for net work training and failure to guarantee its convergence (Suwansawat and Einstein, 2006). Generally, there is no direction and precise method for determining the most appropriate architecture and parameters for the selection of ANN model, although some guide lines are proposed (Hagazy et al., 1994). Trial and error method is the only way to arrive at a suitable learning rate, momentum, number of training cycle and the optimal numbers of hidden node or hidden layer with the criterion error (Neaupane and Adhikari, 2006). Baheer (2000) and Hect-Neilsen (1987) indicated that one hidden layer may be sufficient for most problems. Lippmann (1987) and Rumelhart et al.(1986) indicated that there is rarely an advantage in using more than one hidden layer. Therefore, one hidden layer was preferred in this study. The determination of the number of hidden node is the most critical task in determining ANN structure. Kannellopoulas and Wilkinson (1997) proposed that it be 2 times the number of input nodes. In this study, the number of neurons in hidden layers varies from 1 to 2 times the number of input nodes. The initial weights are generally set as random small values. Rumelhart et al.(1986) and American Society of Civil Engineers (ASCE, 2000) proposed between -0.3 and 0.3. Looney (1987) recommend between -0.5 and 0.5. In this study, the initial weight range was selected as between -0.1 and 1.0. Learning rate was set 0.01, 0.1, 0.2 and 0.3. The momentum has a stabilizing effect in the BPNN algorithm (Negnevitsky, 2002). Wyhthoff (1983) set the momentum between 0.4 and 0.9 and Hassoun (1995) suggested that it should be 0.0 to 1.0. This study chose it to be 0.1, 0.3 and 0.5. For two section, ANN architectures and parameters are
shown in Table 6. The development process of ANN model I is shown in Fig. 11.
ANN analysis Input layer-hiddenl ayer-output layer Learning rate/Momentum Final Epoch Model I-1 10-10-1, 10-12-1, 10-14-1,
10-16-1, 10-18-1, 10-20-1
Model I-2 11-11-1, 11-12-1, 11-14-1, 11-16-1, 11-18-1, 11-20-1, 11-22-1
Model I-3 16-16-1, 16-20-1, 16-24-1, 16-28-1, 16-32-1
Model I-4 19-19-1, 19-22-1, 19-26-1, 19-30-1, 19-34-1, 19-38-1
Model II-1 11-11-1, 11-12-1, 11-14-1, 11-16-1, 11-18-1, 11-20-1, 11-22-1
Model II-2 12-12-1, 12-14-1, 12-16-1, 12-18-1, 12-20-1, 12-22-1, 12-24-1
Model II-3 17-17-1, 17-18-1, 17-22-1, 17-26-1, 17-30-1, 17-34-1
Model II-4 20-20-1, 20-24-1, 20-28-1, 20-32-1, 20-36-1, 20-40-1
Model III-1 12-12-1, 12-14-1, 12-16-1, 12-18-1, 12-20-1, 12-22-1, 12-24-1
0.01/0.1, 0.01/0.3, 0.01/0.5, 0.1/0.1, 0.1/0.3, 0.1/0.5, 0.2/0.1, 0.2/0.3, 0.2/0.5, 0.3/0.1, 0.3/0.3, 0.3/0.5
50000
Table 6. ANN architecture and parameters
Start
ANN Architecture Number of hidden layer
1 layer
Nodes in hidden layer 1.ANN model I-1 10,12,14,16,18,20 2. ANN model I-2 16,18,20,22 3.ANN model I-3
16,20,24,28,32 4. ANN model I-4 19,22,26,30,34,38
ANN Parameters Learning Rule
Delta-Rule
Tran formation Function Sigmoid function
Learning Rate 0.01,0.1,0.2,0.3
Moment Rate 0.1, 0.3,0.5
Learning process
Optimal ANN architecture and parameters Data preparation
Data Precession
Testing process Start
ANN Architecture Number of hidden layer
1 layer
Nodes in hidden layer 1.ANN model I-1 10,12,14,16,18,20 2. ANN model I-2 16,18,20,22 3.ANN model I-3
16,20,24,28,32 4. ANN model I-4 19,22,26,30,34,38
ANN Parameters Learning Rule
Delta-Rule
Tran formation Function Sigmoid function
Learning Rate 0.01,0.1,0.2,0.3
Moment Rate 0.1, 0.3,0.5
Learning process
Optimal ANN architecture and parameters Data preparation
Data Precession
Testing process
그림 11. ANN model I development process
5.2.5 Learning process and convergence criterion
Process of optimizing the connection weight and bias is known as training or learning process. The aim is to find a global solution to what is typically a highly non-linear optimization problem. ANN analysis most commonly used for finding optimum weights is BPNN algorithm (Basheer and Hajmeer, 2000). Back-propagation of errors is called an epoch. The iteration step corresponds to an epoch number. In this paper, the convergence criteria are set such that the learning process is terminated when either of the following two conditions ; 1) Number of training cycles (Epoch) becomes 400,000, and 2) Error of the network becomes less than 0.0001. ANN analysis for learning process was performed an IBM-compatible Pentium 4 class machine (598MHz, 248MB RAM). Learning took about 6 hours for 600 thousand cycle.
5.2.6 Testing process and model validation
Once the training of a model has been successfully accomplished, performance of the trained model is validated using the testing data, which have not been used as the part of model building process. Testing result is used for the selection of an optimal ANN model. Representative indices that are needed to evaluate the quality of testing results are the following 2 indices; the root mean square error (RMSE)) and coefficient of determination, R2.
(3)
(4)