http://e-nrp.org
The cross-sectional relationship between dietary calcium intake and metabolic syndrome among men and women aged 40 or older in rural areas of Korea
Song Kyoung Shin
1,2, Mi Kyung Kim
1,2§, Young-Hoon Lee
3, Dong Hoon Shin
4, Min-Ho Shin
5, Byung-Yeol Chun
6and Bo Youl Choi
1,21Department of Preventive Medicine, College of Medicine, Hanyang Unviersity, 222 Wangsimni-ro, Seoul 133-791, Korea
2Institute for Health and Society, Hanyang University, Seoul 133-791, Korea
3Department of Preventive Medicine, Institute of Wonkwang Medical Science, Wonkwang University School of Medicine, Iksan, Jeonbuk 570-794, Korea
4Department of Preventive Medicine, Keimyung University Dongsan Medical Center, Daegu 705-701, Korea
5Department of Preventive Medicine, Chonnam National University Medical School, Gwangju 501-757, Korea
6Department of Preventive Medicine, School of Medicine, and Health Promotion Research Center, Kyungpook National University, Daegu 702-701, Korea
BACKGROUND/OBJECTIVES: Studies conducted in Western populations have suggested that dietary calcium may protect against metabolic abnormalities, but there is little evidence of this effect in Asians, who have relatively low calcium intake. We evaluated the cross-sectional relationship between dietary calcium and metabolic syndrome among Korean men and women aged 40 years and over.
SUBJECTS/METHODS: A total of 6,375 subjects aged 40 years and over and were recruited between January 2005 and February 2010 from the baseline study of the Multi-Rural Communities Cohort Study in Rural Communities (MRCohort). A food frequency questionnaire was used to collect dietary information. Metabolic syndrome was defined using the modified criteria published in the Third Report of the National Cholesterol Education Program Adult Treatment Panel.
RESULTS: Calcium intake was related inversely to metabolic syndrome in women (P-value = 0.0091), but not in men (P = 0.1842).
Among metabolic components, high waist circumference (WC) (P = 0.0426) and high blood glucose (P = 0.0027) in women and hypertriglyceridemia (P = 0.0017) in men were inversely correlated with calcium intake. Excluding those who used calcium or multinutrient supplements did not attenuate the relationship between dietary calcium and metabolic abnormalities.
CONCLUSION: Dietary calcium intake from foods may be inversely related to metabolic syndrome, WC, and blood glucose among women in rural areas of Korea.
Nutrition Research and Practice 2015;9(3):328-335; doi:10.4162/nrp.2015.9.3.328; pISSN 1976-1457 eISSN 2005-6168
Keywords: Calcium Intake, milk, metabolic syndrome, Koreans
INTRODUCTION
*Metabolic syndrome is defined by a cluster of clinical features including obesity, dyslipidemia, hypertension, and insulin resis- tance [1] and it is a well-known risk factor for type 2 diabetes and cardiovascular diseases (CVD) [2].
The development of metabolic syndrome is influenced by genetic, metabolic, and environmental factors including diet [3].
However, the role of diet in the progression of metabolic syndrome is poorly understood and most researches have focused on fat [4]. A growing body of epidemiologic research suggests that calcium [5-7] may have beneficial effects against metabolic syndrome, but findings were not consistent [8,9]. The effect of dietary calcium on metabolic syndrome could be partially mediated by body fat, blood pressure (BP), and insulin
sensitivity [10,11]. A recent study in the United States suggested that various dairy products may have differential associations with metabolic disorders and that ethnic differences in dairy consumption may explain some ethnic disparities in metabolic disorders [8]. In many Asian countries, milk and dairy products, which are major dietary calcium sources, are not commonly used in traditional foods [12], possibly due to the high preva- lence of lactose intolerance [13]. Thus, Asian populations have a relatively low calcium intake compared to Western popula- tions [13,14]. Most previous studies on the association between calcium and metabolic syndrome have been conducted in Western populations, with only limited evidence in Asian populations, despite a steadily increasing prevalence of meta- bolic syndrome over the past decade [15].
The present study examines the cross-sectional relationship
This study was supported by the Korea Centers for Disease Control and Prevention (grants 2004-E71004-00, 2005-E71011-00, 2006-E71009-00, 2007-E71002-00, 2008-E71004-00, and 2009-E71006-00). There were no potential conflicts of interest relevant to this article.
§Corresponding Author: Mi Kyung Kim, Tel. 82-2-2220-0667, Fax. 82-2-2293-0660, Email. [email protected] Received: July 3, 2014, Revised: January 14, 2015, Accepted: January 15, 2015
This is an Open Access article distributed under the terms of the Creative Commons Attribution Non-Commercial License (http://creativecommons.org/licenses/by-nc/3.0/) which permits unrestricted non-commercial use, distribution, and reproduction in any medium, provided the original work is properly cited.
between calcium and the risk of metabolic syndrome in middle- aged and elderly populations in the Multi-Rural communities Cohort study (MRCohort) in South Korea whose calcium intake is relatively low.
SUBJECTS AND METHODS
Study populationStudy subjects were participants of the Multi-Rural Comm- unities Cohort Study in Rural Communities (MRCohort) to identify risk factors for CVD as part of the Korean Genomic Epidemiology Study (KoGES). A total of 9,696 subjects aged ≥
40 years were recruited from three centers located in Yangpyeong, Namwon and Goryeong between January 2005 and February 2010. Among these 9,696 subjects, those who did not complete the food frequency questionnaire were excluded (n = 76). Subjects were also excluded if they had myocardial infarction (n = 607), stroke (n = 334), cancer (n = 224) or non- response to medical history (n = 3); or if they had taken medicine for hypertension (n = 1,754) or diabetes (n = 578); or had hyperlipidemia (n = 148). In addition, subjects were excluded if their records were missing data related to BP or metabolic syndrome (n = 12). Thus, a total of 6,375 subjects (2,491 men, 3,884 women) were used in the final analyses. This study was conducted in accordance with the Declaration of Helsinki and the protocol was approved by the Institutional Review Boards (IRB) of Hanyang University (HYUH 2005-15, 2006-32, 2007-04, 2008-09), Chonnam National University Hospital (CNUH 06-062) and Keimyung University (KU 06-40, 07-39, 09-50). Written informed consent was obtained from all subjects.
General characteristics, anthropometrics and biochemical variables
Data were collected using standard protocols for a ques- tionnaire and for each examination procedure including mea- surements of anthropometry, clinical examination, and blood sampling to overcome the limitations of the multicenter studies.
All interviewers and technicians were trained with the same protocol by the same trainers from the coordinating center.
The structured questionnaire was administered by trained interviewers and included information on demographics (age, sex, education, occupation, marital status, and income), smoking habits, alcohol intake, exercise, medical history and female reproductive history (menopause, oral contraceptive use). Height was measured with a standard height scale to the nearest 0.1 cm and weight was measured with a metric weight scale to the nearest 0.01 kg while the subjects were wearing light clothing without shoes. Body mass index (BMI) was calculated as weight (kg) / height (m
2) and waist circumference (WC) was measured at the smallest horizontal trunk circumference between the lowest rib margin and the iliac crest. BP was measured from the right arm by auscultation using a standard sphygmomanometer and a standard cuff after each subject had been sitting for at least 5 min. Systolic blood pressure (SBP) and diastolic blood pressure (DBP) measurements were recorded to the nearest 2 mmHg. If two systolic or diastolic BPs differed by more than 5 mmHg, an additional measurement was performed, and the mean value of the closest two measure- ments was used.
Blood samples were collected to measure plasma total cholesterol, triglyceride, fasting blood glucose and HDL- cholesterol after at least ≥ 8 hr of fasting. Triglyceride, fasting blood glucose and Total and HDL-cholesterol were analyzed by the ADVIA1650 Automatic Analyzer (Siemens, New York, NY, USA). LDL-cholesterol was calculated as described by Friedewald
et al. [16], unless triglyceride concentrations were above 400mg/dl.
Definition of metabolic syndrome
Metabolic syndrome was defined using modified criteria proposed by the Third Report of the National Cholesterol Education Program Adult Treatment Panel. Subjects were diagnosed with metabolic syndrome if they met three of the following five criteria: WC ≥ 90 cm in men and ≥ 85 cm in women [17], triacylglycerol ≥ 150 mg/dL, HDL cholesterol < 40 mg/dL in men and < 50 mg/dL in women, SBP and DBP ≥ 130/85 mmHg or antihypertensive treatment, and fasting blood glucose ≥ 100 mg/dL or treatment of type 2 diabetes [18].
Dietary measurements
Dietary intake was assessed with a semi-quantitative food frequency questionnaire (FFQ) that asked each participant to provide his or her usual intake of 106 food items during the previous year. The FFQ consisted of a list of foods with three portion sizes and nine frequency categories ranging from ‘never or rare’ to ‘3 times/d’. For food items with different seasonal availability, participants were also asked to estimate how many months out of the year (3, 6, 9, or 12 months) they had eaten each seasonal food. The validity and reproducibility of the FFQ has been reported in detail elsewhere [19]. Nutrient intake and food intake were calculated by weighted frequency per day and portion size per unit in each food item. The Food Composition Table of Korean Nutrition Society was used as the nutrient database [20]. Total calcium intake was estimated by totaling calcium intake derived from all food items. All nutrient intakes were adjusted for total energy intake by the residual method.
Statistical analysis
All data were analyzed separately for men and women.
Subjects were categorized into quartiles by relative intake of
dietary calcium. General characteristics of subjects according to
calcium intake were assessed using the general linear model
for continuous variables and the Cochran-Mantel-Haenszel analysis
for categorical variables. Age and variables with significantly
different means or distributions according to calcium intake
quartiles were considered potential confounders in multiva-
riable models. Multiple logistic regression models were used to
evaluate odds ratios (ORs) and corresponding 95% confidence
intervals (CIs) for metabolic syndrome according to each category
of calcium, compared with the lowest intake as a reference
group. The test of linear trend was conducted by assigning the
median values of the quartiles of calcium as a continuous
variable. Multiple logistic regression modeling and linear trend
tests were repeated after excluding those who used calcium
and supplements to address the potential effects of those
supplements. All statistical analyses were performed with SAS
software (Version 9.2; SAS Institute Inc).
Characteristics Men (n = 2,491)
Women (n = 3,884)
Age (yrs) 61.5 ± 9.8 59.7 ± 10.0
Education (≥ High-school, %) 28.4 15.8
Farmer (%) 64.3 49.6
Married (%) 94.2 75.6
Regular exercise (≥ 22.5 MET-h/week, %)1) 27.3 21.4
BMI (kg/m2) 23.7 ± 3.0 24.2 ± 3.2
Current smoker (%) 37.8 3.6
Current drinker (%) 66.8 32.4
Alcohol consumption (g/d) 30.3 ± 56.7 2.6 ± 12.4
Hormonal factors (women only)
Menopause (yes, %) - 80.2
Oral contraceptive use (yes, %) - 0.31
Total cholesterol (mg/dL) 192.1 ± 35.0 204.5 ± 36.4
LDL cholesterol (mg/dL) 117.9 ± 31.4 131.3 ± 32.2
Daily dietary intake
Total energy (kcal) 1,729.5 ± 508.7 1,508.9 ± 437.6
Carbohydrate (g) 307.1 ± 32.2 278.6 ± 28.0
Protein (g) 50.5 ± 9.4 42.3 ± 8.1
Fat (g) 21.8 ± 8.9 15.3 ± 7.3
Fiber (g) 5.0 ± 1.9 4.7 ± 1.8
Cholesterol (mg) 122.7 ± 93.4 93.2 ± 82.8
Sodium (mg) 2,658.5 ± 1293.7 2,199.2 ± 1182.4
Potassium(mg) 1,915.1 ± 609.7 1,725.0 ± 617.6
Calcium(mg) 351.3 ± 161.6 331.0 ± 162.7
Glycemic load 178.7 ± 22.4 162.1 ± 21.0
Calcium supplement use (%) 0.6 4.2
Multinutrient supplement use (%) 10.1 11.0
Metabolic syndrome components
Waist circumference (cm) 84.7 ± 8.2 82.5 ± 9.0
Triglyceride (mg/dL) 159.0 ± 117.4 139.3 ± 82.8
HDL cholesterol (mg/dL) 44.4 ± 11.7 45.9 ± 10.3
SBP (mmHg) 124.9 ± 16.6 121.8 ± 18.0
DBP (mmHg) 80.1 ± 10.4 77.7 ± 10.2
Fasting glucose (mg/dL) 100.6 ± 22.3 95.6 ± 15.3 Values are expressed as mean ± SD or percentage. All nutrient intakes were adjusted for total energy intake (kcal/d) by the residual method.
1)MET, metabolic equivalent
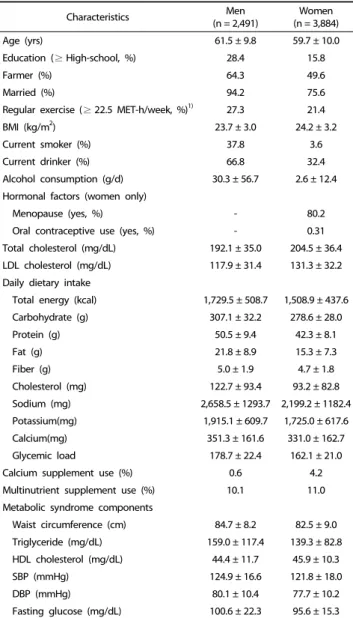
Table 1. General characteristics of study subjects
RESULTS
General characteristics of the study population
General characteristics of study subjects are shown in Table 1. The mean ages of men and women were 61.5 years and 59.7 years, respectively. A greater proportion of men was farmers, was married, was highly educated, and regularly exercised compared with women. Also, the proportions of current smokers and current drinkers were higher in men than in women. Mean WC was higher in men than in women, whereas BMI was higher in women than in men. Mean fasting glucose, triglyceride, SBP, and DBP were higher in men than in women, whereas total cholesterol, LDL cholesterol and HDL cholesterol were higher in women than men. All daily dietary intakes were higher in men than women. Average daily intake of energy-adjusted calcium for men and women were 351.3
mg/d and 331.0 mg/d, respectively. The proportion of calcium supplement users was low, 0.6% of men and 4.2 % of women, while multinutrient supplement users accounted for 10.1% and 11.0% of these study populations, respectively.
The potential confounders of the relationship between calcium intake and metabolic abnormalities
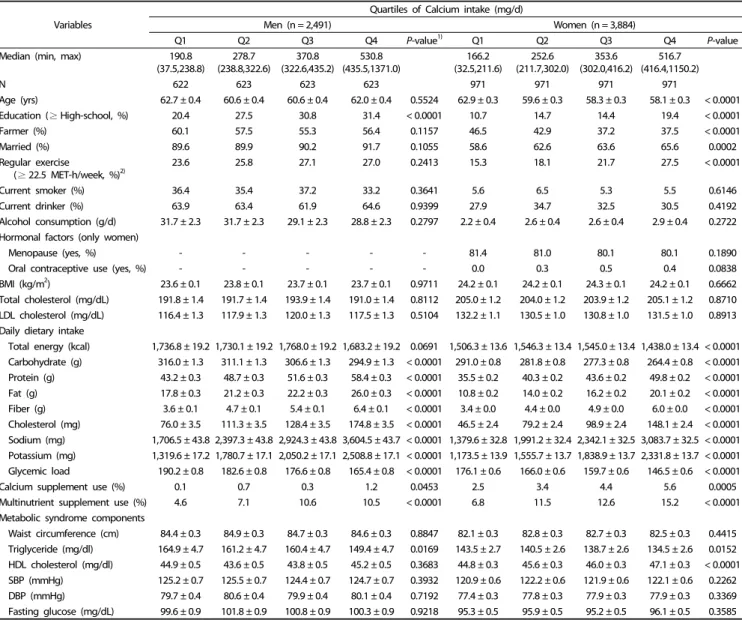
Age-adjusted proportions and averages of potential confo- unders according to quartiles of calcium intake are shown in Table 2. Men with high calcium intake tended to be more highly educated (≥ high school). Women with high calcium intake tended to be younger, highly educated, married, and exercise more, but were less likely to be farmers. The likelihood of calcium and multinutrient supplement use was likely to increase by calcium intake quartile among both men and women. Intake of protein, fat, fiber, cholesterol, sodium, and potassium increased linearly across the quartiles of calcium intake, while total energy, carbohydrate and glycemic load tended to decrease by calcium intake quartile.
The relationships of metabolic abnormalities with dietary calcium
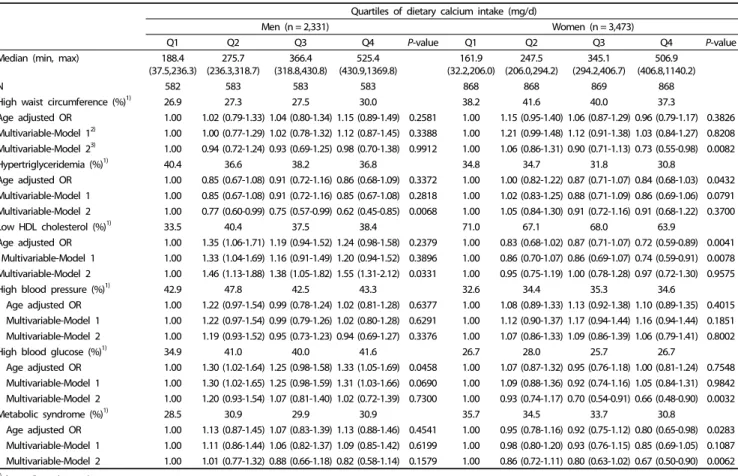
Age-adjusted and multivariable-adjusted ORs of metabolic abnormalities are shown in Table 3. In women, dietary calcium intake was inversely related to metabolic syndrome after adjusting for potential confounders in the multivariable model 2 (4
thV. 1
stquartile, OR = 0.71, 95% CI: 0.54-0.94, P-value = 0.0091) as well as in an age-adjusted model. These findings were not observed in men (4
thV. 1
stquartile, OR = 0.82, 95% CI:
0.60-1.14, P-value = 0.1842). In terms of individual metabolic abnormalities among women, dietary calcium intake was inversely related to blood glucose (4
thV. 1
stquartile, OR = 0.69, 95% CI: 0.51-0.92, P-value = 0.0027) and larger WC (4
thV. 1
stquartile, OR = 0.81, 95% CI: 0.62-1.06, P-value = 0.0426). Although there was no significant relationship between dietary calcium intake and metabolic syndrome and the inverse relationship with triglyceride was found (4
thV. 1
stquartile, OR = 0.58, 95%
CI: 0.43-0.79, P-value = 0.0017) in men. However, dietary calcium was positively correlated to low HDL cholesterol among men (4
thV. 1
stquartile, OR = 1.61, 95% CI: 1.18-2.18, P-value = 0.0158).
Excluding calcium and multinutrient supplement users did not substantially attenuate the relationship between dietary calcium intake from foods and metabolic abnormalities in the remainder of the population (Table 4).
DISCUSSION
The present study found that calcium intake was inversely related to metabolic syndrome, WC, and blood glucose in women and triglyceride in men.
Mean calcium intake in the present study was 351.3 ± 161.6 mg and 331.0 ± 162.7 mg for men and women, respectively, which is lower than mean calcium intake in Americans (986.3
± 12.0 mg for men, 752.4 ± 9.9 mg for women) [8], Europeans
(909.0 ± 329.0 mg for men, 830 ± 308.0 mg for women) [21],
and even the general population in Korea (584.1 ± 7.7 mg for
men, 474.9 ± 6.7 mg for women) [14]. The distribution of
calcium intake (37.5 mg/d to 1,371.0 mg/d in men and 32.5
to 1,150.2 mg/d in women) was shifted to the low intake
Variables
Quartiles of Calcium intake (mg/d)
Men (n = 2,491) Women (n = 3,884)
Q1 Q2 Q3 Q4 P-value1) Q1 Q2 Q3 Q4 P-value
Median (min, max) 190.8
(37.5,238.8) 278.7
(238.8,322.6) 370.8
(322.6,435.2) 530.8
(435.5,1371.0) 166.2
(32.5,211.6) 252.6
(211.7,302.0) 353.6
(302.0,416.2) 516.7 (416.4,1150.2)
N 622 623 623 623 971 971 971 971
Age (yrs) 62.7 ± 0.4 60.6 ± 0.4 60.6 ± 0.4 62.0 ± 0.4 0.5524 62.9 ± 0.3 59.6 ± 0.3 58.3 ± 0.3 58.1 ± 0.3 < 0.0001
Education (≥ High-school, %) 20.4 27.5 30.8 31.4 < 0.0001 10.7 14.7 14.4 19.4 < 0.0001
Farmer (%) 60.1 57.5 55.3 56.4 0.1157 46.5 42.9 37.2 37.5 < 0.0001
Married (%) 89.6 89.9 90.2 91.7 0.1055 58.6 62.6 63.6 65.6 0.0002
Regular exercise
(≥ 22.5 MET-h/week, %)2) 23.6 25.8 27.1 27.0 0.2413 15.3 18.1 21.7 27.5 < 0.0001
Current smoker (%) 36.4 35.4 37.2 33.2 0.3641 5.6 6.5 5.3 5.5 0.6146
Current drinker (%) 63.9 63.4 61.9 64.6 0.9399 27.9 34.7 32.5 30.5 0.4192
Alcohol consumption (g/d) 31.7 ± 2.3 31.7 ± 2.3 29.1 ± 2.3 28.8 ± 2.3 0.2797 2.2 ± 0.4 2.6 ± 0.4 2.6 ± 0.4 2.9 ± 0.4 0.2722 Hormonal factors (only women)
Menopause (yes, %) - - - 81.4 81.0 80.1 80.1 0.1890
Oral contraceptive use (yes, %) - - - 0.0 0.3 0.5 0.4 0.0838
BMI (kg/m2) 23.6 ± 0.1 23.8 ± 0.1 23.7 ± 0.1 23.7 ± 0.1 0.9711 24.2 ± 0.1 24.2 ± 0.1 24.3 ± 0.1 24.2 ± 0.1 0.6662 Total cholesterol (mg/dL) 191.8 ± 1.4 191.7 ± 1.4 193.9 ± 1.4 191.0 ± 1.4 0.8112 205.0 ± 1.2 204.0 ± 1.2 203.9 ± 1.2 205.1 ± 1.2 0.8710 LDL cholesterol (mg/dL) 116.4 ± 1.3 117.9 ± 1.3 120.0 ± 1.3 117.5 ± 1.3 0.5104 132.2 ± 1.1 130.5 ± 1.0 130.8 ± 1.0 131.5 ± 1.0 0.8913 Daily dietary intake
Total energy (kcal) 1,736.8 ± 19.2 1,730.1 ± 19.2 1,768.0 ± 19.2 1,683.2 ± 19.2 0.0691 1,506.3 ± 13.6 1,546.3 ± 13.4 1,545.0 ± 13.4 1,438.0 ± 13.4 < 0.0001 Carbohydrate (g) 316.0 ± 1.3 311.1 ± 1.3 306.6 ± 1.3 294.9 ± 1.3 < 0.0001 291.0 ± 0.8 281.8 ± 0.8 277.3 ± 0.8 264.4 ± 0.8 < 0.0001 Protein (g) 43.2 ± 0.3 48.7 ± 0.3 51.6 ± 0.3 58.4 ± 0.3 < 0.0001 35.5 ± 0.2 40.3 ± 0.2 43.6 ± 0.2 49.8 ± 0.2 < 0.0001 Fat (g) 17.8 ± 0.3 21.2 ± 0.3 22.2 ± 0.3 26.0 ± 0.3 < 0.0001 10.8 ± 0.2 14.0 ± 0.2 16.2 ± 0.2 20.1 ± 0.2 < 0.0001 Fiber (g) 3.6 ± 0.1 4.7 ± 0.1 5.4 ± 0.1 6.4 ± 0.1 < 0.0001 3.4 ± 0.0 4.4 ± 0.0 4.9 ± 0.0 6.0 ± 0.0 < 0.0001 Cholesterol (mg) 76.0 ± 3.5 111.3 ± 3.5 128.4 ± 3.5 174.8 ± 3.5 < 0.0001 46.5 ± 2.4 79.2 ± 2.4 98.9 ± 2.4 148.1 ± 2.4 < 0.0001 Sodium (mg) 1,706.5 ± 43.8 2,397.3 ± 43.8 2,924.3 ± 43.8 3,604.5 ± 43.7 < 0.0001 1,379.6 ± 32.8 1,991.2 ± 32.4 2,342.1 ± 32.5 3,083.7 ± 32.5 < 0.0001 Potassium (mg) 1,319.6 ± 17.2 1,780.7 ± 17.1 2,050.2 ± 17.1 2,508.8 ± 17.1 < 0.0001 1,173.5 ± 13.9 1,555.7 ± 13.7 1,838.9 ± 13.7 2,331.8 ± 13.7 < 0.0001 Glycemic load 190.2 ± 0.8 182.6 ± 0.8 176.6 ± 0.8 165.4 ± 0.8 < 0.0001 176.1 ± 0.6 166.0 ± 0.6 159.7 ± 0.6 146.5 ± 0.6 < 0.0001
Calcium supplement use (%) 0.1 0.7 0.3 1.2 0.0453 2.5 3.4 4.4 5.6 0.0005
Multinutrient supplement use (%) 4.6 7.1 10.6 10.5 < 0.0001 6.8 11.5 12.6 15.2 < 0.0001
Metabolic syndrome components
Waist circumference (cm) 84.4 ± 0.3 84.9 ± 0.3 84.7 ± 0.3 84.6 ± 0.3 0.8847 82.1 ± 0.3 82.8 ± 0.3 82.7 ± 0.3 82.5 ± 0.3 0.4415 Triglyceride (mg/dl) 164.9 ± 4.7 161.2 ± 4.7 160.4 ± 4.7 149.4 ± 4.7 0.0169 143.5 ± 2.7 140.5 ± 2.6 138.7 ± 2.6 134.5 ± 2.6 0.0152 HDL cholesterol (mg/dl) 44.9 ± 0.5 43.6 ± 0.5 43.8 ± 0.5 45.2 ± 0.5 0.3683 44.8 ± 0.3 45.6 ± 0.3 46.0 ± 0.3 47.1 ± 0.3 < 0.0001 SBP (mmHg) 125.2 ± 0.7 125.5 ± 0.7 124.4 ± 0.7 124.7 ± 0.7 0.3932 120.9 ± 0.6 122.2 ± 0.6 121.9 ± 0.6 122.1 ± 0.6 0.2262 DBP (mmHg) 79.7 ± 0.4 80.6 ± 0.4 79.9 ± 0.4 80.1 ± 0.4 0.7192 77.4 ± 0.3 77.8 ± 0.3 77.9 ± 0.3 77.9 ± 0.3 0.3369 Fasting glucose (mg/dL) 99.6 ± 0.9 101.8 ± 0.9 100.8 ± 0.9 100.3 ± 0.9 0.9218 95.3 ± 0.5 95.9 ± 0.5 95.2 ± 0.5 96.1 ± 0.5 0.3585 Values are expressed as mean ± SD or percentage. All nutrient intakes were adjusted for total energy intake (kcal/d) by the residual method.
1)P-values for the linear trends were determined by Cochran-Mantel-Haenzel for categorical variables and by general linear model for continuous variables after adjustment for age.
2)MET, metabolic equivalent
Table 2. Age-adjusted characteristics of selected factors according to quartiles of dietary calcium intake from foods
Quartiles of dietary calcium intake (mg/d)
Men (n = 2,491) Women (n = 3,884)
Q1 Q2 Q3 Q4 P-value Q1 Q2 Q3 Q4 P-value
Median (min, max) 190.8
(37.5,238.8) 278.7 (238.8,322.6)
370.8 (322.6,435.2)
530.8 (435.5,1371.0)
166.2 (32.5,211.6)
252.6 (211.7,302.0)
353.6 (302.0,416.2)
516.7 (416.4,1150.2)
N 622 623 623 623 971 971 971 971
High waist circumference (%)1) 27.2 27.2 27.4 28.0 38.0 41.0 40.0 38.4
Age adjusted OR 1.00 1.00 (0.78-1.28) 1.01 (0.79-1.30) 1.04 (0.81-1.34) 0.7061 1.00 1.14 (0.95-1.37) 1.08 (0.90-1.30) 1.02 (0.85-1.23) 0.8603 Multivariable-Model 12) 1.00 0.97 (0.75-1.25) 1.00 (0.78-1.29) 1.02 (0.79-1.31) 0.8261 1.00 1.22 (1.01-1.47) 1.16 (0.95-1.40) 1.10 (0.91-1.34) 0.6168 Multivariable-Model 23) 1.00 0.91 (0.69-1.18) 0.89 (0.67-1.18) 0.85 (0.61-1.19) 0.3992 1.00 1.08 (0.88-1.32) 0.95 (0.76-1.18) 0.81 (0.62-1.06) 0.0426
Hypertriglyceridemia (%)1) 40.1 36.3 37.9 36.5 34.8 34.9 30.0 30.8
Age adjusted OR 1.00 0.82 (0.65-1.03) 0.88 (0.70-1.11) 0.83 (0.66-1.04) 0.2066 1.00 1.01 (0.84-1.22) 0.80 (0.66-0.97) 0.83 (0.69-1.01) 0.0193 Multivariable-Model 1 1.00 0.82 (0.65-1.03) 0.88 (0.70-1.11) 0.81 (0.65-1.03) 0.1685 1.00 1.01 (0.83-1.23) 0.81 (0.66-0.99) 0.85 (0.69-1.04) 0.0353 Multivariable-Model 2 1.00 0.73 (0.57-0.93) 0.72 (0.55-0.93) 0.58 (0.43-0.79) 0.0017 1.00 1.02 (0.83-1.25) 0.82 (0.65-1.03) 0.86 (0.65-1.14) 0.1495 Table 3. ORs and 95% CI of metabolic syndrome and its components according to quartiles of dietary calcium intake from foods
Quartiles of dietary calcium intake (mg/d)
Men (n = 2,331) Women (n = 3,473)
Q1 Q2 Q3 Q4 P-value Q1 Q2 Q3 Q4 P-value
Median (min, max) 188.4
(37.5,236.3) 275.7
(236.3,318.7) 366.4
(318.8,430.8) 525.4
(430.9,1369.8) 161.9
(32.2,206.0) 247.5
(206.0,294.2) 345.1
(294.2,406.7) 506.9 (406.8,1140.2)
N 582 583 583 583 868 868 869 868
High waist circumference (%)1) 26.9 27.3 27.5 30.0 38.2 41.6 40.0 37.3
Age adjusted OR 1.00 1.02 (0.79-1.33) 1.04 (0.80-1.34) 1.15 (0.89-1.49) 0.2581 1.00 1.15 (0.95-1.40) 1.06 (0.87-1.29) 0.96 (0.79-1.17) 0.3826 Multivariable-Model 12) 1.00 1.00 (0.77-1.29) 1.02 (0.78-1.32) 1.12 (0.87-1.45) 0.3388 1.00 1.21 (0.99-1.48) 1.12 (0.91-1.38) 1.03 (0.84-1.27) 0.8208 Multivariable-Model 23) 1.00 0.94 (0.72-1.24) 0.93 (0.69-1.25) 0.98 (0.70-1.38) 0.9912 1.00 1.06 (0.86-1.31) 0.90 (0.71-1.13) 0.73 (0.55-0.98) 0.0082
Hypertriglyceridemia (%)1) 40.4 36.6 38.2 36.8 34.8 34.7 31.8 30.8
Age adjusted OR 1.00 0.85 (0.67-1.08) 0.91 (0.72-1.16) 0.86 (0.68-1.09) 0.3372 1.00 1.00 (0.82-1.22) 0.87 (0.71-1.07) 0.84 (0.68-1.03) 0.0432 Multivariable-Model 1 1.00 0.85 (0.67-1.08) 0.91 (0.72-1.16) 0.85 (0.67-1.08) 0.2818 1.00 1.02 (0.83-1.25) 0.88 (0.71-1.09) 0.86 (0.69-1.06) 0.0791 Multivariable-Model 2 1.00 0.77 (0.60-0.99) 0.75 (0.57-0.99) 0.62 (0.45-0.85) 0.0068 1.00 1.05 (0.84-1.30) 0.91 (0.72-1.16) 0.91 (0.68-1.22) 0.3700
Low HDL cholesterol (%)1) 33.5 40.4 37.5 38.4 71.0 67.1 68.0 63.9
Age adjusted OR 1.00 1.35 (1.06-1.71) 1.19 (0.94-1.52) 1.24 (0.98-1.58) 0.2379 1.00 0.83 (0.68-1.02) 0.87 (0.71-1.07) 0.72 (0.59-0.89) 0.0041 Multivariable-Model 1 1.00 1.33 (1.04-1.69) 1.16 (0.91-1.49) 1.20 (0.94-1.52) 0.3896 1.00 0.86 (0.70-1.07) 0.86 (0.69-1.07) 0.74 (0.59-0.91) 0.0078 Multivariable-Model 2 1.00 1.46 (1.13-1.88) 1.38 (1.05-1.82) 1.55 (1.31-2.12) 0.0331 1.00 0.95 (0.75-1.19) 1.00 (0.78-1.28) 0.97 (0.72-1.30) 0.9575
High blood pressure (%)1) 42.9 47.8 42.5 43.3 32.6 34.4 35.3 34.6
Age adjusted OR 1.00 1.22 (0.97-1.54) 0.99 (0.78-1.24) 1.02 (0.81-1.28) 0.6377 1.00 1.08 (0.89-1.33) 1.13 (0.92-1.38) 1.10 (0.89-1.35) 0.4015 Multivariable-Model 1 1.00 1.22 (0.97-1.54) 0.99 (0.79-1.26) 1.02 (0.80-1.28) 0.6291 1.00 1.12 (0.90-1.37) 1.17 (0.94-1.44) 1.16 (0.94-1.44) 0.1851 Multivariable-Model 2 1.00 1.19 (0.93-1.52) 0.95 (0.73-1.23) 0.94 (0.69-1.27) 0.3376 1.00 1.07 (0.86-1.33) 1.09 (0.86-1.39) 1.06 (0.79-1.41) 0.8002
High blood glucose (%)1) 34.9 41.0 40.0 41.6 26.7 28.0 25.7 26.7
Age adjusted OR 1.00 1.30 (1.02-1.64) 1.25 (0.98-1.58) 1.33 (1.05-1.69) 0.0458 1.00 1.07 (0.87-1.32) 0.95 (0.76-1.18) 1.00 (0.81-1.24) 0.7548 Multivariable-Model 1 1.00 1.30 (1.02-1.65) 1.25 (0.98-1.59) 1.31 (1.03-1.66) 0.0690 1.00 1.09 (0.88-1.36) 0.92 (0.74-1.16) 1.05 (0.84-1.31) 0.9842 Multivariable-Model 2 1.00 1.20 (0.93-1.54) 1.07 (0.81-1.40) 1.02 (0.72-1.39) 0.7300 1.00 0.93 (0.74-1.17) 0.70 (0.54-0.91) 0.66 (0.48-0.90) 0.0032
Metabolic syndrome (%)1) 28.5 30.9 29.9 30.9 35.7 34.5 33.7 30.8
Age adjusted OR 1.00 1.13 (0.87-1.45) 1.07 (0.83-1.39) 1.13 (0.88-1.46) 0.4541 1.00 0.95 (0.78-1.16) 0.92 (0.75-1.12) 0.80 (0.65-0.98) 0.0283 Multivariable-Model 1 1.00 1.11 (0.86-1.44) 1.06 (0.82-1.37) 1.09 (0.85-1.42) 0.6199 1.00 0.98 (0.80-1.20) 0.93 (0.76-1.15) 0.85 (0.69-1.05) 0.1087 Multivariable-Model 2 1.00 1.01 (0.77-1.32) 0.88 (0.66-1.18) 0.82 (0.58-1.14) 0.1579 1.00 0.86 (0.72-1.11) 0.80 (0.63-1.02) 0.67 (0.50-0.90) 0.0062
1)Age-adjusted prevalence
2)Multivariable-Model 1 was adjusted for age (yrs) and education (≥ High-school, yes/no) in men and age (yrs), education (≥ High-school, yes/no), farmer(yes/no), marital status (married or no), and exercise habits (≥ 22.5 MET-h/week) in women.
3)Multivariable-Model 2 was additionally adjusted for glycemic load and daily intake of fat, fiber, and sodium in men and for glycemic load and daily intake of fat, fiber, sodium and energy in women.
Table 4. ORs and 95% CI of metabolic syndrome components according to quartiles of dietary calcium intake from foods among calcium and multinutrient non-users Quartiles of dietary calcium intake (mg/d)
Men (n = 2,491) Women (n = 3,884)
Q1 Q2 Q3 Q4 P-value Q1 Q2 Q3 Q4 P-value
Low HDL cholesterol (%)1) 33.6 40.6 38.1 38.5 71.0 67.2 67.3 63.1
Age adjusted OR 1.00 1.36 (1.08-1.71) 1.22 (0.97-1.54) 1.25 (0.99-1.57) 0.2083 1.00 0.84 (0.69-1.02) 0.84 (0.69-1.03) 0.70 (0.58-0.85) 0.0006 Multivariable-Model 1 1.00 1.33 (1.06-1.68) 1.19 (0.94-1.51) 1.20 (0.95-1.52) 0.3511 1.00 0.85 (0.69-1.04) 0.85 (0.69-1.04) 0.71 (0.58-0.87) 0.0012 Multivariable-Model 2 1.00 1.51 (1.18-1.93) 1.44 (1.11-1.88) 1.61 (1.18-2.18) 0.0158 1.00 0.91 (0.74-1.13) 0.96 (0.76-1.21) 0.89 (0.67-1.17) 0.5103
High blood pressure (%)1) 42.7 48.0 42.5 42.9 32.1 34.7 35.9 34.9
Age adjusted OR 1.00 1.24 (0.99-1.55) 0.99 (0.79-1.24) 1.01 (0.81-1.26) 0.5446 1.00 1.13 (0.93-1.36) 1.19 (0.98-1.44) 1.14 (0.94-1.38) 0.2210 Multivariable-Model 1 1.00 1.24 (0.99-1.55) 1.01 (0.80-1.26) 1.01 (0.80-1.26) 0.5456 1.00 1.15 (0.94-1.40) 1.22 (1.00-1.49) 1.18 (0.97-1.45) 0.1233 Multivariable-Model 2 1.00 1.21 (0.95-1.53) 0.96 (0.74-1.24) 0.94 (0.70-1.26) 0.2907 1.00 1.12 (0.91-1.38) 1.18 (0.94-1.48) 1.13 (0.86-1.49) 0.4771
High blood glucose (%)1) 35.2 40.4 39.4 41.2 26.2 28.4 26.0 26.3
Age adjusted OR 1.00 1.25 (0.99-1.57) 1.20 (0.95-1.51) 1.29 (1.03-1.63) 0.0616 1.00 1.12 (0.92-1.37) 0.99 (0.81-1.22) 1.00 (0.82-1.23) 0.6782 Multivariable-Model 1 1.00 1.25 (0.99-1.57) 1.20 (0.95-1.52) 1.27 (1.01-1.60) 0.0913 1.00 1.13 (0.92-1.39) 0.95 (0.77-1.18) 1.03 (0.84-1.28) 0.8342 Multivariable-Model 2 1.00 1.16 (0.91-1.48) 1.04 (0.80-1.36) 1.01 (0.75-1.37) 0.7343 1.00 0.99 (0.79-1.23) 0.76 (0.59-0.96) 0.69 (0.51-0.92) 0.0027
Metabolic syndrome (%)1) 28.9 30.5 29.5 31.1 34.7 35.0 33.3 31.0
Age adjusted OR 1.00 1.08 (0.85-1.39) 1.03 (0.81-1.33) 1.12 (0.88-1.43) 0.4398 1.00 1.01 (0.84-1.23) 0.94 (0.78-1.14) 0.84 (0.69-1.02) 0.0465 Multivariable-Model 1 1.00 1.07 (0.84-1.37) 1.02 (0.80-1.31) 1.09 (0.85-1.39) 0.5878 1.00 1.03 (0.85-1.26) 0.96 (0.79-1.17) 0.88 (0.72-1.08) 0.1296 Multivariable-Model 2 1.00 0.98 (0.75-1.27) 0.86 (0.65-1.14) 0.82 (0.60-1.14) 0.1842 1.00 0.96 (0.78-1.18) 0.85 (0.67-1.06) 0.71 (0.54-0.94) 0.0091
1)Age-adjusted prevalence
2)Multivariable-Model 1 was adjusted for age (yrs) and education (≥ High-school, yes/no) in men and age (yrs), education (≥ High-school, yes/no), farmer (yes/no), marital status (married or no), and exercise habits (≥ 22.5 MET-h/week) in women.
3)Multivariable-Model 2 was additionally adjusted for glycemic load and daily intake of fat, fiber, and sodium in men and glycemic load, and daily intake of fat, fiber, sodium and energy in women.
Table 3. continued
compared to the same distribution in a Western population (value of the highest quintile > 1,372 mg/d) [22]. Nevertheless, the inverse relationships between metabolic syndrome and/or its components and calcium intake in several previous studies [5,9,23,24] were also found inthe present study population whose calcium intake was relatively low.
The inverse relationships between dietary calcium, WC [5,25,26], and blood glucose [24], and triglyceride [5,9] were also found in previous cross-sectional and intervention studies. The inverse relationship of dietary calcium intake with WC was also found with body fat [27], BMI, and body weight among women [28]. There were few previous studies on the relationship between calcium and fasting blood glucose level, but a Dutch study found an inverse relationship between calcium intake and blood glucose [24]. This inverse relation was consistent with some, but not all, of the results [9,23]. A cross-sectional study [5] and two previous cohort studies [29,30] found lower risk of type 2 diabetes with higher calcium. The lower risk of hypertriglyceridemia in the relatively high calcium intake group was consistent with the lipid-lowering effect of calcium observed in previous cross-sectional studies [5,9].
There were no significant associations between high BP and calcium intake in the present study. Previously, no relationships between dietary calcium intake and hypertension have been reported in Korea [9] or in the United States [8], and a meta- analysis of clinical trial evidence showed that calcium supple- mentation has a small and inconsistent effect on BP [31].
However, there are possible mechanisms for the antihyper- tensive effect of increased dietary calcium [5,23,32]. Thus, further studies are needed to confirm the effect of calcium on BP.
The possible mechanisms of the inverse relationship between dietary calcium intake and WC, blood glucose, and triglyceride in the present study may be as follows: low calcium intake may be related to an increase in calcium content of tissues, such as adipocytes. This may lead to the stimulation of fatty acid synthase activity and a decrease in lipolysis in adipocytes [10,11]. Calcium is essential for insulin-mediated intracellular processes in insulin-responsive tissues and may contribute to insulin sensitivity via impaired signal transduction [10]. Previous epidemiological studies have demonstrated a positive relation- ship between calcium intake and insulin sensitivity [22,23]. In addition, high calcium intake may increase fecal fat excretion via formation of insoluble calcium fatty acid soaps, by binding bile acids or by decreasing fat absorption in the intestine [33].
Gender-differences in the relationships between calcium and metabolic syndrome components were also observed in previous epidemiological studies [8,9,21,25]. An inverse association between calcium intake and metabolic syndrome was previously reported in post-menopausal women, but not in men or in pre-menopausal women [5,9]. The present study, in which most women were post-menopausal, also showed an inverse associa- tion. Estrogen withdrawal at menopause may lead to a decrease in intestinal calcium absorption and in renal calcium conser- vation [34,35]. An abrupt increase in serum calcium level has been observed around menopause in women [36]. And the sex-hormone and lifestyle differences between men and women, such as smoking, drinking habits, and dietary patterns [21,36], ultimately may lead to gender differences. In the present
study, most women were post-menopausal and thus we could not definitively assert sex-hormone as the cause for these gender differences. In the present study, smoking and drinking status were not potential confounders and some dietary factors were adjusted. However, a relatively higher proportion of smokers and drinkers may affect overall calcium metabolism results in men, via depression of the vitamin D-parathyroid hormone system among smokers [37] or by reducing bone mineral density in excessive alcohol drinkers [38]. Those effects on calcium metabolism may partially contribute to the sex-based differences observed in the association between calcium intake and metabolic syndrome in this study.
Unexpectedly, we found an inverse relationship of HDL cholesterol with calcium intake in men unlike previous cross- sectional studies [9,26] showing positive relationships. Another Korean study revealed a negative correlation between calcium intake and HDL cholesterol; however, the same study showed a positive correlation between calcium intake and triglyceride [39], unlike the present study. They suggested that calcium consumption derived from animal-based foods was positively associated with blood triglyceride in normotensive Korean subjects [39] and varying roles in lipid metabolism were suggested for calcium from animal-based and plant-based foods. However, calcium derived animal-based foods could not explain the positive relationship between dietary calcium intake and hypertrigly- ceridemia and low HDL cholesterolemia among our subjects who had relatively low animal foods. Therefore, further studies are needed using more sophisticated dietary calcium assess- ment tools.
There are several limitations to interpret results of the present study. First, convenient recruitment may preclude generali- zation of the results. Second, due to the cross-sectional nature of this study, it was not possible to establish a cause-effect relationship between calcium intake and metabolic syndrome components. Third, it was not possible to control for all potential confounders in the present study. The classical func- tion of vitamin D is regulation for calcium homeostasis [11] and magnesium may directly regulate cellular glucose metabolism by interacting with cellular calcium homeostasis [40]. However, due to the lack of available information on magnesium and vitamin D in the Korean Food Composition Table, the regulatory effect of vitamin D and magnesium on calcium homeostasis could not be considered in the present study. In addition, potassium, which may decrease calcium excretion, could not be included in the analysis due to the high correlation coeffi- cient with calcium intake (r > 0.80 in both men and women).
Hormone replacement therapy may be another factor affecting calcium metabolism, but in the present study, just 1.6% of women had used hormone replacement therapy and we did not detect any significant effect on dietary calcium or metabolic syndrome. Regardless of these limitations, there is still a possible relationship between calcium intake and metabolic syndrome and its components. Only a few studies were conducted previously and they reported inconsistent results [6,30,41,42]
concerning the effect of calcium intake in Asian populations with a relatively low overall calcium intake.
In conclusion, the findings in the present study suggest that
calcium intake may be inversely related to metabolic syndrome
among middle-aged and elderly women in rural areas of Korea.
This relationship in women could be mediated by WC and blood glucose.
REFERENCE
1. Eckel RH, Grundy SM, Zimmet PZ. The metabolic syndrome. Lancet 2005;365:1415-28.
2. Wilson PW, D'Agostino RB, Parise H, Sullivan L, Meigs JB. Metabolic syndrome as a precursor of cardiovascular disease and type 2 diabetes mellitus. Circulation 2005;112:3066-72.
3. Lusis AJ, Attie AD, Reue K. Metabolic syndrome: from epidemiology to systems biology. Nat Rev Genet 2008;9:819-30.
4. Riccardi G, Giacco R, Rivellese AA. Dietary fat, insulin sensitivity and the metabolic syndrome. Clin Nutr 2004;23:447-56.
5. Liu S, Song Y, Ford ES, Manson JE, Buring JE, Ridker PM. Dietary calcium, vitamin D, and the prevalence of metabolic syndrome in middle-aged and older U.S. women. Diabetes Care 2005;28:2926-32.
6. Azadbakht L, Mirmiran P, Esmaillzadeh A, Azizi F. Dairy consumption is inversely associated with the prevalence of the metabolic syndrome in Tehranian adults. Am J Clin Nutr 2005;82:523-30.
7. Vaskonen T. Dietary minerals and modification of cardiovascular risk factors. J Nutr Biochem 2003;14:492-506.
8. Beydoun MA, Gary TL, Caballero BH, Lawrence RS, Cheskin LJ, Wang Y. Ethnic differences in dairy and related nutrient consumption among US adults and their association with obesity, central obesity, and the metabolic syndrome. Am J Clin Nutr 2008;87:1914-25.
9. Cho GJ, Park HT, Shin JH, Hur JY, Kim YT, Kim SH, Lee KW, Kim T. Calcium intake is inversely associated with metabolic syndrome in postmenopausal women: Korea National Health and Nutrition Survey, 2001 and 2005. Menopause 2009;16:992-7.
10. Zemel MB. Nutritional and endocrine modulation of intracellular calcium: implications in obesity, insulin resistance and hypertension.
Mol Cell Biochem 1998;188:129-36.
11. Zemel MB. Calcium modulation of hypertension and obesity:
mechanisms and implications. J Am Coll Nutr 2001;20:428S-435S.
12. Sook M. Food consumption trends and nutrition transition in Korea.
Malays J Nutr 2003;9:7-17.
13. Wang Y, Li S. Worldwide trends in dairy production and consump- tion and calcium intake: is promoting consumption of dairy products a sustainable solution for inadequate calcium intake? Food Nutr Bull 2008;29:172-85.
14. Ministry of Health and Welfare, Korea Centers for Disease Control and Prevention. Korea Health Statistics 2009: Korea National Health and Nutrition Examination Survey (KNHANES IV-3). Cheongwon:
Korea Centers for Disease Control and Prevention; 2010.
15. Cheung BM. The cardiovascular continuum in Asia--a new paradigm for the metabolic syndrome. J Cardiovasc Pharmacol 2005;46:125-9.
16. Friedewald WT, Levy RI, Fredrickson DS. Estimation of the concen- tration of low-density lipoprotein cholesterol in plasma, without use of the preparative ultracentrifuge. Clin Chem 1972;18:499-502.
17. Lee SY, Park HS, Kim DJ, Han JH, Kim SM, Cho GJ, Kim DY, Kwon HS, Kim SR, Lee CB, Oh SJ, Park CY, Yoo HJ. Appropriate waist circumference cutoff points for central obesity in Korean adults.
Diabetes Res Clin Pract 2007;75:72-80.
18. International Diabetes Federation (BE). The IDF Consensus World- wide Definition of the Metabolic Syndrome. Brussels: International Diabetes Federation; 2006.
19. Ahn Y, Kwon E, Shim JE, Park MK, Joo Y, Kimm K, Park C, Kim DH.
Validation and reproducibility of food frequency questionnaire for Korean genome epidemiologic study. Eur J Clin Nutr 2007;61:
1435-41.
20. National Rural Living Science Institute (KR). Food Composition Table. 6th ed. Suwon: National Rural Living Science Institute; 2001.
21. Samara A, Herbeth B, Ndiaye NC, Fumeron F, Billod S, Siest G, Visvikis-Siest S. Dairy product consumption, calcium intakes, and metabolic syndrome-related factors over 5 years in the STANISLAS study. Nutrition 2013;29:519-24.
22. Ma B, Lawson AB, Liese AD, Bell RA, Mayer-Davis EJ. Dairy, magne- sium, and calcium intake in relation to insulin sensitivity: approaches to modeling a dose-dependent association. Am J Epidemiol 2006;164:449-58.
23. Drouillet P, Balkau B, Charles MA, Vol S, Bedouet M, Ducimetière P; Desir Study Group. Calcium consumption and insulin resistance syndrome parameters. Data from the Epidemiological Study on the Insulin Resistance Syndrome (DESIR). Nutr Metab Cardiovasc Dis 2007;17:486-92.
24. Richart T, Thijs L, Nawrot T, Yu J, Kuznetsova T, Balkestein EJ, Struijker-Boudier HA, Staessen JA. The metabolic syndrome and carotid intima-media thickness in relation to the parathyroid hormone to 25-OH-D(3) ratio in a general population. Am J Hypertens 2011;24:102-9.
25. Huang L, Xue J, He Y, Wang J, Sun C, Feng R, Teng J, He Y, Li Y. Dietary calcium but not elemental calcium from supplements is associated with body composition and obesity in Chinese women.
PLoS One 2011;6:e27703.
26. Jacqmain M, Doucet E, Després JP, Bouchard C, Tremblay A. Calcium intake, body composition, and lipoprotein-lipid concentrations in adults. Am J Clin Nutr 2003;77:1448-52.
27. Zemel MB, Shi H, Greer B, Dirienzo D, Zemel PC. Regulation of adiposity by dietary calcium. FASEB J 2000;14:1132-8.
28. Davies KM, Heaney RP, Recker RR, Lappe JM, Barger-Lux MJ, Rafferty K, Hinders S. Calcium intake and body weight. J Clin Endocrinol Metab 2000;85:4635-8.
29. Pittas AG, Dawson-Hughes B, Li T, Van Dam RM, Willett WC, Manson JE, Hu FB. Vitamin D and calcium intake in relation to type 2 diabetes in women. Diabetes Care 2006;29:650-6.
30. Villegas R, Gao YT, Dai Q, Yang G, Cai H, Li H, Zheng W, Shu XO.
Dietary calcium and magnesium intakes and the risk of type 2 diabetes: the Shanghai Women's Health Study. Am J Clin Nutr 2009;89:1059-67.
31. Allender PS, Cutler JA, Follmann D, Cappuccio FP, Pryer J, Elliott P. Dietary calcium and blood pressure: a meta-analysis of randomized clinical trials. Ann Intern Med 1996;124:825-31.
32. Wang L, Manson JE, Buring JE, Lee IM, Sesso HD. Dietary intake of dairy products, calcium, and vitamin D and the risk of hyper- tension in middle-aged and older women. Hypertension 2008;51:
1073-9.
33. van Meijl LE, Vrolix R, Mensink RP. Dairy product consumption and the metabolic syndrome. Nutr Res Rev 2008;21:148-57.
34. Heaney RP. Estrogen-calcium interactions in the postmenopause:
a quantitative description. Bone Miner 1990;11:67-84.
35. Abrams SA. Calcium turnover and nutrition through the life cycle.
Proc Nutr Soc 2001;60:283-9.
36. Jorde R, Sundsfjord J, Bønaa KH. Determinants of serum calcium in men and women. The Tromsø Study. Eur J Epidemiol 2001;17:
1117-23.
37. Brot C, Jorgensen NR, Sorensen OH. The influence of smoking on vitamin D status and calcium metabolism. Eur J Clin Nutr 1999;53:
920-6.
38. Conde FA, Aronson WJ. Risk factors for male osteoporosis. Urol Oncol 2003;21:380-3.
39. Kim MH, Bu SY, Choi MK. Daily calcium intake and its relation to blood pressure, blood lipids, and oxidative stress biomarkers in hypertensive and normotensive subjects. Nutr Res Pract 2012;6:
421-8.
40. Barbagallo M, Dominguez LJ, Galioto A, Ferlisi A, Cani C, Malfa L,
Pineo A, Busardo' A, Paolisso G. Role of magnesium in insulin action, diabetes and cardio-metabolic syndrome X. Mol Aspects Med 2003;24:39-52.
41. Shahkhalili Y, Murset C, Meirim I, Duruz E, Guinchard S, Cavadini C, Acheson K. Calcium supplementation of chocolate: effect on cocoa butter digestibility and blood lipids in humans. Am J Clin Nutr 2001;73:246-52.
42. Kim K, Yang YJ, Kim K, Kim MK. Interactions of single nucleotide polymorphisms with dietary calcium intake on the risk of metabolic syndrome. Am J Clin Nutr 2012;95:231-40.