Journal of the Korean Chemical Society 1999, Vol. 43, No. 2
Printed in the Republic of Korea
새로운 글로우 방전/유도결합 플라스마 장치 (GD/ICP Interface) 에 대한 기초 연구: Part L 기초 연구
李桂浩* •金亨昇•吉孝植• Gary M. Hi 顷je*
충남대학교 자연과학대학 화학과
,인디아나대학교 화학과
(1999. 1. 8
접수)The Fundamental Studies of the New Glow Discharge/Inductively Coupled Plasma Interface: Part I. Preliminary Studies
Gae Ho Lee*, Hyo Shik Kil, Hyung Seung Kim, and Gary M. Hiefiye+
Department of Chemistry, Chungnam University, Taejon 305-764, Korea
^Department of Chemistry, Indiana University, Bloomington, IN, USA
(Received January 8, 1998)
요 약・ 글로우 방전
(Glow Discharge, GD)
과 유도결합플라스마(Inductively Coupled Plasma, ICP)
원자 방 출분광법(Atomic Emission Spectrometer, AES)
에서 사용되는 새로운 장치를 개발하였다.ICP-AES
에서GD- AES
로전환하는 데 불과15
분정도 소요되기 때문에, 고체 시료 및 액체시료에 포함된 극미 량 원소분석을 신 속하게 수행할수 있다.실험변수 중에서 냉각기체 유속, 시료운반기체 유속,절단기체 유속, 보조기체 유속, 측정깊이, 이온통과관 크기, 그리고rf
전원의 세기 변화에 따른원자방출 복사선 변화에 미치는 영향을 조사 연구하였다.Cd(I) 228.8 nm, Mn(II) 257.61 nm, and Fe(II) 259.95 nm
에서 측정한검출한계는각각3.86, 1.49, 5.79 ppb
로 측정되었으며,직선성은1.000
으로서 우수하였다.ABSTRACTS. The new GD/ICP-AES quick change over system has been developed and characterized.
Within less than 15 minutes, ICP-AES could be switched to GD-AES and vise a versa. As a result, both solid and liquid samples could be analyzed in a very
아lort period of time by the ICP/GD-AES quick change over system developed in our laboratory. The influences of the experimental variables, such as flow rate of coolant gas, flow rate of auxiliary gas, flow rate of sample canier gas, sampling depth, orifice size of sampling cone, and rf (radio frequency) power on emission intensity have been presented. The detection limits of Cd(I) 228.8 nm, Mn (II) 257.61 nm, and Fe(II) 259.95 nm were found to be 3.86, 1.49, and 5.79 ppb, respectively. And linealities of the calibration curves were measured to be unity
INTRODUCTION
Analytical atomic spectrometry has been used for a long time in order to analyze many kinds of samples quantitatively as well as qualitatively. Due to the nature of atomic spectroscopy, the source of atomization is a critical component in atomic spectrometry. Since a flame was adopted as an atomization source, many researches have been performed to develope new atomization sources.
Typical characteristics of ideal atomization sources represent relatively high temperature, stability, less interference effects, and easy operation. Induc
tively coupled plasma(ICP),1~3 glow discharge (GD),4~6 laser induced plasma(LIP),7~9 hollow cathode discharge (HCD),10,11 arc, flame, spark dis
charge,12,13 microwave induced plasma(MIP),14''16 direct cunent plasma(DCP),17 and microwave pla
sma tor
아i(MPTy8~" have been used as atomiza
새로운 글로우 방전/유도결합 플라스마 장치(GD/ICP Interface)에 대한 기초 연구
183 tion sources.
Especially, the sources of excitation in atomic emission spectroscopy must serve two basic functions. First, the sources must provide sufficient energy to desolvate and vaporize constituents of a liquid or a solid sample and to convert individual analyte species into gaseous atoms and ions. The second function is to provide sufficient energy to excite a fraction of the resulting gaseous atoms or ions to their electronic energy levels. It is essential that each of those processes be carried out in a reproducible manner.
ICP has known as an ideal atomization source for atomic emission spectrometry since the first ICP paper was published in 1965. In a relatively short period of time, it was recognized that the ICP technique is often superior to other atomic emission spectroscopic (AES) methods as well as atomic absorption spectrometry (AAS) in terms of the precision, accuracy, dynamic range, inter
ference effects, and detection limits. In fact, plasma spectroscopy technique such as ICP is one of the best analytical methods to handle liquid samples because it does not exhibit many of the problems associated with the past sources of excitation. However, solid sample couldn't analyze by ICP directly unless it dissolves. Otherwise laser ablation, spark, and electrothermal vaporizer have been used in ICP for direct solid analysis.
Glow discharge has capability to analyze solid sample directly. Glow discharge is relatively simple to make and easy to operate. Since the linewidth is relatively narrow, GD has less spectral interference comparing to arc, spark or ICP. The stability of GD is excellent which is about 0.1-1%, and hence GD has been extensively used to analyze trace elements in high purity metals especially.
In this studies, ICP/GD-AES quick change over system has been developed and characterized.
Within less than 15 minutes, ICP-AES could be switched to GD-AES and vise a versa. The ICP/
GD quick change over system consists of the same spectrometer and optics for both ICP and GD.
Therefore, both solid and liquid samples could be analyzed in a very short time by ICP/GD-AES
quick change over system developed in our labora
tory. In this report, the hardware configuration will be reported mainly, and preliminary experimental results for ICP-AES, such as the effects of several experimental variables on emission intensity and analytical performances such as detection limits, obtained so far will be reported. In a subsequent paper, plasma diagnostics such as the effects of excitation temperature, electron density, chemical interference, and spatial emission profiles would be reported.
EXPERIMENTALS
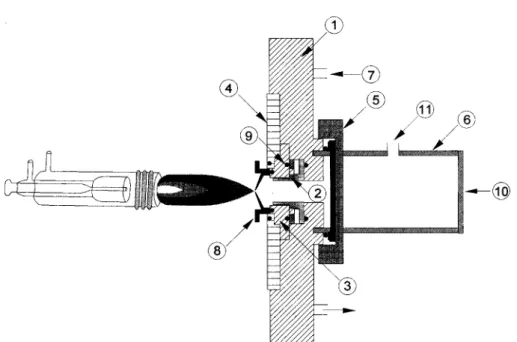
The schematic diagram of GD-AES developed in our laboratory is shown in Fig. 1. As shown in Fig. 1, the basic structure of the GD-AES developed in our laboratory is basically the same as that of conventional GD. A water cooled cathode (④)made of copper is isolated from anode (②)by inserting Macor adopter (③).The sample to be analyzed (⑧)is placed on the surface of water cooled cathode block. Emission intensity is monitored through the quartz window (⑩).
Fig. 1. Schematic Diagram of GD-AES without sam
pling cone.① Body(2)Nozzle (3)Ceramic ④ Cathode block ⑤ Ultraton fitting ⑥ Quartz tube ⑦ Cooling wat
er (8)Sample ⑨ O-ring ⑩ Quartz lens ⑪ Vacuum port.
184
李桂浩 • 金亨昇 • 吉孝치直•Gary M. Hieftje
Fig. 2. Schematic Diagram of ICP-AES with sampling cone. ① Body ② Noz기
e (3) Ceramic ④ Cathode block ⑤ Ul- tratorr fitting ⑥ Quartz tube ⑦ Cooling water ⑧ Sampling cone ⑨ O-ring ⑩ Quartz lens ⑪ Vacuum port.
GD-AES in Fig, 1 is readily switched to ICP- AES as shown in Fig, 2. The schematic diagram of ICP-AES is about the same as that of GD-AES in Fig. 1 except for sampling cone (⑧)and ICP torch. In fact, solid sample in Fig. 1 for GD-AES is simply replaced by the sampling cone (⑧)in
Fig. 2 for ICP-AES. In order to switch from GD-AES to ICP-AES, the sampling cone is simply screwed in the cathode block as shown in Fig. 2.
Then, emission intensity is collected through quartz window (⑩)in Fig. 2 as same as in a commercial axial-viewed ICP-AES. The figures of merits, such as detection limit and linear dynamic range, of axial-viewed ICP-AES are known to be superior to those of radial-viewed ICP-AES.
Basically, there is no moving optics in the system when GD-AES is changed over to ICP- AES, and the same monochromator is used for both GD-AES and ICP-AES. Hence, better precision is expected. In general, it takes less than 15 min. in order to change from GD-AES to ICP-AES con
figuration and vise versa.
The 2000 V and 250 mA power supply (Korea Switching Co. Korea), and 1.6 kW, 40.68 MHz radio frequency generator (RFPP ICP 16L, USA)
are used for GD-AES and ICP-AES, respectively.
The Ar gas was used with a moisture trap (RGF- 125-400 Labclear, USA) to remove water vapour from Ar gas. For the application used in this study, a Meinhard concentric glass nebulizer, model TR- 50-C1 (J. E. Meinhard Inc, Santa Ana, CA, USA) was used. An input pressure of 40 psig is required to obtain carrier argon gas flow rate from 0.6-1.2 L/min. The sample carrier gas flow is fed from its own gas cylinder, enabling independent flow regulation. The gas flow is controlled by means of a pressure regulator and a flow meter. The mass flow meter (MKS Instrument, CA, USA) is employed to monitor the gas flow rate. The flow meter facilitates control of the sample carrier gas flow rate to within 1% over an approximate range of 0.5 to 1.5 L/min. Precise control of this flow rate was convenient in ensuring high reproduci
bility of conditions during this study. The specifica
tions of experimental instruments are listed in
Table 1. Since the GD-AES developed in ourlaboratory was characterized and reported in
previous papers,21,22 the ICP-AES switchable to
the GD-AES in a very short time would be
investigated mai
기y in this study. The basic idea of
새로운 글로우 방전/유도결합 플라스마 장치(GD/ICP Interface)에 대한 기초 연구
185
Table 1. Specification of the GD/ICP-AESInstruments Specification
DC Power Supply RF Power Supply Monochromator
2000 V, 250 mA (Korea Switching) RFPP ICP 16L (RFPP, USA) Spex 1000M (Spex, USA) Focal length: 1.0 m 1800 grooves/mm, f#:7.8 PMT
DAC/ADC data acquisition
Hamamatsu R928
PCLAB-812PG (Adventech Ltd. Taiwan) 16 analog/digital input
3 analog output 12bit ADC/DAC Peristaltic pump
MFC
Gilson minipuls 3 (Gilson, USA) 0-2 L(MKS instrument, USA) 0-20 L(MKS instrument, USA) Cooler
Matching network
HX-03 (Jeio-tech, Korea) RFPP 16L
Table 2. The operating conditions of ICP-AES
ICP Condition
RF incident power 0.7-1.0 kW RF reflected power <15 W Coolant gas flow rate 12-16 L/min Sample Canier gas flow rate 0.9-1.2 L/min Cutting gas flow rate 0-1.5 L/min
Nebulizer Meinhard concentric
Spray chamber Scott type
GD/ICP-AES quick change over system could be adopted in GD/ICP-MS.
Cu, Zn, Ca, and Mn standard solutions were prepared from 1000 ppm stock solutions (Junsei Chemical Co., Japan) and deionized water with Milli Q system. The final concentrations of stan
dard solutions were 1 ppm. High purity of hydrochloric acid and nitric acid (Dong Woo Co., Korea) was used. In order to investigate the effect of several experimental variables on emission intensity, emission intensities on Ca(II) 393.37 nm, Ca(I) 422.67 nm, Cu(II) 224,7 nm, Cu(I) 324.75 nm, Mn(II) 257.61 nm, Mn(I) 279.48 nm, Zn(II) 206.2 nm, and Zn(I) 213.86 nm were observed by varying the magnitudes of the experimental variables. The experimental variables used in this study were flow rate of coolant gas, flow rate of auxiliary gas, flow rate of sample carrier gas,
sampling depth, orifice size of sampling cone, and rf(radio frequency) power. In addition, the effect of easily ionized element on emission intensity was investigated, and the preliminary results are reported in this paper.
RESULTS AND DISCUSSION
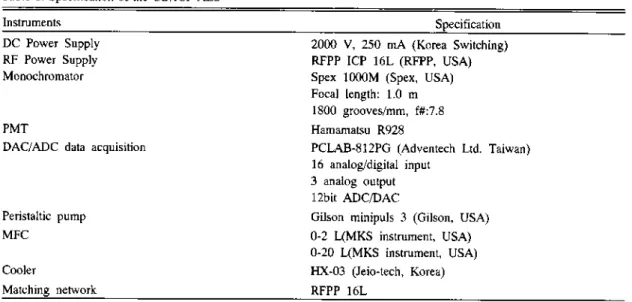
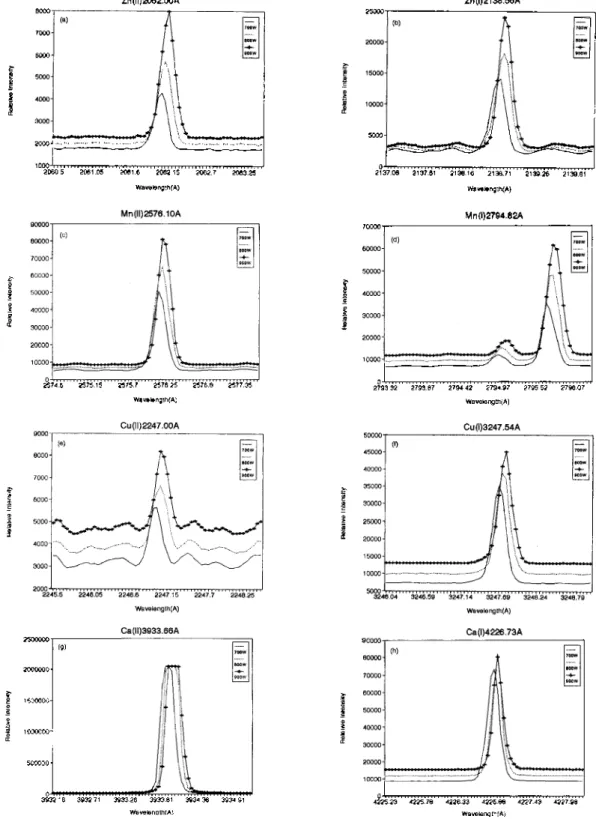
The emission intensities of Ca(II) 393.37 nm, Ca(I) 422.67 nm, Cu(II) 224.7 nm, Cu(I) 324.75 nm, Mn(II) 257.61 nm, Mn(I) 279.48 nm, Zn(II) 206.2 nm, and Zn(I) 213.86 nm were monitored by increasing coolant gas flow rate from 12L to 16L. 0.9 L of sample carrier gas, 3.5 mm of orifice size on sampling cone, and 800 W of rf power were used in this study. As shown in Fig. 3 a)-h), the emission intensities of ionic lines such as Zn(II) 206.20 nm and Cu(II) 224.70 nm tend to decrease by increasing coolant gas flow rate, while the emission intensities of all neutral atom lines does not change. It seems that the plasma temperature was decreased by increasing coolant gas flow rate, and thus the degree of ionization was decreased.
In general, coolant gas is used not only to
maintain the plasma discharge but also to prevent
the quartz tube from overheating when it is
tangentially introduced into the annular space
186
李桂浩•金亨昇•吉孝植• Gary M. HieftjeZn(ll)2062.00A
2060.55 2061.1 2061,65 2062.2 2062.75 2063.3
Wavelengtti(A)
Mn(ll)2576.10A
100000 90000 BOOQO
Al"u a 드 s
Zn(l)2138.56A
2138.16 2130.71 2139.26 2139.81
WavelangthfA)
6 s u2
£ 蜜 므교
e1
Wavelength(A)
Cu(ll)2247.00
Mn(l)2794.62A
279442 2794.97 2795.52 2796.07
Wavelength(A)
Cu(l)3247.54A
&
완 2
드 SA=el ,, ,r
은# 2
드 e 왼 2
드 s -s -v c
2246.05 2246.6 2247.15 2247.7 2246.25
Wavelength(A)
◎su s
드 e
>
= j프艰
324.71 324.765 324.62 324.075
Waveteng[h(A)
Ca(ll)3933.66A
3932.71 3933,26 3933.01 3934.36 3934.91
WavelengthfA)
A竺 은 8
드 321 표
£
Ca(l)4226.73A
4226.33 4226.88 4227.43 4227.06
Wavelength(A)
Fig. 3. Effect of Coolant Gas Flow Rate with 0.90L of Sample Carrier Gas Flow Rate on Emission Intensity, a) Zn(II)
2062.00A, b) Zn(I) 2138.56A, c) Mn(II) 2576.10A, d) Mn(I) 2794.82A, e) Cu(II) 2247.00A, f) Cu(I) 3247.54A, g) Ca
(II) 3933.66A, and h) Ca(I) 4226.73A.
새로운 글로우 방전/유도결합 플라스마 장치(GD/ICP Interface)에 대한 기초 연구
187 between the outer and inner quartz tubes. In this
way, vortex stabilization is established, resulting in a spiral flow up the tube with a low pressure region toward the center and a high velocity flow of plasma gas along the walls. Since the low pressure at the center of the quartz tube produced by the tangential introduction of the coolant gas is a function of mass flow rates, the sample aerosol enters more easily into the plasma at a higher flow rate of coolant gas. Contrary to the above obser\;a- tion, the severe cooling effect was observed in this study when the coolant gas flow rate was increased.
The same experiment except for 1.2 L of sample carrier gas flow rate has been performed. As increasing the sample carrier gas flow rate, not only the residence time of analyte in plasma would be shorten but also the degree of nebulization would be affected. That is, although a high flow rate of sample carrier gas enables production of fine aerosol particles and a high sample throughput into the plasma, the short residence time, as well as the cooling effects of the fast flow rate, results in decreasing the emission intensities of the both ionic lines and neutral atom lines. Therefore, comparing to the emission intensities with 0.9L of sample carrier gas flow rate, the all emission intensities of both neutral atom and ionic lines with 1.2 L were smaller than those of 0.9L of sample carrier gas flow rate.
The effect of auxiliary gas flow rate on the emission intensities of Ca(II) 393.37 nm, Ca(I) 422.
67 nm, Cu(II) 224.7 nm, Cu(I) 324.75 nm, Mn(II) 257.61 nm, Mn(I) 279.48 nm, Zn(II) 206.2 nm, and Zn(I) 213.86 nm are
아】own in Fig. 4 a)-h). As shown in Fig 4 a)-h), the emission intensities both ionic lines and neutral atom lines were decreased by increasing auxiliary gas flow rate except for Ca (I) and Ca(II). In fact, the emission intensity of Ca (II) was saturated as shown in Fig. 4 g) indicating the temperature of plasma was relatively high. In general, it is known that auxiliary gas does not greatly affect the physical and chemical properties of plasma itself. However, it's been found that the emission intensity of both ionic lines and neutral
atom lines are affected greatly by auxiliary gas in the axi
이-viewed ICP-AES used in this study.
Further investigation would be needed.
In order to eliminate the interference effects from a tail flume of plasma, an argon gas called cutting gas was introduced toward the plasma through the orifice of the sampling cone. Since the oxidation and recombination of the analyte species would be occurred in the tail flume, severe interference effects could be expected. Therefore, several methods have been employed in the commercial axial-viewed ICP-AES to eliminate interference effects due to a tail flume. In this study, the effect of cutting gas flow rate on emission intensity was observed. As the cutting gas flow rate was increased from 0.5 to 1.5 L, not only background emission intensities but also signal-to-background ratios for both ionic lines and neutral atom lines are enhanced indicating elimina
tion of tail flame.
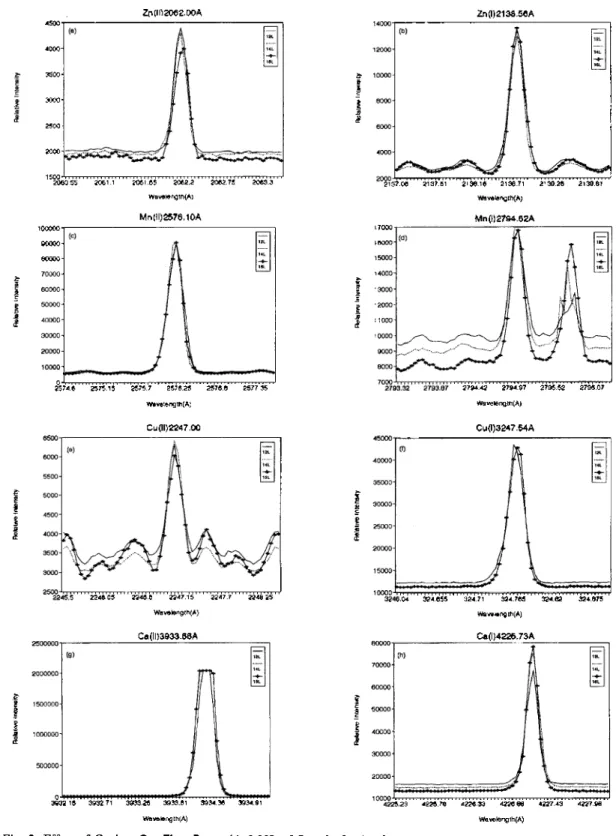
The influences of rf power on emission intensities of neutral atom and ionic lines are shown in Fig. 5 a)-h). In general, as rf power is increased, the temperature of the plasma is increased. And hence enhanced emission intensity as well as the back
ground emission intensity is observed generally. As a result, the experimental conditions have to be compromised to get best signal-to-background ratio.
As rf power is increased from 700 to 900 W, the emission intensities as well as background emission intensities of Ca(II) 393.37 nm, Ca(I) 422.67 nm, Cu(II) 224.7 nm, Cu(I) 324.75 nm, Mn(II) 257.61 nm, Mn(I) 279.48 nm, Zn(II) 206.2 nm, and Za① 213.86 nm were greatly enhanced as observed in
Fig. 5. Especially, signal-to-background ratios of Ca(I) 422.67 nm, Cu(II) 224.7 nm, Cu(I) 324.75 nm, and Mn(I) 279.48 nm were significantly decreased by increasing rf power indicating that plasma continuum background emission is dominant at 900 W of rf power.
Emission intensities for analyte and background
would be greatly affected by orifice size of
sampling cone. In this study, 2.5 and 3.5 mm inner
diameter of orifice size were examined, and it was
found that soft lines such as Ca(II) and Ca(I)
188
李桂浩•金亨昇•吉孝布宜• Gary M. Hieftje◎쯘 2 드 g g 표
£
Zn(l)2138.56A
2060.5 2061.05 2061.6 2062.15
Warelength(A)
&
s u s
드
B
Mn(ll)2576.10A
ffsu 꼬 드"
,>
=s
e 1
s-s<Je트
e르1
£
Cu(l)3247.54A
AJ
"
U 의 드
eA-lE-®
11
AJ-
완 a
드 욐
nB-eu
WevelengthCA) --
은옫
eA--
끄 u*1
WavelengthfA)
Fig. 4. Effect of Auxiliary Gas Flow Rate with 0.9L of Sample Carrier Gas Flow Rate on Emission Intensity, a) Zn(II)
2062.00A, b) Zn(I) 2138.56A, c) Mn(II) 2576.10A, d) Mn(I) 2794.82A, e) Cu(II) 2247.00A, f) Cu(I) 3247.54A, g) Ca
(II) 3933.66A, h) Ca(I) 4226.73A.
새로운 글로우 방전/유도결합 플라스마 장치(GD/ICP Interface)에 대한 기초 연구
189
8000
Zn(ll)2062.00A Zn I 2138.56A
6000 7000
e 8 u s 드
6AI
S
e一 11
5000'
? s u a
"A-le-eH드
끄드
eA-lB-e
11
20 써••二…••二•……—二…二二七/ …… .... ....
1000 丄 ... mi... ... m 2060.5 2061.05 2061.6 2062.15 2062,7 2063.25
Wavelength(A)
2574.6 2575.15 2575.7 257625 2576.6 2577,35
Wavelength(A)
25000001—— (g)
2000000-
150000Q-
1000000-
500000
2137.06 2137,61 2138.16 2130.71 2139.26 2139.61
Wavetength/A)
Mn(l 2794.82A
5 s u s
드 e
>
=
"
e u
2793.32 2793.87 2794.42 2794.97 2795.52 2796.07 WBvelength(A)
e s u 2 드 e A
= 끄
3932.16 3932.71 3933.26 3933.81 3934.36 3934.91 4225.23 4225.78 4226.33 422&88 4227.43 4227.98
Wavelenath(A) Wavetenqtti(A)
Fig. 5. Effect of Power with 0.9L of Sample Carrier Gas Flow Rate, 14L of Cooling Gas, and 24 mm of sampling
depth on Emission Intensity, a) Zn(II) 2062.00A, b) Zn(I) 2138.56A, c) Mn(II) 2576.10A, d) Mn(I) 2794.82A, e) Cu(II)
2247.00A, f) Cu(I) 3247.54A, g) Ca(II) 3933.66A, and h) Ca(I) 4226.73A.
李桂浩•金亨昇•吉孝植• Gary M. Hieftje
190
would be greatly affected by the orifice size while hard lines such as Cu(II) and Zn(II) would not. In addition, signal-to-background ratios with 3.5 mm of orifice size was better than that with 2.5 mm of orifice size, and thus 3.5 mm of orifice size was used throughout the experiment.
The easily ionized element (EIE) effects in a flame and de arc plasma are well known. The enhancement effect for the neutral atom line in a flame has been rationalized on the basis of a shift in the ionization equilibrium of the analyte atom, ion, and electrons. The degree of enhancement has been shown to be a function of the ionization potential of the added EIE. In a de arc, the addition of an EIE changes the excitation conditions in the arc plasma. The addition of an EIE into an arc
causes an increase in electron density and essentially res
니ts in a decrease in arc temperature and no change in thermal conductivity. This leads to a shift in the ionization equilibrium and an increase in residence time of the analyte species in the arc.
Thus, the combined effects produce either suppres
sion or enhancement of the emission intensities depending upon the types of the species and on the excitation energies needed to excite the analyte species.
Although a radial-viewed ICP-AES has been known to be less susceptible to EIE effects, an axial-viewed ICP-AES is susceptible to EIE effect.
This is why the dual types of radial- and axial- viewed ICP are commercialized by several ICP manufacturers. As shown in Fig. 6 a), 6 b), 7 a),
Amsu2
-
으
u 응
11 은? 2
드
e2—
1
"
76
1
Ca(l)4227.00A,700W
26000
25000-
24000-
23000-
Ca(l)4227.00A,800W
22000-
21000-
20000■ ill''
4225.5 4226 4226.5 4227 4227.5 시228 4228.5 Wavelength(A)
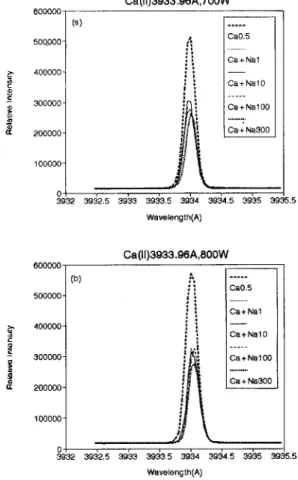
Fig. 6. The Influence of Na with 0.9L of Sample Car
rier Gas Flow Rate, and 14L of Cooling Gas on Ca(I) Emission Intensity, a) 700W, and b) 800W.
A- su s
드 e
>
= 끄 0, tt
르 됴 드 을 ,"
- 쓰
」
Fig. 7. The Influence of Na with 0.9L of Sample Car
rier Gas Flow Rate, and 14L of Cooling Gas on Ca(II)
Emission Intensity, a) 700W, and b) 800W.
새로운 글로우 방전/유도결합 플라스마 장치(GD/ICP Interface)에 대한 기초 연구
191 and 7 b), suppressions for both Ca(I) and Ca(II)
were observed by adding Na, but the degree of suppressions wo
니d not be affected by the amount of Na added. The EIE effects observed in this study would not agree with the others, and thus the further investigation would be taken.
The detection limits of Cd(I) 228.8 nm, Mn(II) 257.61 nm, and Fe(II) 259.95 nm were observed 3.86, 1.49, and 5.79 ppb, respectively. And lineali
ties of the calibration curves were measured to be unity.
CONCLUSION
In this study, GD/ICP-AES quick change over system has been developed and preliminary results are presented in this paper. This study has shown that the GD/ICP-AES quick change over system shows promise for a new analytical instrument for atomic emission spectroscopy. In deed, it takes less than 15 min. to change from GD-AES to ICP- AES without moving optics and vise versa. As a result, solid sample as well as liquid sample could be analyzed in a relatively
아}ort period of time by using GD/ICP-AES quick change over system.
The cost of the GD/ICP-AES quick change over system would be inexpensive since there is only one monochromator and optics.
In this preliminary investigation when several experimental parameters such as coolant gas flow rate, auxiliary gas flow rate, cutting gas flow rate, orifice size of sampling cone, and rf power were varied, the emission intensities reflected many of characteristics associated with the axial-viewed ICP-AES. 14 L of coolant gas flow rate, 0.9 L of sample carrier gas flow rate, 3.5 mm LD. of orifice size of sampling cone, and 800 W of rf power were found to be optimum experimental conditions for GD/ICP-AES quick change over system developed in this laboratory. However, the ionization interference effects observed by adding Na are not the same as those observed in a commercial axial-viewed ICP-AES, and thus further investigation is undertaken. The analytical results such as detection limits, linear dynamic
range, and long- and
아lort-tem stability were found to be comparable to those of the commercial axial-viewed ICP-AES.
The basic principles of GD/ICP-AES quick change over system could be applied to GD/ICP- mass spectrometer system. In addition, secondary discharge effect generated between a copper sampl
ing cone and plasma would be investigated in the future. It is evident that emission intensity could be greatly enhanced by a secondary discharge generated between a sampling cone and plasma.
Furthermore, the plasma diagnostics such as the effect of excitation temperature, electron density, and chemical interference effect will be investigat
ed near future in our laboratory.
Acknowledgement. This paper was accompli
shed with Research Fund provided by Korea Research Foundation, Support for Faculty Research Abroad.
REFERENCES
1. Carre, M.; Diaz de Rodriguez, D.; Mermet, J. M.;
Bridenne, M.; Marot, Y. J. Anal. At. Spectrom,
1991, 6, 49.2. Darke, S. A.; Tyson, J. F. J. Anal. At. Spectrom.
1993, 8, 145.
3. Hieftje, G. M.; Norman, L. A. Adv. Mass Spectrom.
1992, 12, 519.
4. Raith, A.; Hutton, R. C.; Huneke, J. C. J. Anal. At.
Spectrom. 1993, 8, 867.
5. Leis, F.; Broekaert, J. A. C.; Steers, E. B. M. Spec-
trochem. Acta. 1991, 46B, 243.6. Shi, Z.; Woodrum, T. H.; Dehghan, K.; Brewer, S.;
Sacks, R. Appl. Spectrosc. 1992, 46, 749.
7. Kumiawan, H.; Kobayashi, T.; Kagawa, K. Appl.
Spectrosc. 1992, 46, 581.
8. Richner, P.; Borer, M. W.; Brushwyler, K. R.;
Hieftje, G. M. Appl. Spectrosc. 1990, 44, 1290.
9. Quentmeiner, A.; Sdorra, W.; Niemax, K. Spec-
trochim. Acta 1990, 45B, 537.10. Tseng, J. L.; Williams, J. C.; Bartlow, R. B.; Grif
fin, S. T.; Williams Jr., J. C. Anal. Chem. 1991, 63, 1933.
11. Mixon, P. D.; Griffin, S. T.; Williams, J. C. Appl.
Spectrosc. 1993, 47, 1567.
192
李桂浩,金亨昇•吉孝植• Gary M. Hieftje12. Saito, M.; Hirose, F.; Okochi, H. Analytical Sci
ences, 1995, 11, 4.
13. Rezchikov, V. G.; Kuznetsova, T. S. Journal of
Analytical Chemistry, 1996, 51, 4.14. Olson, L.; Caruso, J. J. Anal. At. Spectrom. 1993, 7, 993.
15. Shen, W.; Davidson, T.; Creed, J.; Caruso, J. Appl.
Spectrosc. 1990, 44, 1003.
16. Gehlhausen, J. M.; Carnahan, J. W. Anal. Chem.
1991, 63, 2430.
17. Coleman, G. N.; Miller, D. E.; Starek, R. W. Am
erican Laboratory, 1998, 30, 4.