Synthesis of Nickel and Copper Nanopowders by Plasma Arc Evaporation
Young-Sang Cho *, Jong Woo Moon
a, Kook Chae Chung
a, and Jung-Goo Lee
aDepartment of Chemical Engineering and Biotechnology, Korea Polytechnic University, 237, Siheung-si, Gyeonggi-do 429-793, Korea
aDivision of Powder and Ceramics, Korea Institute of Materials Science, 66 Sangnam-dong, Changwon Kyungsang-Namdo 641-831, Korea
(Received September 16, 2013; Accepted December 11, 2013)
···
Abstract In this study, the synthesis of nickel nanoparticles and copper nanospheres for the potential applications of MLCC electrode materials has been studied by plasma arc evaporation method. The change in the broad distribution of the size of nickel and copper nanopowders is successfully controlled by manifesting proper mixture of gas ambiance for plasma generation in the size range of 20 to 200 nm in diameter. The factors affecting the mean diameter of the nan- opowder was studied by changing the composition of reactive gases, indicating that nitrogen enhances the formation of larger particles compared to hydrogen gas. The morphologies and particle sizes of the metal nanoparticles were observed by SEM, and ultrathin oxide layers on the powder surface generated during passivation step have been confirmed using TEM. The metallic FCC structure of the nanoparticles was confirmed using powder X-ray diffraction method.
Keywords: Plasma Arc Evaporation, Metal Nanoparticles, Powder Technology
···
1. Introduction
The synthesis of metallic nanoparticles has attracted great attention for the researches of conductive nanoparti- cle inks in ink-jet technologies, magnetic recording mate- rials with nanometer-sized grains, electrode materials for MLCC (Multi-Layered Ceramic Capacitor) applications, optoelectronic materials such as sensors using localized surface plasmon resonance, and catalytic materials by active metallic species [1-5]. Among them, the use of metal nanoparticles as source materials for the conduc- tive inks has received growing interests in the field of nanoscience and nanotechnology, since metallic nanopar- ticles with proper size and distribution can be used as ink materials for sophisticated processes such as direct ink writing technology [6]. Synthesis of metal nanopowders of copper or nickel has been also intensively studied for the applications of internal electrode materials of MLCC after the formulation step by mixing the powders and suitable additives for the fabrication of pastes [7].
Until now, various efforts have been made for the syn-
thesis of metal nanopowders. For instance, wet chemical processes such as coprecipitation or microemulsion method and chemical reduction such as polyol process have been studied intensively due to their facile natures and low processing costs [8-10]. However, the purity of the pre- pared nanoparticles by wet chemical process is relatively low, compared to vapor-phase synthesis methods such as plasma-assisted methods or spray pyrolysis technologies [11-12]. Solid state synthesis approaches for nanopow- ders have been also studied including high energy ball milling techniques as top-down manner [13]. However, it is difficult to control the size of the crushed particles less than micron range due to the intrinsic limitation of such milling processes. Thus, for the synthesis of ultrafine metallic nanoparticles which require high purity and nanometer sizes, it can be advantageous to synthesize the nanoparticles in a controlled manner by proper vapor- phase synthesis methods.
Various types of vapor-phase synthesis routes have been developed for the synthesis of metallic nanoparti- cles including thermal plasma, vapor condensation, and
*Corresponding Author : Young-Sang Cho, TEL: +82-31-8041-0612, FAX: +82-31-8041-0629, E-mail: [email protected]; [email protected]
<PM리뷰>
412 Young-Sang Cho, Jong Woo Moon, Kook Chae Chung, and Jung-Goo Lee
ultrasonic pyroysis method. Among them, plasma-assisted methods such as plasma arc evaporation can be an effi- cient way for the synthesis of metallic nanoparticles since the approaches do not require post processing step such as annealing for the removal of impurities and further crystallization of the nanoparticles [14]. In addition, vari- ous bulk metals can be used as raw materials for the fab- rication of many metallic nanoparticles with economic and environmentally friendly way. However, the control of particle sizes of transition metal nanopowders has been rarely studied systemically and it can be a still chal- lenging research area in the field of nanoparticle synthe- sis.
In this research, nickel nanoparticles were synthesized by plasma arc discharge (PAD) method. The obtained pure metallic nanoparticles were characterized by SEM, TEM, and XRD. Gas compositions inside chamber were studied as the factors affecting the size of nickel nanopar- ticles by the examination of the particle size changes.
Pure argon, mixed gas of argon/hydrogen or argon/nitro- gen was used for the evaporation of metal vapor inside chamber, and the resultant change of the size of nanopar- ticles was studied. Nickel nanoparticles with narrow size range from 10 to 70 nm synthesized using PAD appara- tus and the nanopowders were stabilized by covering the particle surface with thin oxide layer by applying passi- vation gas inside the PAD chamber. Copper nanospheres were also synthesized by plasma arc evaporation, and the factors affecting the particle size have been studied for the potential use as internal electrode material in MLCC application.
2. Experimental Procedures
As source materials of nickel nanoparticles and copper nanospheres, ultrapure nickel granule (99.99%, 3-10 mm in diameter) and copper ball (99.9%, 3 mm in diameter) were purchased from Kojundo Kagaku (Japan).
Nickel nanoparticles or copper nanospheres were syn- thesized using plasma arc discharge (PAD) apparatus as displayed schematically in Fig. 1a. For the synthesis of metallic nanoparticles, plasma arc evaporation method can be classified as gas phase synthesis approach, which utilizes arc current, input voltage, and the compositions of gas mixture inside chamber for the control of the size
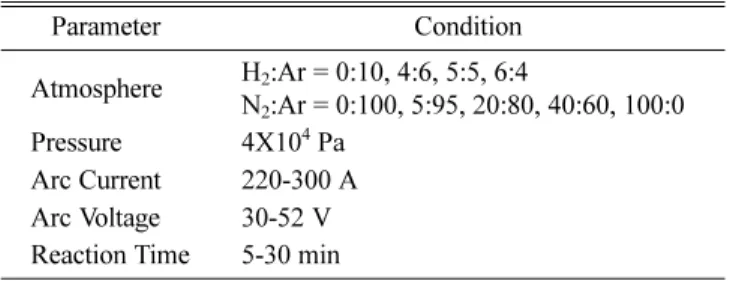
of the nanoparticles. In this research, the experimental conditions are summarized in Table 1. The PAD cham- ber was first evacuated using vacuum pump after the loading of the nickel granules or copper balls as source materials on the hearth inside the chamber. Under suffi- cient vacuum condition, proper amount of hydrogen/
argon or nitrogen/argon gas mixture were fed into the Fig. 1. (a) The schematic figure of apparatus for the synthesis of metallic nanoparticles using plasma arc discharge (PAD).
(b) Photograph of PAD apparatus. (c) The schematic figure for the formation process of metallic nanoparticles by plasma arc evaporation. The inset figure shows the photograph of plasma arc generated using mixed gas of hydrogen and argon.
chamber, followed by the generation of plasma arc between the tungsten gun and the source materials by supplying electric current to the PAD apparatus. Then, the metal nanopowder was formed after the condensa- tion of the evaporated metal vapor inside the apparatus, which was cooled by water fed to the jacket. The surface of metal nanoparticles was protected by thin oxide layers after the passivation by feeding the gas mixture com- posed of 10% of oxygen and 90% of argon. The obtained nanoparticles were collected for further characterizations.
Field emissions scanning electron microscope (FE- SEM, Hitachi S4700) was used for the observation of the morphologies of nickel and copper nanoparticles. The particle size distributions of the metal nanopowders were obtained by measuring the diameters of particles (more than 100 particles) from the SEM images. The elemental compositions of metal nanopowders were measured by EDS (Energy Dispersive X-ray Spectroscopy) technol- ogy. The morphologies of nanopowders and thin oxide layers on the nanoparticle surfaces were observed and confirmed by field emission transmission electron micro- scope (FE-TEM, JEM 2100F). The crystallinity of nickel nanoparticles or copper nanospheres was checked by powder X-ray diffraction apparatus (D-Max 2200). The purity of the metal nanopowders such as nickel and cop- per was analyzed using ICP-AES (Inductively Coupled Plasma Atomic Emission Spectrometer, Liberty RL).
3. Results and Discussions
For the synthesis of metal nanopowders by plasma arc evaporation, reactive gases such as hydrogen or nitrogen can be used as plasma gases since such molecules can be dissociated into atomic species and dissolved into bulk source materials of molten metal inside chamber at high
temperature. Since the temperature of the molten metal is not sufficiently high to maintain the nitrogen or hydro- gen as atomic state, the recombination of such atoms into gaseous molecules can be expected, and forced evapora- tion of the molten metal can be induced by the evapora- tive flux of the gas molecules, since the following reactions are exothermic at the melting point of source metal such as nickel.
H + H → H2, ∆H = -402.181 kJ/kmol (1) N + N → N2, ∆H = -958.383 kJ/kmol (2) The change of enthalpies (∆H) can be calculated by thermodynamic data from the literatures reported else- where [3, 15-16]. The evaporated metal can be con- densed after cooling the chamber resulting in the formation of metal nanopowders. In this study, we have adopted two reactive gases such as hydrogen or nitrogen for the synthesis of high-purity nickel nanoparticles or copper nanospheres by plasma arc evaporation.
3.1. Synthesis of Nickel Nanoparticles Using Gas Mixture of Hydrogen and Argon
Fig. 2a to 2c show the typical SEM images of nickel nanoparticles synthesized by plasma arc evaporation using 40, 50, and 60% of hydrogen gas with balanced amount of argon for the generation of plasma arc from tungsten gun. The applied arc current and input voltage was 300 A and 30 to 33 V, respectively. The applied power can be calculated by simply multiplying the applied current and input voltage, resulting in the value of 9.45 kW. The spherical morphology of the resultant nickel nanoparticles can be confirmed from the SEM images and the mean diameter of the particles is ranged from 30 to 40 nm in diameter, as displayed in the histo- gram of Fig. 2d to 2f, indicating that the effect of hydrogen fraction inside chamber was almost negligible on the size variation of nickel nanoparticles under the condition of 9.45 kW of input power. However, the necking or aggregation of individual nickel particles was observed for the sample shown in the SEM image of Fig. 2c.
To confirm the effect of hydrogen gas on the particle size of nickel nanoparticles, the input power was increased as 10.89 kW by applying 220 A of arc current and 47 to 52 V of input voltage. Fig. 3a to 3c show the SEM images of resultant nickel nanopowders synthe- Table 1. The synthesis conditions of metal nanopowders using
plasma arc evaporation
Parameter Condition
Atmosphere H2:Ar = 0:10, 4:6, 5:5, 6:4
N2:Ar = 0:100, 5:95, 20:80, 40:60, 100:0 Pressure 4X10⁴ Pa
Arc Current 220-300 A Arc Voltage 30-52 V Reaction Time 5-30 min
414 Young-Sang Cho, Jong Woo Moon, Kook Chae Chung, and Jung-Goo Lee
Fig. 2. SEM images of nickel nanoparticles synthesized using mixed gas of hydrogen and argon inside PAD chamber. (a) H2:Ar
= 4:6, (b) H2:Ar = 5:5, and (c) H2:Ar = 6:4. Scale bars indicate 100 nm. (arc current = 300 A, input voltage = 30 to 33 V) (d) to (f) Particle size distribution of nickel nanoparticles shown in Fig. 2a to 2c.
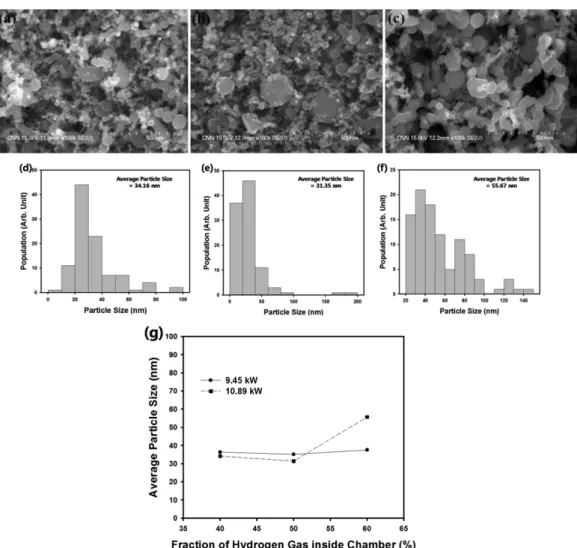
Fig. 3. SEM images of nickel nanoparticles synthesized using mixed gas of hydrogen and argon inside PAD chamber. (a) H2:Ar
= 4:6, (b) H2:Ar = 5:5, and (c) H2:Ar = 6:4. Scale bars indicate 500 nm. (arc current = 220 A, input voltage = 47 to 52 V) (d) to (f) Particle size distribution of nickel nanoparticles shown in Fig. 3a to 3c. (g) Average diameter of nickel nanoparticles shown in the SEM images of Fig. 2 and Fig. 3 as a function of the amount of hydrogen gas inside PAD chamber.
sized using 40, 50, and 60% of hydrogen gas with bal- anced amount of argon inside chamber. Fig. 3d to 3f show the particle size distribution of nickel nanoparticles shown in the SEM images of Fig. 3a to 3c, and the aver- age size of the nanoparticles is plotted as a function of the fraction of hydrogen gas inside the chamber, as dis- played in the graph of Fig. 3g. The graph also shows the size variation of nickel nanoparticles shown in the SEM images of Fig. 2a to 2c for the comparison of the effect of applied power for PAD apparatus. According to Fig.
3g, the average particle size of nickel nanoparticles increased by increasing the amount of hydrogen gas when the input power increased from 9.45 to 10.89 kW, indicating that the hydrogen gas affects the size of nickel nanoparticles under the critical value of input power. The effect of hydrogen gas on the particle size of nickel nano- particles can be interpreted by the mechanism of hydro- gen dissolution and effusion during plasma arc evaporation process [17]. Hydrogen molecules can be dissociated into hydrogen atoms inside PAD chamber at high tempera- ture, and the reactive hydrogen atoms can be diffused into bulk metal of nickel. The recombination of isolated gas atoms generates thermal energy sufficient to gener- ate metal effluent, thereby enhancing evaporation pro- cess according to following reaction:
H + H + M → H2 + M* (3)
The active metal species (M*) can be condensed into metallic nanoparticles, and the increased amount of hydrogen gas inside the chamber facilitates the forma- tion of larger metal nanopowders, as shown in the graph of Fig. 3g.
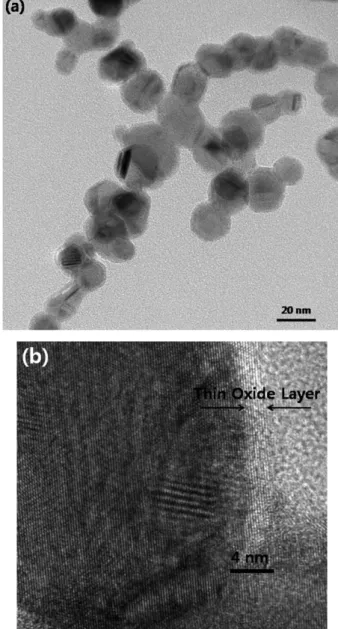
Fig. 4a and 4b show the TEM images of the nickel nanoparticles which were synthesized using 60% of hydrogen gas inside PAD chamber. The spherical mor- phologies can be also confirmed from the TEM image of Fig. 4a, as already displayed in the SEM image of Fig.
2a. The surface oxidation state of each particle can be observed from more magnified TEM image of Fig. 4b.
Since metallic nanoparticles are highly combustive when exposed to atmosphere, a surface passivation in terms of ultra thin oxide layer is formed on the metal nanoparti- cles inside the PAD chamber. For this purpose, we have treated the nickel nanoparticles with the gas mixture of oxygen and argon for the generation of thin oxide layer
on the nickel nanoparticle surface, as can be confirmed from the TEM image of Fig. 4b. The thickness of the surface oxide layer could be measured to be about 2 to 3 nm, as noted in the TEM image of Fig. 4b.
The elemental compositions of the nickel nanoparti- cles shown in the SEM images of Fig. 2a to 2c are con- tained in the EDS spectrums of Fig. 5a to 5c. 7 to 13.6 wt.% of oxygen was detected due to the surface oxide layer of the nickel nanoparticles during the passivation process. Fig. 5d shows the powder X-ray diffraction results of nickel nanoparticles shown in the SEM images Fig. 4. (a) TEM image of nickel nanoparticles synthesized using mixed gas of hydrogen and argon. Scale bar indicates 20 nm. (b) Magnified TEM image of the nickel nanoparticles with ultrathin oxide layer on the surface. Scale bar indicates 4 nm.
416 Young-Sang Cho, Jong Woo Moon, Kook Chae Chung, and Jung-Goo Lee
of Fig. 2a to 2c. As can be observed from the peaks in the graph, the crystallinity of nickel nanoparticles was confirmed as almost pure metallic nickel. The metallic FCC crystal structure of nickel nanoparticles was main- tained after the change of the composition of the gas mixture inside PAD chamber with the hydrogen concen- tration of 40 to 60%.
3.2. Synthesis of Nickel Nanoparticles Using Gas Mixture of Nitrogen and Argon
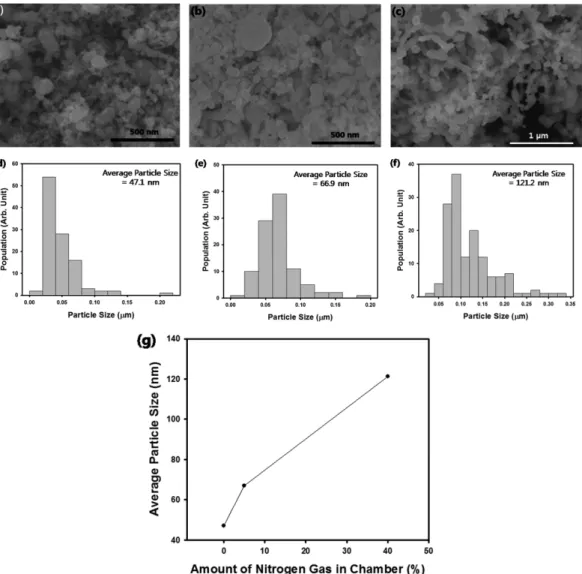
To increase the average diameter of nickel nanoparti- cles, nitrogen gas was introduced instead of hydrogen inside PAD chamber. The synthesis conditions were 220 A of arc current and 36 to 50 V of voltage. Fig. 6a, 6b, and 6c show the typical SEM images of nickel nanoparti- cles synthesized using pure argon, 5% nitrogen with 95%
argon, and 40% nitrogen with 60% argon gas inside PAD chamber. As shown in the particle size distribution graphs shown in Fig. 6d to 6f, the average particle size increased with increasing amount of nitrogen inside PAD chamber. Since nitrogen gas can be dissociated into nitro- gen atoms under plasma and diffused into the molten metal of bulk nickel as source material of nanopowder,
the increment of nitrogen fraction inside PAD chamber can increase the dissolution rate of nitrogen atoms inside bulk nickel. Since the recombination of the dissolved nitrogen atoms induces the forced evaporation of nickel at elevated temperature, the increase of nitrogen fraction inside the chamber can enhance the formation of nickel nanopowder after condensation of the metal vapor. This trend can be confirmed from the graph of Fig. 6g, which shows the average particle size of nickel nanoparticles as a function of the amount of nitrogen gas inside PAD chamber. As displayed in Fig. 6g, the average diameter of nickel nanoparticles increased from 47.1 to 121.2 nm by increasing the amount of nitrogen gas from 0 to 40%
inside PAD chamber.
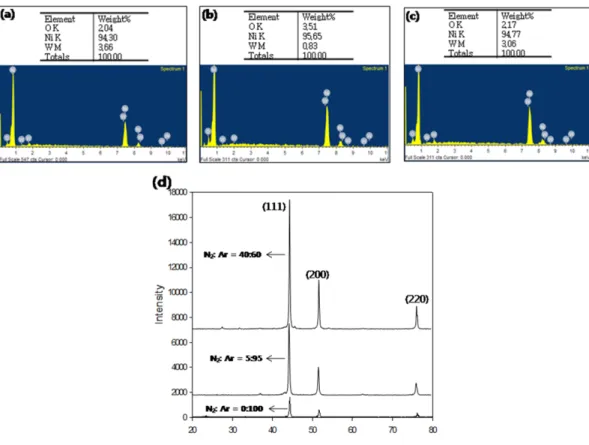
The elemental compositions of nickel nanoparticles shown in Fig. 6a to 6c were confirmed and the results are shown in the EDS spectrums of Fig. 7a to 7c. Each sam- ple was composed of majority of nickel and slight amount of oxygen was detected as 2 to 3.5 wt.%, imply- ing that thin oxide layers were formed on the surface of nickel nanoparticles during the passivation process. The crystalline structure of each sample was also analyzed using powder X-ray diffraction method as displayed in Fig. 5. (a) to (c) EDS results of the nickel nanoparticles shown in the SEM images of Fig. 2a to 2c. (d) XRD results of the nickel nanoparticles shown in the SEM images of Fig. 2a to 2c.
Fig. 7d. Strong (111), (200), and (220) peaks can be con- firmed from the XRD data, and metallic FCC structure was confirmed from each nanoparticle sample.
3.3. Synthesis of Copper Nanospheres Using Gas Mixture of Hydrogen and Argon
Micron-sized copper powders are currently used as external electrode materials of MLCC. For the applica- tion of copper powders as internal electrode materials of MLCC, the diameter of particles should be less than sev- eral hundred nanometers for the purpose of low tempera- ture sintering, and the agglomeration between particles should be avoided [18]. Thus, the synthesis of copper nanospheres was studied for non-agglomerated spherical morphologies with 100 to 200 nm in diameter. I this
study, we have studied the experimental parameters to control the mean diameter of copper nanospheres by plasma arc evaporation. At first, the amount of hydrogen mixed with argon gas was changed to observe the varia- tion of mean diameter of copper nanospheres. The oper- ating conditions of the apparatus were 220 A of arc current and 47 to 52 V of input voltage. Fig. 8a to 8d show the SEM images of copper nanospheres synthe- sized using 0, 40, 50, and 60% of hydrogen with bal- anced amount of argon gas inside PAD chamber, respectively. It is clear that the morphologies of each copper nanosphere are almost spherical with little agglomeration of particles as displayed in the SEM images. The size distributions of each nanoparticle sam- ple are shown in the histogram of Fig. 8e to 8h. As the Fig. 6. (a) to (c) SEM images of nickel nanoparticles synthesized using mixed gas of nitrogen and argon inside PAD chamber. (a) N2:Ar = 0:100, (b) N2:Ar = 5:95, and (c) N2:Ar = 40:60. Scale bars indicate 500 nm for Fig. 5a and 5b, and 1 µm for Fig. 5c. (arc current = 220 A, input voltage = 36 to 50 V) (d) to (f) Particle size distribution of nickel nanoparticles shown in Fig. 6a to 6c. (g) Average diameter of nickel nanoparticles as a function of the amount of nitrogen gas inside PAD chamber.
418 Young-Sang Cho, Jong Woo Moon, Kook Chae Chung, and Jung-Goo Lee
amount of hydrogen gas is increased during the synthe- sis process, the mean diameter of copper nanospheres was increased due to increasing number of large parti- cles as displayed in the graphs of Fig. 8e to 8h. The dependence of the mean diameter of copper nanospheres is plotted as a function of hydrogen fraction inside cham- ber, as displayed in the graph of Fig. 8i. The change of the size of copper nanospheres can be explained by the mechanism of hydrogen dissolution and effusion, simi- larly with the case of nickel nanopowders.
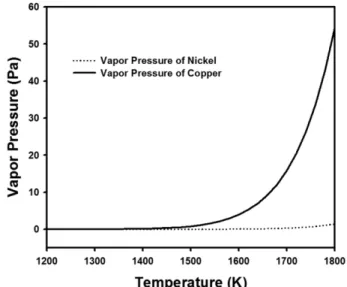
As can be observed from the SEM images of Fig. 8a to 8d, the mean diameter of copper nanospheres was larger than the size of nickel nanoparticles under the same syn- thesis conditions using mixed gas of hydrogen and argon, shown in the SEM images of Fig. 2a to 2c. This can be explained by the difference of evaporation rate (J) of metallic elements such as nickel and copper, which can be expressed by the following equation [11].
(4)
In the above equation, α, P, M, and T represent con-
densation coefficient, vapor pressure, molar mass of metallic elements and temperature, respectively. Since the vapor pressure of nickel and copper at 1800 K are 1.3674 and 54.3946 Pa, respectively, as shown in the graphs of Fig. 9, which were obtained by applying Clapeyron equa- tion, the evaporation of copper melt is much larger than that of nickel, causing the formation of larger particles after the condensation of the metal vapor [19].
The morphologies of copper nanospheres synthesized using the mixed gas of hydrogen and argon was also observed using TEM, and the results are shown as the microscope images of Fig. 10a to 10c. As shown in the TEM images of Fig. 10a and 10b, the particle shapes are close to spheres having thin oxide layers which exist on the surface of the metal nanospheres, since oxidation occurs during the passivation step. The thickness of the surface oxide layer was measured as 2 to 3 nm as noted in the magnified TEM image of Fig. 10c. The surface oxide layers can be advantageous to the surface modifi- cation of the copper nanospheres with various kinds of surface modifiers such as silane or titanate coupling agents for dispersing the metal nanospheres in organic J∞1.57αP M
---T
Fig. 7. (a) to (c) EDS results of the nickel nanoparticles shown in the SEM images of Fig. 6a to 6c. (d) XRD results of the nickel nanoparticles shown in the SEM images of Fig. 6a to 6c.
solvents such as alcohol since alcoholysis reaction can be expected on the surface of the nanopowders [20]. Thus, the copper nanospheres in this study can be used as addi- tives of lubricant oils with enhanced friction properties and thermal conductivity [21]. Fig. 10d shows the elec- tron diffraction pattern of the copper nanospheres synthe-
sized using the mixed gas of nitrogen and argon inside PAD chamber. The diffraction of electrons from the metal nanospheres in random positions may cause sev- eral diffraction spots shown in Fig. 10d.
For the application of copper nanospheres as MLCC electrode materials, it is necessary to minimize the thick- ness of surface oxide layer. Thus, the study on the con- trol of oxide layer thickness will be important by changing the concentration of oxygen gas inside PAD chamber during passivation step, and it will be our next research topic in the future.
The crystallinity of the copper nanospheres shown in the SEM images of Fig. 8a to 8d were also confirmed using powder X-ray diffraction method and the resultant diffraction peaks are contained as the graphs of Fig. 11a.
As shown in the graphs, the diffraction peaks can be assigned as (111), (200), and (220) planes of metallic FCC structure for the samples obtained using pure argon, 40, 50, and 60% of hydrogen with balanced amount of argon gas. The crystallite size of the copper nanospheres can be predicted using the following Scherrer’s formula from X-ray diffraction peaks [22].
(5)
In the above equation λ, B, and θB represent the wave- length of X-ray, FWHM (Full Width at Half Maximum) of diffraction peak, and the diffraction angle at maxi- mum diffraction intensity, respectively. From the (111)
t 0.9λ BcosθB
---
= Fig. 8. SEM images of copper nanospheres synthesized using
mixed gas of hydrogen and argon inside PAD chamber. (a) H2:Ar = 0:10, (b) H2:Ar = 4:6, (c) H2:Ar = 5:5, and (d) H2:Ar
= 6:4. Scale bars indicate 500 nm for (a) to (b) and 1 µm for (c) and (d), respectively. (arc current = 220 A, input voltage = 47 to 52 V) (e) to (h) Particle size distribution of copper nanospheres shown in Fig. 8a to 8d. (i) Average diameter of copper nanospheres as a function of the amount of hydrogen gas inside PAD chamber.
Fig. 9. The dependence of vapor pressure of copper and nickel as a function of temperature.
420 Young-Sang Cho, Jong Woo Moon, Kook Chae Chung, and Jung-Goo Lee
peak of XRD graph, the crystallite (t) was calculated using Scherrer’s formula as 32.3 nm for the copper nano- spheres synthesized using pure argon gas inside PAD chamber. This is smaller value than the average particle size of copper nanospheres (71.14 nm) shown in the SEM images of Fig. 8a, implying that the copper nano- spheres are generated from the aggregation and growth of small primary crystallites and suggesting that poly- crystalline nanospheres could be formed during synthe- sis procedure. Actually, the precise measurement of
crystallite size using Scherrer’s formula is limited to the size less than 100 nm since the change of FWHM from XRD peaks is negligible for the crystallites larger than 100 nm [23].
The intensity of (111) peak increased by increasing the fraction of hydrogen gas inside PAD chamber, as dis- played in the graph of Fig. 11b. The dependence of crys- tallinity of the metallic nanoparticles was linearly proportional to the fraction of hydrogen gas inside the chamber, implying that hydrogen induces the increase of crystal- Fig. 10. (a) and (b) TEM images of copper nanospheres synthesized using mixed gas of hydrogen and argon. Scale bars are 20 nm. (c) Magnified TEM image of the nickel nanoparticles with ultrathin oxide layer on the surface. Scale bars indicate 10 nm.
(d) electron diffraction pattern of copper nanoparticles.
Fig. 11. (a) XRD results of the copper nanospheres shown in the SEM images of Fig. 8a to 8d. (b) Intensity of (111) peaks as a function of the fraction of hydrogen mixed with argon gas inside PAD chamber.
lite size of the copper nanospheres.
3.4. Synthesis of Copper Nanospheres Using Gas Mix- ture of Nitrogen and Argon
To synthesize copper nanospheres larger than 200 nm, we have introduced nitrogen gas mixed with argon inside PAD chamber for the generation of plasma. Fig. 12a to 12c show the typical SEM images of copper nano- spheres with photographs of arc discharge under the con- ditions of 20, 40, and 100% nitrogen gas inside PAD chamber during the synthesis process. As increasing the amount of reactive nitrogen gas, the gaseous mixture inside the chamber became more opaque, indicating that the generation rate of copper vapor increased, as shown
in the photographs of Fig. 12a to 12c. Increasing amount of copper vapor resulted in the formation of larger cop- per nanospheres as displayed in the SEM images of Fig.
12a to 12c. The mean diameter of copper nanospheres is closely related with the mean free path (λ) of the copper vapor, which can be expressed as the following equation [3, 24].
(6)
In the above equation, d and n stand for the diameter and concentration of metal vapor molecule, respectively.
As the mean free path of metal vapor decreased with increasing amount of reactive nitrogen gas inside cham-
λ 1
2π 2d( )2n ---
=
Fig. 12. (a) to (c) SEM images of copper nanospheres synthesized using mixed gas of nitrogen and argon inside PAD chamber.
The inset figures show the photographs of plasma arc observed during the powder synthesis process. (a) N2:Ar = 2:8, Scale bar indicates 1 µm. (b) N2:Ar = 4:6, and (c) N2:Ar = 10:0. Scale bars indicate 2 µm. (arc current = 220 A, input voltage = 36 to 50 V) (d) to (f) Particle size distribution of copper nanospheres shown in Fig. 12a to 12c. (g) Average diameter of copper nanospheres as a function of the amount of nitrogen gas inside PAD chamber.
422 Young-Sang Cho, Jong Woo Moon, Kook Chae Chung, and Jung-Goo Lee
ber, the collision frequency of the metal vapor increases, resulting in the increase of the nucleation rate of copper nanoparticles. Thus, the size of the copper nanospheres increased as increasing amount of nitrogen inside cham- ber, as displayed in the size distribution graphs of Fig.
12d to 12f.
The morphologies of copper nanospheres were nearly spherical and the agglomeration of the nanospheres was rarely observed. The particle size distributions of copper nanospheres for each sample are shown in the histo- grams of Fig. 12d to 12f, and the mean diameter of the metallic nanospheres increased from 110 to 220 nm by increasing the amount of nitrogen from 20 to 100%
inside PAD chamber. Although the polydisperse nature can be observed from the SEM images unlike the parti- cles prepared via wet chemical synthesis route, the size distributions are monomodal and the necking or fusion between the particles could be rarely found. The change of the size of copper nanospheres is also summarized as a function of the amount of nitrogen gas in the graph of Fig. 12g, indicating that the average diameter of nano- spheres can be tuned from 110 to 220 nm. (The data
point from condition of pure argon gas was obtained by measuring the average particle size of copper nano- spheres shown in the SEM image of Fig. 8a).
The elemental compositions of copper nanospheres shown in the SEM images of Fig. 12a to 12c are con- firmed using EDS, and the results are contained in Fig.
13a to 13c. Only trace amount of oxygen (about 1 to 3%) was detected due to thin oxide layer on the sur- face of copper nanospheres formed during passivation process. The crystalline structure of each sample was analyzed using powder X-ray diffraction technique as displayed in the graphs of Fig. 13d, and the metallic FCC structure was observed without any diffraction peaks associated with copper oxide, implying that the ultrathin oxide layers on the particle surface make little contribution on the crystalline structure of the copper nanospheres. Although small amount of oxygen was detected from EDS analysis results in Fig. 13a to 13c, only metallic XRD peak was detected from the powder samples, implying that the metallic nature of our sam- ple is enough. However, additional thermogravimetric analysis will be required for the composition analysis of
Fig. 13. (a) to (c) EDS results of the copper nanospheres shown in the SEM images of Fig. 12a to 12c. (d) XRD results of the copper nanospheres shown in the SEM images of Fig. 12a to 12c.
the powder samples, which can be the next topic of our research.
3.5. The Purity of Nickel and Copper Nanopow- ders Synthesized by Plasma Arc Evaporation
The purity of nickel and copper nanopowders synthe- sized using mixed gas of hydrogen and argon (H2:Ar = 5:5) inside PAD chamber was analyzed using ICP-AES, and the results are summarized in Table 2. The metal nanopowders were synthesized under 220 A of applied current and 47 to 52 V of input voltage. As shown in the analysis data, small amount of metal elements such as Fe, B, and Si were detected as impurity materials. However, extremely small quantities of impurity metals were observed in ppm level, indicating that the metal nanopo- wders such as nickel and copper synthesized by plasma arc evaporation are highly pure with more than 99.9% of purity. Thus, plasma arc evaporation method can be an efficient route for the synthesis of pure metal nanopow-
ders. The purity data of nickel and copper nanopowders synthesized using nitrogen and argon gas were also listed in Table 3, indicating that the purity of each metal nano- particle is comparable to the powder samples obtained using mixed gas of hydrogen and argon with more than 99.7% of purity. Sometimes, impurity element such as W was detected possibly due to the partial melting of tung- sten gun during the formation of plasma arc at high tem- perature.
4. Conclusions
In this study, nickel nanopartilcles or copper nano- spheres were synthesized by plasma arc discharge (PAD) method using reactive hydrogen or nitrogen gas. The metallic nanopowders were fabricated by applying plasma arc to bulk nickel or copper source materials, fol- lowed by the evaporation of metal and precipitation of the nanoparticles inside PAD chamber. After the synthe- sis, the surface of nanopowders was stabilized by the passivation of the particle surface using mixed gas of oxygen and argon, for the generation of thin oxide layer as coating film. The size and morphology of the nanopo- wders were characterized by SEM and TEM, and the crystallinity of the metal nanoparticles was also con- firmed as metallic FCC structure by powder X-ray dif- fraction method. The factors affecting the mean diameter of the nanopowder was studied by changing the composi- tion of reactive gases, indicating that nitrogen enhances the formation of larger particles compared to hydrogen gas. In this study the synthesis conditions of nickel and copper nanopowders can be summarized as follows for the high quality samples with small mean diameter and less aggregation.
1) For nickel nanopowders, 300 A of arc current and 30 to 33 V of input voltage under mixed gas of hydro- gen and argon with mixing ratio of 40 and 60%, respec- tively.
2) For copper nanospheres, 220 A of arc current and 36 to 50 V of input voltage under mixed gas of nitrogen and argon with mixing ratio of 20 and 80%, respectively.
Acknowledgments
This work was supported by the grant from ‘the Aca- Table 2. The purity of nickel and copper nanopowders
synthesized using mixed gas of hydrogen and argon (Unit:
PPM)
Composition Ni Nanopowder Cu Nanopowder
Trace Elements
Cr 26 22.2
Fe 246.5 55.4
Sn 6.6 37.3
B 192.5 31.2
Si 20.4 35
W 1.3 -
Ag 19.1 44.7
Mn 79.1 -
Pb 67.3 -
Total 658.8 225.8
Purity 99.93412% 99.97742%
Table 3. The purity of nickel and copper nanopowders synthesized using mixed gas of nitrogen and argon (Unit:
PPM)
Composition Ni Nanopowder Cu Nanopowder
Trace Elements
Fe 16.04 28.1
B 103 79.9
Si 203 144
W 1873 -
Mn 12.8 19.4
Pb 59.5 20.0
Total 2267.34 291.4
Purity 99.77327% 99.97086%
424 Young-Sang Cho, Jong Woo Moon, Kook Chae Chung, and Jung-Goo Lee
demic Promotion System of Korea Polytechnic Univer- sity’ and a grant from KIMS (Korea Institute of Materials Science) internal program ‘Development of Advanced Pow- der Materials Technology for New Growth Engine and Its Transfer to Industry’ in Korea.
References
[1] S. H. Ko, J. Chung, N. Hotz, K. H. Nam and C. P. Grigor- opoulos: J. Micromech Microeng, 20 (2010) 125010.
[2] H. Chang and H.-T. Su: Rev. Adv. Mater. Sci., 18 (2008) 667.
[3] D.-W. Jung and S.-M. Oh and D.-W. Park: Korean Chem.
Eng. Res., 46 (2008) 701.
[4] G. Lee, Y.-S. Cho, S. Park and G.-R. Yi: Kor. J. Chem.
Eng., 28 (2011) 1641.
[5] B. R. Cuenya: Thin Solid Film, 518 (2010), 3127.
[6] Y.-S. Cho, S.-J. Son, Y. K. Kim, K. C. Chung and C. J.
Choi: J. Kor. Powd. Met. Inst., 17 (2010) 390.
[7] S. Wu and X. Ding: IEEE Transactions on Advanced Packaging, 30, 434.
[8] A. Chahadih, H. E. Hamzaoui, O. Cristini, L. Bigot, R.
Bernard, C. Kinowski, M. Bouazaoui and B. Capoen:
Nanoscale Res. Lett., 7 (2012) 487.
[9] I. Capek: Adv. Colloid Interf. Sci., 110 (2004) 49.
[10] D. Kim, S. Jeong and J. Moon: Nanotechnology, 17 (2006) 4019.
[11] J.-G. Lee, P. Li, X. Long and C.-J. Choi: Kor. J. Met. Mater., 48 (2010) 357.
[12] B. Ebin and S. Gurmen: Kona Powder and Particle J., 29 (2011) 134.
[13] S. H. Hong and B. K. Kim: Mater. Lett., 51 ( 2001) 139.
[14] S.-M. Oh and D.-W. Park: J. Korean Ind. Eng. Chem., 16 (2005) 305.
[15] Chase, M. W., Jr.: NIST-JANAF Themochemical Tables (Journal of Physical and Chemical Reference Data Mono- graphs) 4th ed., American Institute of Physics (1998).
[16] J. M. Smith, H. C. Van Ness and M. M. Abbott: Introduc- tion to Chemical Engineering Thermodynamics, 7th ed., McGraw Hill (2005).
[17] J.-G. Lee, P. Li, C.-J. Choi and X.-L. Dong: Thin Solid Film 519 (2010) 81.
[18] S. Takeoka and Y. Mizuno: Jpn. J. Appl. Phys., 50 (2011) 09NC06.
[19] C. B. Alcock, V. P. Itkin and M. K. Horrigan; Canadian Metallurgical Quarterly, 23 (1984) 309.
[20] Y.-S. Cho, H.-M. Kim, J.-J. Hong, G.-R. Yi, S. H. Jang and S.-M. Yang: Colloid Surf. A, 336 (2009) 88.
[21] J. I. Park, E. B. Park, Y. J. Lee and S. D. Choi: RIST Research Paper, 22 (2008) 174.
[22] B. D. Cullity: Elements of X-ray Diffraction, 3rd ed. (2001).
[23] E. A. Baranova, Y. L. Page, D. Ilin, C. Bock, B. MacDou- gal and P. H. J. Mercier: J. Alloy Compound, 471 (2009) 387.
[24] G. Horikoshi: Fundementals of Vacuum Technology, Uni- versity of Tokyo Press, Tokyo (1994).