• 검색 결과가 없습니다.

Study of soft tissue changes in the upper lip and nose after backward movement of the maxilla in orthognathic surgery

N/A
N/A
Protected

Academic year: 2021

Share "Study of soft tissue changes in the upper lip and nose after backward movement of the maxilla in orthognathic surgery"

Copied!
8
0
0

로드 중.... (전체 텍스트 보기)

전체 글

(1)

This is an open-access article distributed under the terms of the Creative Commons Attribution Non-Commercial License (http://creativecommons.org/

licenses/by-nc/4.0/), which permits unrestricted non-commercial use, distribution, and reproduction in any medium, provided the original work is properly cited.

CC

Study of soft tissue changes in the upper lip and nose after backward movement of the maxilla in orthognathic surgery

Suyun Seon*, Hyun-Woo Lee*, Bong-Jin Jeong, Baek-Soo Lee, Yong-Dae Kwon, Joo-Young Ohe Department of Oral and Maxillofacial Surgery, School of Dentistry, Kyung Hee University, Seoul, Korea

Abstract (J Korean Assoc Oral Maxillofac Surg 2020;46:385-392)

Objectives: This study evaluates soft tissue changes of the upper lip and nose after maxillary setback with orthognathic surgery such as Le Fort I or anterior segmental osteotomy.

Materials and Methods: All 50 patients with bimaxillary protrusion and skeletal Class II malocclusion underwent Le Fort I or anterior segmental osteotomy with backward movement. Soft and hard tissue changes were analyzed using cephalograms collected preoperatively and 6 months postop- eratively.

Results: Cluster analysis on the ratios shows that 2 lines intersected at 4 mm point. Based on this point, we divided the subjects into 2 groups: Group A (less than 4 mm, 27 subjects) and Group B (more than 4 mm, 23 subjects). Also, each group was divided according to changes of upper incisor angle (≥4°=A1, B1 or <4°=A2, B2). The correlation between A and B groups for Aʼ/ANS and Ls/Is ( P <0.001) was significant; Aʼ/A ( P =0.002), PRN/A ( P =0.043), PRN/ANS ( P =0.032), and St/Is ( P =0.010). Variation of nasolabial angle between the two groups was not significant. There was no signifi- cant correlation of vertical movement and angle variation.

Conclusion: The ratio of soft tissue to hard tissue movement depends on the amount of posterior movement in the maxilla, showing approximately two times higher rates in most of the midface when posterior movement was greater than 4 mm. The soft tissue changes caused by posterior movement of the maxilla were little affected by angular changes of upper incisors. Interestingly, nasolabial angle showed a different tendency between A and B groups and was more affected by incisal angular changes when horizontal posterior movement was less than 4 mm.

Key words: Orthognathic surgery, Soft tissue change, Maxillary setback, Cephalogram

[paper submitted 2020. 8. 3 / revised 2020. 9. 14 / accepted 2020. 9. 24]

Copyright © 2020 The Korean Association of Oral and Maxillofacial Surgeons. All rights reserved.

I. Introduction

Correction of facial deformities by orthognathic surgery aims to restore normal functions and appearance of the oral and maxillofacial region. Facial profile changes after surgery are the first visual indicator of successful results and, thus, one of the critical determinants of patient satisfaction. There- fore, accurate prediction of changes in soft tissue in response

to hard tissue movement is essential in order to achieve pa- tient satisfaction with aesthetic outcomes.

The nasolabial region of the midface is essential in deter- mining facial aesthetics, and it can be significantly affected by skeletal movement related to maxillary surgery such as Le Fort I or segmental osteotomy 1 . Nevertheless, it is difficult to predict soft tissue movement after orthognathic surgery due to the various factors involved in soft tissue movement 2 .

Research on soft tissue changes after orthognathic surgery has been increasing with the need for a more accurate predic- tion of postoperative outcomes. Hack et al. 3 showed that the ratio of soft tissue to hard tissue movement following Le Fort I surgery approached 1:1 over a long-term period. However, Betts et al. 2 argued that soft tissue changes in the upper lip and nasolabial area are directly affected by adjacent soft tis- sue and skeletal muscles, and concluded that it is difficult to determine the ratio of movement due to the various factors involved.

There have been numerous studies on soft tissue changes Joo-Young Ohe

Department of Oral and Maxillofacial Surgery, Kyung Hee University Dental Hospital, School of Dentistry, Kyung Hee University, 23 Kyungheedae-ro, Dongdaemun-gu, Seoul 02447, Korea

TEL: +82-2-958-9440 FAX: +82-2-958-4572 E-mail: ojyoung81@khu.ac.kr

ORCID: https://orcid.org/0000-0002-4411-7871

*These authors contributed equally to this work as first authors.

(2)

after maxillary surgical movement, reporting soft to hard tis- sue ratios ranging from 0.33:1 to 0.9:1 2-7 . Moreover, another study mainly focused on soft-tissue changes in the upper lip and nose responding to anterior or superior movement of the maxilla 3,8 . However, posterior movement of the maxilla through orthognathic surgery has been steadily increasing to optimize facial aesthetics. Thus, soft tissue changes related to posterior movement of the maxilla should be further investi- gated 9 .

Several research methods have been introduced to pre- dict soft tissue changes associated with facial bone move- ment 4,10,11 . Lateral cephalometric radiography, cephalometric prediction with video images, and three-dimensional comput- erized tomography are commonly used in clinical settings.

Lateral cephalometric radiography is generally considered a reliable tool for evaluating pre- and postsurgical measure- ments and is widely utilized for treatment planning and eval- uation 12 . Yitschaky et al. 13 demonstrated that the difference in 2D and 3D images for linear or ratio measurement was not significant.

In this study, we sought to analyze postoperative changes in soft tissue by lateral cephalometric radiography among patients, measuring the ratio of soft tissue change to the cor- responding maxillary posterior movement. Moreover, we investigated correlations between the soft tissue changes and influencing factors that could increase the accuracy of pre- dicted outcomes of orthognathic surgery.

II. Materials and Methods

1. Subjects

The study was approved by the Institutional Review Board of Kyung Hee University Dental Hospital (No. KHD IRB 1311-1), and the informed consent was waived.

The subjects comprised 50 patients (10 males, 40 females) diagnosed with bimaxillary protrusion or skeletal class II malocclusion who underwent orthognathic surgery such as Le Fort I osteotomy or maxillary anterior segmental oste- otomy between February 2010 and October 2013 at Kyung Hee University Dental Hospital. The age of patients ranged from 19 to 33 years at the time of surgery. We only included patients who underwent maxillary orthognathic surgery with backward movement of the maxilla parallel to the horizontal reference line based on the A point. Other surgical techniques such as rotation and impaction were included as long as the overall direction of maxilla was posterior. Changes in mid- facial soft tissue after maxillary rotational movement could be evaluated by measuring the vertical and horizontal linear movement of bone and angular changes of incisors. Postop- erative follow-up was conducted over a period of at least six months and confirmed that no complications or relapses oc- curred that required surgical intervention. The patients in this study underwent postoperative orthodontic treatment and we measured linear and angular movement of various landmarks on the anterior maxillary teeth and bone including orthodon- tic movement 6 months postoperative.

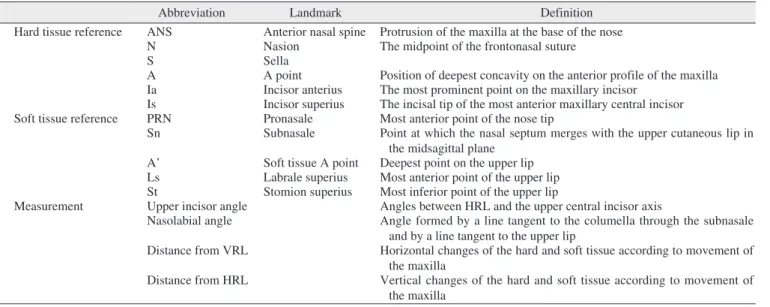
Table 1. Two-dimensional landmarks for orthognathic surgery

Abbreviation Landmark Definition

Hard tissue reference ANS Anterior nasal spine Protrusion of the maxilla at the base of the nose

N Nasion The midpoint of the frontonasal suture

S Sella

A A point Position of deepest concavity on the anterior profile of the maxilla Ia Incisor anterius The most prominent point on the maxillary incisor

Is Incisor superius The incisal tip of the most anterior maxillary central incisor Soft tissue reference PRN Pronasale Most anterior point of the nose tip

Sn Subnasale Point at which the nasal septum merges with the upper cutaneous lip in the midsagittal plane

A’ Soft tissue A point Deepest point on the upper lip Ls Labrale superius Most anterior point of the upper lip St Stomion superius Most inferior point of the upper lip

Measurement Upper incisor angle Angles between HRL and the upper central incisor axis

Nasolabial angle Angle formed by a line tangent to the columella through the subnasale and by a line tangent to the upper lip

Distance from VRL Horizontal changes of the hard and soft tissue according to movement of the maxilla

Distance from HRL Vertical changes of the hard and soft tissue according to movement of the maxilla

(VRL: vertical reference line, HRL: horizontal reference line)

Suyun Seon et al: Study of soft tissue changes in the upper lip and nose after backward movement of the maxilla in orthognathic surgery. J Korean Assoc Oral Maxillofac Surg 2020

(3)

2. Methods

1) Lateral cephalometric radiographs and measurements Lateral cephalometric radiographs were taken within one month preoperatively (T0) and six months postoperatively (T1) using CX 90SP (Asahi, Tokyo, Japan) in the natural head position with centric occlusion and centric relation.

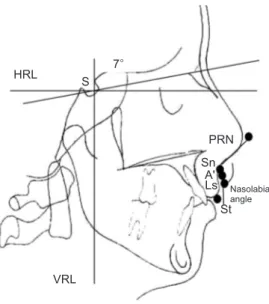
Lateral cephalometric radiography was obtained by a single operator who performed measurement using the V-ceph pro- gram (ver. 4.0; Cybermed, Seoul, Korea). The analysis of lateral cephalometric radiographs was performed by an oral and maxillofacial surgeon and a third-year resident using the Legan and Burstone cephalometric analysis introduced by Burstone et al. 14 and Moore 15 in late 1970s. For consistency between examiners, the two examiners gathered and con- sulted in advance and this analysis was conducted once every two weeks for 4 weeks. A horizontal line drawn 7° clockwise from the Sella-Nasion (SN) plane through the sella was used as the horizontal reference line (HRL), and a vertical line per- pendicularly drawn from the sella to the HRL was used as the vertical reference line. After soft and hard tissue landmarks in the maxilla were identified, horizontal and vertical distances and angles from the reference line were measured. The refer- ence lines and landmarks used in this study are listed below.

(Table 1, Fig. 1, 2)

2) Statistical analysis

Data analyses were performed with independent t-test and Mann–Whitney U test using IBM SPSS (ver. 20; IBM, Armonk, NY, USA). Cluster analysis was also conducted by measuring the amount of hard tissue movement from land- mark A to A’ and by evaluating the ratio of soft tissue move- ment in response to hard tissue movement. A normality test was performed to determine parametric and non-parametric methods. Mann–Whitney U test and independent t-test were used as the non-parametric and parametric tests in this study to determine the correlation between groups, respectively.

The significance level was set to P<0.05.

III. Results

1. Cluster analysis of soft and hard tissue changes

We performed cluster analysis based on horizontal changes of A’ on soft tissue according to the amount of horizontal, posterior movement of reference point A on hard tissue, and the amount of soft tissue movement to hard tissue movement ratio. We found two lines with different slopes intersected near 4 mm of hard tissue movement (x-axis), and therefore additionally divided subjects into two groups: Less than 4 mm (Group A, 27 subjects) and more than 4 mm (Group B, 23 subjects).(Fig. 3) Each group was further divided into two

HRL S

7

Upper incisor angle

N

ANS A

Ia Is

VRL

Fig. 1. Cephalometric hard tissue landmarks and reference planes. (HRL: horizontal reference line, S: sella, N: nasion, ANS:

anterior nasal spine, A: A point, Ia: incisor anterius, Is: incisor su- perius, Upper incisor angle: upper incisor to HRL, VRL: vertical reference line)

Suyun Seon et al: Study of soft tissue changes in the upper lip and nose after backward movement of the maxilla in orthognathic surgery. J Korean Assoc Oral Maxillofac Surg 2020

Fig. 2. Cephalometric soft tissue landmarks and reference planes.

(HRL: horizontal reference line, S: sella, PRN: pronasale, Sn: sub- nasale, A’: soft tissue A point, Ls: labrale superius, St: stomion superius, VRL: vertical reference line)

Suyun Seon et al: Study of soft tissue changes in the upper lip and nose after backward movement of the maxilla in orthognathic surgery. J Korean Assoc Oral Maxillofac Surg 2020

HRL S

7

PRN Sn

A' Ls

St Nasolabial angle

VRL

(4)

subgroups to evaluate the effects of incisal angular changes on the soft tissue: a subgroup with changes in upper incisor angle (≥4°, Group A1: 12 subjects, 5.38±5.31; Group B1: 8 subjects, 9.38±3.93) and a subgroup with few changes (<4°, Group A2: 15 subjects; B2: 15 subjects).

2. A comparison of soft tissue change to hard tissue movement rations in Group A and Group B

1) Horizontal movement

Our results show that there were statistically significant soft tissue changes in A’ according to hard tissue changes in A, with a mean ratio of 0.2:1 in Group A and 0.4:1 in Group B with a P-value of 0.002.(Table 2) The ratio of PRN to A changes was 0.3:1 in Group A and 0.3:1 in Group B with a P-value of 0.043. The mean ratio of A’ to ANS was also sta- tistically significant at 0.3:1 in Group A and 0.5:1 in Group

Table 2. Ratios of soft tissue (ST) to hard tissue (HT) horizontal movement in groups A and B

Ratio (ST/HT) Group A Group B

P -value

Mean SD Mean SD

ΔA’/ΔA 0.226 0.304 0.420 0.133 0.002*

ΔSN/ΔA 0.298 0.318 0.331 0.127 0.369

ΔPRN/ΔA 0.298 0.597 0.312 0.126 0.043*

ΔA’/ΔANS 0.288 0.474 0.469 0.109 0.001**

ΔSn/ΔANS 0.398 0.565 0.367 0.110 0.097

ΔPRN/ΔANS 0.348 0.571 0.354 0.138 0.032*

ΔLs/ΔIa 0.729 0.559 0.895 0.214 0.156

ΔSt/ΔIa 1.169 0.733 1.119 0.263 0.510

ΔLs/ΔIs 0.516 0.354 0.972 0.376 0.000**

ΔSt/ΔIs 0.868 0.450 1.196 0.397 0.010*

ΔNasolabial angle –8.500 6.090 –6.636 2.887 0.346

(Δ: change between pre and postoperative measurements, SD: standard deviation)

* P <0.05, ** P <0.001 on independent t-test or Mann–Whitney U test, respectively.

Refer to Table 1 for the definition of landmarks.

Suyun Seon et al: Study of soft tissue changes in the upper lip and nose after backward movement of the maxilla in orthognathic surgery. J Korean Assoc Oral Maxillofac Surg 2020

Table 3. Ratios of soft tissue (ST) to hard tissue (HT) vertical movement in groups A and B

Ratio (ST/HT) Group A Group B

P -value

Mean SD Mean SD

ΔA’/ΔA 0.994 4.140 0.111 0.559 0.360

ΔSn/ΔA –0.540 2.742 0.450 1.232 0.622

ΔPRN/ΔA 0.647 1.901 0.122 0.583 0.390

ΔA’/ΔANS 0.3125 1.68838 –0.5545 2.37750 0.211

ΔSn/ΔANS –0.2143 2.46951 –0.9833 3.63306 0.805

ΔPRN/ΔANS 0.3881 3.32369 0.3333 1.16013 0.767

ΔLs/ΔIa 0.1720 1.26585 –0.1360 1.20700 0.182

ΔSt/ΔIa 0.2042 1.58862 0.2408 0.69078 0.852

ΔLs/ΔIs 0.0641 1.22180 –1.0618 5.45496 0.914

ΔSt/ΔIs 0.2235 0.99356 0.1291 2.83792 0.307

(Δ: change between pre and postoperative measurements, SD: standard deviation)

P -values were calculated using independent t-test or Mann–Whitney U test according to normality of the data.

Refer to Table 1 for the definition of landmarks.

Suyun Seon et al: Study of soft tissue changes in the upper lip and nose after backward movement of the maxilla in orthognathic surgery. J Korean Assoc Oral Maxillofac Surg 2020 Fig. 3. Relaptionship between the movement of hard tissue and

soft tissue. Ratio of soft tissue on the hard tissue. Two different gradient lines crossing near the 4 mm (x-axis) point.

Suyun Seon et al: Study of soft tissue changes in the upper lip and nose after backward movement of the maxilla in orthognathic surgery. J Korean Assoc Oral Maxillofac Surg 2020

10 0

5

4

3

2

1

0

V ariation of soft tissue (mm)

Variation of hard tissue (mm)

2 4 6 8

(5)

B with a P-value of 0.001. The ratio of labrale superious (Ls) to incisor superious (Is) changes was approximately 0.5:1 in Group A and 1.0:1 in Group B with a P-value of less than 0.001. The mean ratio for stomion superios (St) to Is change was 0.9:1 and 1.2:1 in groups A and B, respectively ( P=0.010).

There were no significant changes in nasolabial angle in relation to the horizontal movement of hard tissue in the maxilla. On the other hand, the ratio of Sn to A change, Sn to ANS change, Ls to incisor anterius (Ia) changes, and St to Ia changes showed no statistical significance with a P-value of more than 0.05.

2) Vertical movement

There was no significant difference in vertical movement of soft tissue in response to posterior movement of hard tis- sue.(Table 3)

3. A comparison between subgroups according to upper incisor angle change

The nasolabial angle in subgroup A1 with upper incisor angle changes increased 6.2° on mean and 11.5° in subgroup A2 with no upper incisor angle changes showing statisti- cal significance (P-value of 0.017). However, the results of Group B subgroups were similar in terms of nasolabial angle except the ratio of Ls to Is change (P<0.05).(Tables 4, 5)

IV. Discussion

Predicting accurate treatment outcomes considering ad- jacent soft tissue movement is important, particularly when planning of orthognathic surgery for patients with skeletal malocclusion. However, facial soft tissue is a complex struc- ture interconnected with facial bones through a continually

Table 4. Ratio of soft tissue (ST) to hard tissue (HT) horizontal movement according to incisal angle variation in Group A Ratio (ST/HT)

(<4 mm)

Subgroup A1 Subgroup A2

P -value

Mean SD Mean SD

ΔA’/ΔA 0.182 0.314 0.285 0.294 0.188

ΔSn/ΔA 0.286 0.331 0.313 0.314 0.770

ΔPRN/ΔA 0.354 0.747 0.222 0.320 0.938

ΔA’/ΔANS 0.184 0.368 0.426 0.575 0.086

ΔSn/ΔANS 0.403 0.590 0.392 0.554 0.716

ΔPRN/ΔANS 0.318 0.539 0.389 0.633 0.918

ΔLs/ΔIa 0.799 0.618 0.635 0.479 0.451

ΔSt/ΔIa 1.313 0.867 0.976 0.473 0.261

ΔLs/ΔIs 0.490 0.373 0.551 0.340 0.658

ΔSt/ΔIs 0.907 0.536 0.816 0.316 0.606

ΔNasolabial angle –6.188 3.674 –11.583 7.391 0.017*

(Δ: change between pre and postoperative measurements, SD: standard deviation)

* P <0.05 on independent t-test or Mann–Whitney U test according to normality of the data.

Refer to Table 1 for the definition of landmarks.

Suyun Seon et al: Study of soft tissue changes in the upper lip and nose after backward movement of the maxilla in orthognathic surgery. J Korean Assoc Oral Maxillofac Surg 2020

Table 5. Ratios of soft tissue (ST) to hard tissue (HT) horizontal movement according to incisal angle variation on Group B Ratio (ST/HT)

(≥4 mm)

Subgroup B1 Subgroup B2

P -value

Mean SD Mean SD

ΔA’/ΔA 0.432 0.158 0.400 0.078 0.593

ΔSn/ΔA 0.348 0.146 0.302 0.087 0.428

ΔPRN/ΔA 0.320 0.139 0.300 0.105 0.731

ΔA’/ΔANS 0.474 0.126 0.459 0.077 0.486

ΔSn/ΔANS 0.377 0.118 0.348 0.101 0.564

ΔPRN/ΔANS 0.361 0.158 0.343 0.103 0.973

ΔLs/ΔIa 0.971 0.140 0.763 0.263 0.066

ΔSt/ΔIa 1.147 0.137 1.071 0.410 0.336

ΔLs/ΔIs 1.127 0.335 0.701 0.290 0.007*

ΔSt/ΔIs 1.315 0.328 0.988 0.442 0.115

ΔNasolabial angle –7.429 2.533 –5.250 3.105 0.089

(Δ: change between pre and postoperative measurements, SD: standard deviation)

* P <0.05 on independent t-test or Mann–Whitney U test according to normality of the data.

Refer to Table 1 for the definition of landmarks.

Suyun Seon et al: Study of soft tissue changes in the upper lip and nose after backward movement of the maxilla in orthognathic surgery. J Korean Assoc Oral Maxillofac Surg 2020

(6)

changing interplay, making it difficult to accurately predict surgery outcomes. Moreover, soft tissues adjust to reposi- tioned facial bones as time goes on, taking from 6 months up to several years to stabilize 11,16 . Dann et al. 6 and Stella et al. 11 reported that the soft tissues stabilized after six months, showing consistent results with other studies 5,6,11,17,18 . There- fore, we measured and analyzed lateral cephalometric radio- graphs taken at baseline and at six months postoperative.

Previous studies found that soft tissue changes following Le Fort I occur mainly in the upper lip and nose and investi- gated soft tissue changes responding to maxillary movement at different angles 8,19-22 . Although posterior movement of the anterior maxilla using Le Fort I is well established 23,24 , Le Fort I involving movement of the entire maxilla is poorly understood, as the majority of studies only focused on the measurement of soft tissue distances responding to maxillary movement 5,10,25 . Chew 5 reported a ratio of ANS horizontal movement to nasal tip of 1:0.35, and an upper central incisor to upper lip ratio of 1:0.84. Park and Hwang 26 described an upper incisor to upper lip ratio in posterior movement of the maxilla by anterior segmental osteotomy of 1:0.67. Several studies reported various rates to soft tissue changes to maxilla movement 23,27,28 . Hence, our study focused on changes in the nasolabial soft tissue, especially after backward movement of the maxilla, and also analyzed soft to hard tissue ratios ac- cording to the amount of posterior movement of the maxilla.

We evaluated the nasolabial soft tissue responses to hard tissue changes by measuring changes on lateral cephalometric radiographs. The results showed that significant differences in soft tissue change corresponded to hard tissue movement.

Cluster analyses were carried out on soft tissue changes in A’

and ratios responding to the changes in the A point, dividing the data into two groups with significant differences in post- surgical outcomes. The data of these two groups were plotted on the xy-plane relative to hard tissue movement (x-axis) and soft tissue changes (y-axis). The linear regression lines of the two sets of data intersected in near 4 mm, representing hard tissue movement, that led us to classify two groups into less than 4 mm (Group A) and more than 4 mm (Group B) of movement.

The ratio of postsurgical changes in Ls to Is and St to Is changes indicates significant soft tissue change differences between the two groups in reference to the maxillary central incisor. The ratio of A point to A’ point in Group A and Group B are consistent with previous studies on ratios of soft tissue changes responding to hard tissue movement in the anterior or superior directions, which ranged from 0.33:1 to 0.9:1 3,6,7,29 .

Dann et al. 6 reported ratios of ΔLs to ΔIs after anterior movement of the maxilla of 0.5:1, while Mansour et al. 8 re- ported a value of 0.62:1, which are both consistent with the current results for Group A. Soft tissue changes after anterior maxillary movement mainly occur in the nasal area, show- ing a similar pattern after posterior movement. The upper lip region could be rotated and horizontally advanced, respond- ing to the amount of maxillary incisal movement. Alar cinch suture and V-Y vestibular closure are used to prevent widen- ing of the nasal base and thinning of the upper lip and could improve surgery outcomes after maxillary movement 30,31 . However, there is controversy over this finding in posterior movement of the maxilla, and many studies excluded the Alar cinch suture and V-Y vestibular closure as an influencing factor 32 . In this study, we did not consider nasolabial suture methods as an influencing factor.

In this study, patients were divided into groups according to the amount of hard tissue movement. We found that soft tissue responses varied between groups. The change rate of the soft tissue of the nasal tip and upper lip region in Group B was approximately twice the rate in Group A, suggesting this finding as a guideline when considering the amount of poste- rior movement of the maxilla to obtain the desired soft tissue changes during orthognathic surgery.

Movement of the maxilla affects the nasolabial tissue ac- cording to the direction and the amount of maxillary move- ment 33 . Previous studies reported an increase in nasal tip pro- trusion and a decrease in nasolabial angle, particularly after anterior movement 34 , while posterior maxillary movement caused a decrease in nasal tip protrusion and an increase in nasolabial angle 9 . Schouman et al. 9 reported an 8.9° to 18°

increase among bimaxillary protrusion patients treated with posterior maxillary movement. In the present study, nasola- bial angle changes were 6.6° to 8.5° on mean, showing less change compared with previous studies, and no significant differences were observed between the two groups.

There are influencing factors that affect nasolabial soft tis-

sue changes, including vertical maxillary movement, posteri-

or-superior rotation, and incisal angle variations 1 . Excluding

these factors, we measured postsurgical changes considering

posterior movement of the hard tissue reference point (point

A) and carried out analyses. In order to identify other factors

involved in soft tissue changes, we measured vertical changes

in each landmark along the horizontal plane. Moreover, the

two groups were further divided into subgroups according to

incisal angle variation. There were no significant differences

in vertical movement between the two groups, indicating no

(7)

bias due to vertical movement in soft tissue.

The two groups were divided into subgroups (A1, A2, B1, B2) based on incisal angle changes in order to identify the effect of incisal angle variation on the nasolabial soft tissue.

Statistical analyses revealed that nasolabial angle changes were increased with incisal angle variations in Group A. The ratio of upper lip to incisal tip (ΔLs/ΔIs) in Group B showed statistical significance. However, there were no significant differences found in other regions. These results suggested that incisal angle variation might have no significant impact on the soft to hard tissue ratio. Mean changes in nasolabial angle appear more affected by incisal angle changes with a small amount of horizontal posterior movement than incisal angle changes with a large amount of posterior movement.

We were able to predict soft tissue changes after posterior movement of the maxilla in this study and found that soft tis- sue changes are significantly affected by the amount of poste- rior movement of the maxilla. This result is clinically relevant and will be invaluable for predicting soft tissue responses to orthognathic surgery, especially when posterior movement of the maxilla is expected, improving outcomes and satisfaction among orthognathic surgery patients.

V. Conclusion

We analyzed landmark measurements on lateral cephalo- metric radiography taken preoperative and 6 months postop- erative. We also analyzed soft tissue changes of the upper lip and nose among study participants, who were divided into two groups according to horizontal posterior movement of the A point (Group A: <4 mm; Group B: ≥ 4 mm).

1. There were significant differences in the ratio of soft- to-hard tissue movement between the A and B groups, with approximately two-fold higher rates in most of the midface region when posterior movement was ≥4 mm.

2. When comparing subgroups divided based on incisal angle variation in the maxilla, we found no statistically sig- nificant changes in response to backward movement of the maxilla except nasolabial angle in Group A and ΔLs/ΔIs change ratio in Group B. This result indicates that incisal angle variation has little influence on the soft tissue change ratio according to the amount of hard tissue movement of the maxilla.

3. Statistical analyses revealed that nasolabial angle did not correspond with the inclination of the upper incisor in Group B (≥4 mm) and that nasolabial angle was more affected by incisal angle changes when the amount of horizontal poste-

rior movement was relatively small.

Collectively, these results indicate that the nasolabial soft tissue changes following posterior movement in maxillary surgery vary according to the amount of posterior hard tissue movement (<4 mm or ≥4 mm), which should be taken into consideration in pre-surgical planning for successful orthog- nathic procedures.

ORCID

Suyun Seon, https://orcid.org/0000-0002-2870-2747 Hyun-Woo Lee, https://orcid.org/0000-0002-8144-3633 Bong-Jin Jeong, https://orcid.org/0000-0002-3532-0886 Baek-Soo Lee, https://orcid.org/0000-0002-9145-8062 Yong-Dae Kwon, https://orcid.org/0000-0001-9620-4814 Joo-Young Ohe, https://orcid.org/0000-0002-4411-7871

Authors’ Contributions

S.S. participated in data collection and wrote the manu- script. H.W.L. participated in data collection and edit the manuscript. B.J.J. participated in investigation and the stati- scal analysis. B.S.L. and Y.D.K. participated in the conceptu- alization and the study design. J.Y.O. participated in the study design and coordination and helped to draft the manuscript for final approval.

Ethics Approval and Consent to Participate

The study was approved by the Institutional Review Board of Kyung Hee University Dental Hospital (No. KHD IRB 1311-1), and the informed consent was waived.

Conflict of Interest

No potential conflict of interest relevant to this article was reported.

References

1. O'Ryan F, Schendel S. Nasal anatomy and maxillary surgery. I.

esthetic and anatomic principles. Int J Adult Orthodon Orthognath Surg 1989;4:27-37.

2. Betts NJ, Vig KW, Vig P, Spalding P, Fonseca RJ. Changes in the nasal and labial soft tissues after surgical repositioning of the max- illa. Int J Adult Orthodon Orthognath Surg 1993;8:7-23.

3. Hack GA, de Mol van Otterloo JJ, Nanda R. Long-term stabil- ity and prediction of soft tissue changes after LeFort I surgery.

Am J Orthod Dentofacial Orthop 1993;104:544-55. https://doi.

(8)

org/10.1016/s0889-5406(05)80438-x

4. Schendel SA, Eisenfeld JH, Bell WH, Epker BN. Superior repo- sitioning of the maxilla: stability and soft tissue osseous relations.

Am J Orthod 1976;70:663-74. https://doi.org/10.1016/0002- 9416(76)90226-8

5. Chew MT. Soft and hard tissue changes after bimaxillary surgery in Chinese Class III patients. Angle Orthod 2005;75:959-63. https://

doi.org/10.1043/0003-3219(2005)75[959:SAHTCA]2.0.CO;2 6. Dann JJ 3rd, Fonseca RJ, Bell WH. Soft tissue changes associated

with total maxillary advancement: a preliminary study. J Oral Surg 1976;34:19-23.

7. Ewing M, Ross RB. Soft tissue response to orthognathic sur- gery in persons with unilateral cleft lip and palate. Cleft Pal- ate Craniofac J 1993;30:320-7. https://doi.org/10.1597/1545- 1569_1993_030_0320_strtos_2.3.co_2

8. Mansour S, Burstone C, Legan H. An evaluation of soft-tissue changes resulting from Le Fort I maxillary surgery. Am J Orthod 1983;84:37-47. https://doi.org/10.1016/0002-9416(83)90146-x 9. Schouman T, Baralle MM, Ferri J. Facial morphology changes

after total maxillary setback osteotomy. J Oral Maxillofac Surg 2010;68:1504-11. https://doi.org/10.1016/j.joms.2009.09.095 10. Radney LJ, Jacobs JD. Soft-tissue changes associated with surgical

total maxillary intrusion. Am J Orthod 1981;80:191-212. https://

doi.org/10.1016/0002-9416(81)90218-9

11. Stella JP, Streater MR, Epker BN, Sinn DP. Predictability of up- per lip soft tissue changes with maxillary advancement. J Oral Maxillofac Surg 1989;47:697-703. https://doi.org/10.1016/s0278- 2391(89)80008-4

12. Eggensperger NM, Lieger O, Thüer U, Iizuka T. Soft tissue profile changes following mandibular advancement and setback surgery an average of 12 years postoperatively. J Oral Maxillofac Surg 2007;65:2301-10. https://doi.org/10.1016/j.joms.2007.06.644 13. Yitschaky O, Redlich M, Abed Y, Faerman M, Casap N, Hiller N.

Comparison of common hard tissue cephalometric measurements between computed tomography 3D reconstruction and convention- al 2D cephalometric images. Angle Orthod 2011;81:11-6. https://

doi.org/10.2319/031710-157.1

14. Burstone CJ, James RB, Legan H, Murphy GA, Norton LA. Ceph- alometrics for orthognathic surgery. J Oral Surg 1978;36:269-77.

15. Moore JW. Variation of the sella-nasion plane and its effect on SNA and SNB. J Oral Surg 1976;34:24-6.

16. Quast DC, Biggerstaff RH, Haley JV. The short-term and long-term soft-tissue profile changes accompanying mandibular advancement surgery. Am J Orthod 1983;84:29-36. https://doi.org/10.1016/0002- 9416(83)90145-8

17. Koh CH, Chew MT. Predictability of soft tissue profile changes following bimaxillary surgery in skeletal class III Chinese patients.

J Oral Maxillofac Surg 2004;62:1505-9. https://doi.org/10.1016/

j.joms.2004.04.022

18. Mommaerts MY, Lippens F, Abeloos JV, Neyt LF. Nasal profile changes after maxillary impaction and advancement surgery. J Oral Maxillofac Surg 2000;58:470-5; discussion 475-6. https://doi.

org/10.1016/s0278-2391(00)90002-8

19. Brooks BW, Buschang PH, Bates JD, Adams TB, English JD. Pre- dicting upper lip response to 4-piece maxillary LeFort I osteotomy.

Am J Orthod Dentofacial Orthop 2001;120:124-33. https://doi.

org/10.1067/mod.2001.115614

20. Gassmann CJ, Nishioka GJ, Van Sickels JE, Thrash WJ. A lateral cephalometric analysis of nasal morphology following Le Fort I osteotomy applying photometric analysis techniques. J Oral Maxillofac Surg 1989;47:926-30. https://doi.org/10.1016/0278- 2391(89)90375-3

21. Rosen HM. Lip-nasal aesthetics following Le Fort I osteotomy. Plast Reconstr Surg 1988;81:171-82. https://doi.org/10.1097/00006534- 198802000-00005

22. Westermark AH, Bystedt H, Von Konow L, Sällström KO. Na- solabial morphology after Le Fort I osteotomies. Effect of alar base suture. Int J Oral Maxillofac Surg 1991;20:25-30. https://doi.

org/10.1016/s0901-5027(05)80690-3

23. Jayaratne YS, Zwahlen RA, Lo J, Cheung LK. Facial soft tissue re- sponse to anterior segmental osteotomies: a systematic review. Int J Oral Maxillofac Surg 2010;39:1050-8. https://doi.org/10.1016/

j.ijom.2010.07.002

24. Okudaira M, Kawamoto T, Ono T, Moriyama K. Soft-tissue chang- es in association with anterior maxillary osteotomy: a pilot study.

Oral Maxillofac Surg 2008;12:131-8. https://doi.org/10.1007/

s10006-008-0121-9

25. Jacobson R, Sarver DM. The predictability of maxillary reposition- ing in LeFort I orthognathic surgery. Am J Orthod Dentofacial Or- thop 2002;122:142-54. https://doi.org/10.1067/mod.2002.125576 26. Park JU, Hwang YS. Evaluation of the soft and hard tissue changes

after anterior segmental osteotomy on the maxilla and mandible.

J Oral Maxillofac Surg 2008;66:98-103. https://doi.org/10.1016/

j.joms.2005.09.007

27. Lew K. Profile changes following orthodontic treatment of bi- maxillary protrusion in adults with the Begg appliance. Eur J Or- thod 1989;11:375-81. https://doi.org/10.1093/oxfordjournals.ejo.

a036009

28. Nadkarni PG. Soft tissue profile changes associated with orthog- nathic surgery for bimaxillary protrusion. J Oral Maxillofac Surg 1986;44:851-4. https://doi.org/10.1016/0278-2391(86)90220-x 29. Jensen AC, Sinclair PM, Wolford LM. Soft tissue changes associ-

ated with double jaw surgery. Am J Orthod Dentofacial Orthop 1992;101:266-75. https://doi.org/10.1016/0889-5406(92)70096-S 30. Muradin MS, Rosenberg A, van der Bilt A, Stoelinga PJ, Koole

R. The effect of alar cinch sutures and V-Y closure on soft tissue dynamics after Le Fort I intrusion osteotomies. J Craniomaxillofac Surg 2009;37:334-40. https://doi.org/10.1016/j.jcms.2009.03.004 31. Peled M, Ardekian L, Krausz AA, Aizenbud D. Comparing the

effects of V-Y advancement versus simple closure on upper lip aesthetics after Le Fort I advancement. J Oral Maxillofac Surg 2004;62:315-9. https://doi.org/10.1016/j.joms.2003.08.015 32. Khamashta-Ledezma L, Naini FB. Systematic review of changes

in maxillary incisor exposure and upper lip position with Le Fort I type osteotomies with or without cinch sutures and/or VY closures.

Int J Oral Maxillofac Surg 2014;43:46-61. https://doi.org/10.1016/

j.ijom.2013.08.005

33. O'Ryan F, Carlotti A. Nasal anatomy and maxillary surgery. III.

surgical techniques for correction of nasal deformities in patients undergoing maxillary surgery. Int J Adult Orthodon Orthognath Surg 1989;4:157-74.

34. Vasudavan S, Jayaratne YS, Padwa BL. Nasolabial soft tissue changes after Le Fort I advancement. J Oral Maxillofac Surg 2012;70:e270-7. https://doi.org/10.1016/j.joms.2011.11.022

How to cite this article: Seon S, Lee HW, Jeong BJ, Lee BS, Kwon YD, Ohe JY. Study of soft tissue changes in the upper lip and nose after backward movement of the maxilla in orthognathic surgery. J Korean Assoc Oral Maxillofac Surg 2020;46:385-392.

https://doi.org/10.5125/jkaoms.2020.46.6.385

수치

Table 1. Two-dimensional landmarks for orthognathic surgery
Fig. 1. Cephalometric hard tissue landmarks and reference  planes. (HRL: horizontal reference line, S: sella, N: nasion, ANS:
Table 3. Ratios of soft tissue (ST) to hard tissue (HT) vertical movement in groups A and B
Table 5. Ratios of soft tissue (ST) to hard tissue (HT) horizontal movement according to incisal angle variation on Group B Ratio (ST/HT) (≥4 mm) Subgroup B1 Subgroup B2 P -value Mean SD Mean SD ΔA’/ΔA  0.432 0.158 0.400 0.078 0.593 ΔSn/ΔA 0.348 0.146 0.30

참조

관련 문서

1 John Owen, Justification by Faith Alone, in The Works of John Owen, ed. John Bolt, trans. Scott Clark, &#34;Do This and Live: Christ's Active Obedience as the

Changes in the composition and structure of Mediterranean rokey-shore communities following a gradient of nutrient enrichment: Descriptive study and test

The purpose of this study is to investigate changes in listening, reading achievement, and learning attitudes of Korean elementary students who enrolled in

The purpose of this study was to evaluate surface changes and abrasion of the implant fixture and TiN coated abutment screw after repeated delivery and

Purpose: Giant cell tumor of the tendon sheath are the most common tumors after ganglionic cysts in benign soft tissue tumors which could be recurred after surgical

This study examined the changes of kinetic expression factors of movement through art historical approach and as a result of analyzing internal and external

In the present study, 10 study stations were established, and seasonal changes for various ecological aspects of the community such as species composition, number of

Through a review of electronic medical records, we analyzed the applied BCSs, perioperative hematologic changes, and morbidity and mortality in JW patients