서 론 .
Ⅰ
RI
(Proton Resonance Frequency, PRF)
[1-4].
[5-6]
[3,7-8] .
,
[9-11].
,
. [5-6,12].
[8,13].
, bio-marker
[14-16].
,
[17-18].
NAA(N-Acetyl-L-aspartatic acid)
[19-20].
한용희1, 장무영1, 문치웅1,2
1 , 2 FIRST/UHRC/
Preliminary Study on Magnetic Resonance Temperature Measurement using Brain-Metabolite Phantom
Yong Hee Han1, Moo Young Jang1, ChiWoong Mun1,2,3
1Department of Biomedical Engineering, Inje University, Gyeongnam 621-749, South Korea,
2FIRST Research Group,
3U-Health Care Research Center, Inje University, Gyeongnam 621-749, South Korea (Received September 8, 2010. Accepted September 30, 2010)
In this study, we measured the chemical shift change of metabolite peaks in the brain-metabolite phantom according to the temperature variation using nuclear magnetic resonance(NMR). The temperature range in NMR system was controled from 25 to 80 (5 step) by internal temperature controller. Temperature coefficients of each metabolite peaks were also calculated from the measured chemical shift depending on the temperature. The chemical shift changes depending on temperature were validated by linear regression method for each metabolite peaks. The temperature coefficients of
totCr, Cho, Cr, NAA, and Lac were 0.0086, 0.0088, 0.0091, 0.0089, and 0.0088ppm/ , respectively. This study shows that chemical shift change of brain metabolite and temperature variation have linear relationship each other.
This also makes authors believe that brain temperature measurement is possible using MR spectroscopic imaging technique.
brain-metabolite, temperature coefficient, nuclear magnetic resonance, chemical shift
M
Corresponding Author : 문치웅
경남 김해시 어방동 인제대학교 의용공학과
(621-749) 607
Tel : +82-55-320-3297 / Fax : +82-55-327-3292 E-mail : [email protected]
본 연구는 학술진흥재단의 기초연구과제지원사업(KRF-2007-313, D00958) 의 지원을 받아 수행하였습니다.
,
.
재료 및 방법 .
Ⅱ
뇌 대사물질 팬텀 제작 A.
Table 1
[21]. (Nuclear Magnetic
Resonance Spectroscopy, NMR)
(
2H,
3H) 99.8% (Heavy
Water, D
2O) .
Vortex Mixer(Scientific Industries, Inc., USA) .
, 5mm NMR (OPTIMA, Inc., USA) 5
500 .
실험 장비 B.
(NMR)
Varian 500MHz NMR .
NMR ventilator
25 80 5
. tunning shimming ,
Acquisition time 3 , magnetization
First delay(D1, pulse pulse )
5sec, Pulse Width(PW) 5 sec μ ,
Number of Excitation(NEX, Number of Scan) 32
, water non-suppression .
Free Induction Decay (FID) MATLAB(Mathworks Co.,
U.S.A) (SP72)
[22].
뇌 대사물질의 변화 측정 C.
SP72 FID
phase correction baseline correction . FID D
2O peak 4.7 ppm
, Gaussian shape fitting 5 (tCr,
Cho, Cr, NAA, Lac) peak .
peak (
)
Eq.(1) (T)
[7,17].
(1)
CS
ref, k , T
ref. D
2O peak
4.7 ppm ,
CS
refEq.(1)
Eq.(2) .
(2)
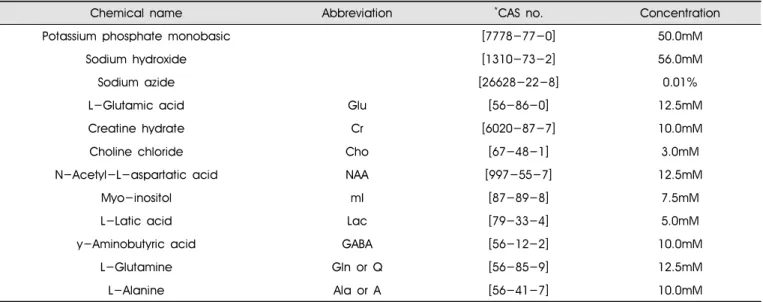
Chemical name Abbreviation *CAS no. Concentration
Potassium phosphate monobasic [7778-77-0] 50.0mM
Sodium hydroxide [1310-73-2] 56.0mM
Sodium azide [26628-22-8] 0.01%
L-Glutamic acid Glu [56-86-0] 12.5mM
Creatine hydrate Cr [6020-87-7] 10.0mM
Choline chloride Cho [67-48-1] 3.0mM
N-Acetyl-L-aspartatic acid NAA [997-55-7] 12.5mM
Myo-inositol mI [87-89-8] 7.5mM
L-Latic acid Lac [79-33-4] 5.0mM
y-Aminobutyric acid GABA [56-12-2] 10.0mM
L-Glutamine Gln or Q [56-85-9] 12.5mM
L-Alanine Ala or A [56-41-7] 10.0mM
*CAS no.: Chemical Abstracts Service Number.
표1. 뇌 모사 용매에 있는 각종 대사물질의 팬텀 성분
Table 1. Phantom ingredients of the various metabolites in the brain mimicking solution.
δ (T
ref) peak
ppm . δ (T)
peak .
.
통계적 분석 D.
SPSS (version 12.0 for Windows,
U.S.A) .
5 D
2O peak
.
, peak
(linear regression analysis) ,
(R
2) .
결 과 .
Ⅲ
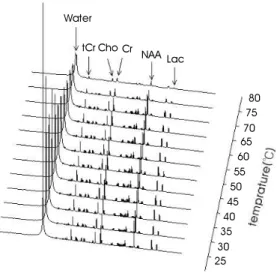
,
5 peak Fig. 1
. D
2O peak 4.7ppm D
2O
Water
tCr Cho Cr
NAA Lac
80 75 70 65 60 55 50 45 40 35 30 25
그림1. 온도 변화에 따른 뇌 대사물질의 자기공명 분광의 화학 이동 Fig. 1. Chemical shift of brain metabolites according to the temperature change
20 4.5
ppm
4.0
3.5
3.0
2.5
2.0
1.5
1.0
30 40 50 60 70 80
Temperature ( )℃ y=0.0086x + 3.6425
R2=0.9953
y=0.0088x + 2.9111 R2=0.9964
y=0.0091x + 2.7384 R2=0.9952
y=0.0089x + 1.7212 R2=0.9944
y=0.0088x + 1.0261 R2=0.9953
tCr Cho Cr NAA Lac
그림2. 표 의 선형 회귀 분석2.
Fig. 2. Linear regression analysis of Table 2
peak D
2O peak
. D
2O
peak peak
. T1
TR(Repetition time) peak . Fig. 1
peak Table 2 .
Fig. 2 Table 2 . 5
, tCr 0.0086
, Cr 0.0091 . 5
0.00884 ± 0.000182(n=5) , PRF(proton resonance frequency)
MR
( =-0.01ppm/ α ) [23],
(P<0.001) . R
20.99536 ± 0.0007(n=5)
.
고찰 및 결론 .
Ⅳ
MRI in vivo
shimming [24].
,
NAA [19-20].
MRI ,
.
NAA peak , Lac
peak .
marker .
pH
.
100 /ppm(0.01ppm/ ) [23]
.
, ,
[17-18].
2.45 -2.17 0.17 (P<0.001)
MRI
. peak
.
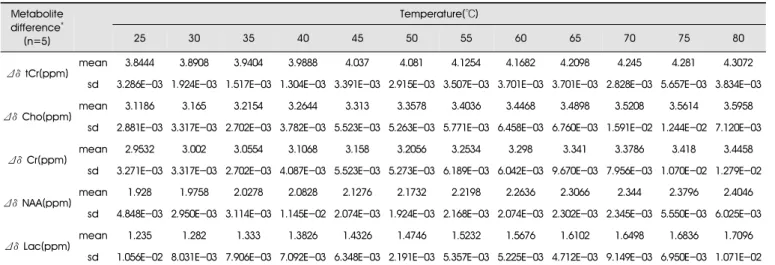
Metabolite difference*
(n=5)
Temperature( )℃
25 30 35 40 45 50 55 60 65 70 75 80
tCr(ppm) Δδ
mean 3.8444 3.8908 3.9404 3.9888 4.037 4.081 4.1254 4.1682 4.2098 4.245 4.281 4.3072 sd 3.286E-03 1.924E-03 1.517E-03 1.304E-03 3.391E-03 2.915E-03 3.507E-03 3.701E-03 3.701E-03 2.828E-03 5.657E-03 3.834E-03
Cho(ppm) Δδ
mean 3.1186 3.165 3.2154 3.2644 3.313 3.3578 3.4036 3.4468 3.4898 3.5208 3.5614 3.5958 sd 2.881E-03 3.317E-03 2.702E-03 3.782E-03 5.523E-03 5.263E-03 5.771E-03 6.458E-03 6.760E-03 1.591E-02 1.244E-02 7.120E-03
Cr(ppm) Δδ
mean 2.9532 3.002 3.0554 3.1068 3.158 3.2056 3.2534 3.298 3.341 3.3786 3.418 3.4458 sd 3.271E-03 3.317E-03 2.702E-03 4.087E-03 5.523E-03 5.273E-03 6.189E-03 6.042E-03 9.670E-03 7.956E-03 1.070E-02 1.279E-02
NAA(ppm) Δδ
mean 1.928 1.9758 2.0278 2.0828 2.1276 2.1732 2.2198 2.2636 2.3066 2.344 2.3796 2.4046 sd 4.848E-03 2.950E-03 3.114E-03 1.145E-02 2.074E-03 1.924E-03 2.168E-03 2.074E-03 2.302E-03 2.345E-03 5.550E-03 6.025E-03
Lac(ppm)
Δδ mean 1.235 1.282 1.333 1.3826 1.4326 1.4746 1.5232 1.5676 1.6102 1.6498 1.6836 1.7096
sd 1.056E-02 8.031E-03 7.906E-03 7.092E-03 6.348E-03 2.191E-03 5.357E-03 5.225E-03 4.712E-03 9.149E-03 6.950E-03 1.071E-02
*ΔδA=δD2O -δA whereδA (= CSA in text) is the chemical shift of the metabolite A.
표2. 온도에 따른 대사물질 변화의 기술통계
Table 2. Descriptive statistics of metabolite differences according to the temperature
.
NMR
. , peak
,
.
.
참고문헌
[1] Carter DL, MacFall JR, Clegg ST, Wan X, Prescott DM, Charles HC, Samulski TV. Magnetic resonance thermometry during hyperthermia for human high-grade sarcoma. Int J Radiat Oncol Biol Phys 1998;40: 815-822.
[2] Denis de Senneville B, Quesson B, Moonen CT. Magnetic resonance temperature imaging. Int J Hyperthermia 2005;21:
515-531.
[3] Ishihara Y, Calderon A, Watanabe H, Mori K, Okamoto K, Suzuki Y, Sato K, Kuroda K, Nakagawa N, Tsutsumi S. A precise and fast temperature mapping method using water proton chemical shift. In: Proceedings of the 11th Annual Meeting of SMRM, Berlin, 1992. p 4803.
[4] N. Mcdannold, “Quantitative MRI-based temperature mapping based on the proton resonant frequency shift: Review of validation studies,” IntJ. Hyperthermia, vol.21(6),pp533-546, 2005.
[5] Young IR, Hajnal JV, Roberts IG, Ling JX, Hill-Cottingham RJ, Oatridge A, Wilson JA. An evaluation of the effects of susceptibility change on water chemical shift method of temperature measurement in human peripheral muscle. Magn Reson Med 1996;36:366-374.
[6] Poorter JDE, Wagter CdE, Deene DE, Thomsen C, Stahlberg F, Achten E. Non-invasive MRI thermometry with the proton resonance frequency shift (PRF) method: In vivo results in human muscle. Magn Reson Med 1995;33:74-81.
[7] K. Kuroda, R. V. Mulkern, K. Oshio, and L. P. Panych, et al.,
“Temperature Mapping Using the Water Proton Chemical Shift:
Self-Referenced Method With Echo-Planar Spectroscopic Imaging,” Magn Reson Med, vol.43,pp.220-225,2000.
[8] Kuroda K, Oshio K, Chung AH, Hynynen K, Jolesz FA.
Temperature mapping using the water proton chemical shift: a chemical shift selective phase mapping (CSSPM) method. Magn Reson Med 1997;38:845-851.
[9] Moriaty JA, Chen JC, Purcell CM, Ang LC, Hinks RS, Peter RD, Henkelman RM, Plewes DB, Bronskill MJ, Kucharczyk W. MRI monitoring of interstitial microwave-induced heating and thermal lesions in rabbit brain in vivo. J Magn Reson Imag 1998;8:128-135.
[10] Kahn T, Harth T, Kiwit JCW, Schawarzmaier H-J, Wald C, Mödder U. In vivo MRI thermometry using a phase-sensitive sequence: preliminary experience during MRI-guided laser-induced interstitial thermotherapy of brain tumors. J Magn Reson Imag 1998;8:160-164.
[11] Kettenbach J, Silverman SG, Hata N, Kuroda K, Saiviroonporn P, Zientara GP, Morrison PR, Hushek SG, Black PM, Kikinis R, Jolesz FA. Monitoring and visualization technique for MR-guided laser ablation in an open MR system. J Magn Reson Imag 1998;8:933-943.
[12] Stollberger R, Huber D, Renhard W, Glanzer H. Influence of the temperature dependent susceptibility on monitoring of interstitial tissue coagulation using the proton resonance frequency method.
In: Proceedings of the 5th Annual Meeting of the ISMRM, Vancouver, Canada, 1997. p 1963.
[13] de Zwart JA, Vimeux FC, Delalande C, Moonen CTW. Fast lipid suppressed temperature mapping for the monitoring of focused ultrasound heated tissue. In: Proceedings of the 6th Annual Meeting of ISMRM, Sydney, Australia, 1998. p 350.
[14] Olsen TS, Weber UJ, Kammersgaard LP. Therapeutic hypothermia for acute stroke. Lancet Neurol 2003;2:410 - 6.
[15] Reith J, Jorgensen HS, Pedersen PM, Nakayama H, Raaschou HO, Jeppesen LL, et al. Body temperature in acute stroke: relation to stroke severity, infarct size, mortality, and outcome. Lancet 1996;347:422-5.
[16] Castillo J, Davalos A, Marrugat J, Noya M. Timing for fever-related brain damage in acute ischemic stroke. Stroke 1998;29:2455-60.
[17] Ian Marshall, et, al, Measurement of regional brain temperature using proton spectroscopic imaging: validation and application to acute ischemic stroke, Magn Reson Imaging (24) 2009;699-706.
[18] Daiya Ishigaki, Brain Temperature Measured Using Proton MR Spectroscopy Detects Cerebral Hemodynamic Impairment in Patients With Unilateral Chronic Major Cerebral Artery Steno-Occlusive Disease Comparison With Positron Emission Tomography, Stroke 2009;40;3012-3016.
[19] Cady EB, D’'Souza PC, Penrice J, Lorek A. The estimation of local brain temperature by in vivo 1H magnetic resonance spectroscopy. Magn Reson Med 1995;33:862-7.
[20] Corbett RJ, Laptook AR, Tollefsbol G, Kim B. Validation of a noninvasive method to measure brain temperature in vivo using 1H NMR spectroscopy. J Neurochem 1995;64:1224-30.
[21] Woo D. C., et. al, Investigation of varied MR spectra by TE and metabolite amount in the localized voxel using the MR cone-shape phantom, medical physics, 18-3, 2007;179-185.
[22] Paik M.Y., The Development of Signal Processing Software for Single - and Multi - Voxel MR Spectroscopy, Journal of the Institute of Electronics Engineers of Korea, v.39 no.5, 544-555.
[23] Germain D, Chevallier P, Laurent A, Saint-Jalmes H. MR monitoring of tumour thermal therapy. Magn Reson Materials Phys Biol Med (MAGMA) 2001;13:47-59.
[24] Woo D. C., et. al, Measurement and Assessment of Absolute Quantification from in Vitro Canine Brain Metabolites Using 500 MHz Proton Nuclear Magnetic Resonance Spectroscopy:
Preliminary Results, KSMRM, 12-2, 2008, 100-106.