PONKCS 방법을 이용한 비정질 실리카 함유 인공광물혼합시료의 정량 X-선회절 분석
Quantitative X-ray Diffraction Analysis of Synthetic Mineral Mixtures Including Amorphous Silica using the PONKCS Method
전 철 민(Chul-Min Chon)
1,
*⋅이 수 정(Sujeong Lee)1
⋅이 성 우(Sung Woo Lee)2
1
한국지질자원연구원(Korea Institute of Geoscience and Mineral Resources, 124 Gwahangno, Yuseong-gu, Daejeon 305-350, Korea),
2
충남대학교 공동실험실습관(Center for Research Facilities, Chungnam National University, 99 Daehak-ro, Yuseong-gu, Daejeon 305-764, Korea)
요약 : X-선회절 분석은 결정질 물질의 정량과 정성분석을 위한 가장 효과적인 분석기술이며, 따라서 회절자료를 이용한 매우 다양한 광물조성 정량분석법이 존재한다. 본 연구에서는 비정질 실리카, 석 영, 뮬라이트, 강옥으로 제조한 인공광물혼합시료를 대상으로 리트벨트법과 PONKCS (partial or no known crystal structure) 방법을 적용하여 정량 X-선회절 분석을 수행하였다. 100% 비정질 실리카와 내부표준시료 첨가 시료의 회절자료를 이용하여 PONKCS 방법으로 비정질 실리카의 결정 모형을 성 공적으로 구축하였다. 비정질 실리카의 경우, 원 중량 대비 치우침의 절대값 평균은 1.85 wt%였다. 비 정질 실리카의 함량이 작은 경우 상대적으로 높은 치우침을 보이는데, 이는 배경 회절패턴의 강도가 낮음에 기인하는 것으로 판단된다. 그밖에 석영, 뮬라이트, 강옥의 경우, 치우침의 절대값 평균은 각각 0.53 wt%, 0.87 wt%, 0.57 wt%였다. 내부표준물질 혼합법을 적용한 전통적인 리트벨트 정량분석 결 과와 비교할 때 PONKCS 방법이 비정질 실리카를 포함한 인공광물혼합시료에 대하여 신뢰도 높고 성공적인 정량 분석법임을 확인해 주었다.
주요어 :정량 X-선회절 분석, 리트벨트법, PONKCS법, 비정질 실리카, 광물혼합시료, 석탄회 ABSTRACT : X-ray powder diffraction is one of the most powerful techniques for qualitative and quantitative analysis of crystalline compounds. Thus, there exist a number of different methods for quantifying mineral mixtures using X- ray diffraction pattern. We present here the use of Rietveld and PONKCS (partial or no known crystal structure) methods for quantification of amorphous and crystallized mineral phases in synthetic mixtures of standard minerals (amorphous silica, quartz, mullite and corundum). Pawley phase model of amorphous silica was successfully built from the pattern of 100 wt% amorphous silica and internal standard-spiked samples by PONKCS approach. The average of absolute bias for quantities of amorphous silica was 1.85 wt%. The larger bias observed for lower quantities of amorphous silica is probably explained by low intensities of diffraction pattern. Averages of absolute bias for minerals were 0.53 wt% for quartz, 0.87 wt% for mullite and 0.57 wt% for
*Corresponding author: +82-42-868-3226, E-mail: [email protected]
corundum, respectively. The PONKCS approach achieved improved quantitative results compared with classical Rietveld method by using an internal standard.
Key words : quantitative X-ray diffraction analysis, Rietveld method, PONKCS method, amorphose silica, mineral mixtures, coal ash
서 론
X-선회절분석(XRD)은 광물을 감정하는데 있어 서 기본적이고도 효과적인 기기 분석방법이지만, 광물조성을 정량적으로 평가하는데 있어서는 분석 기술상 극복해야 할 변수가 많아서 그동안 다소 제 한적으로 적용되어 왔다. 최근에 X-선회절 분석 자 료에 대한 전산처리 기술의 발달과 기기 성능의 발 달에 따라 이 분석을 통해서 토양, 암석, 퇴적물 등 의 지질시료에 대한 광물조성을 정량적으로 분석 할 수 있는 상황에 이르렀다. X-선회절 분석에 의 한 지질시료의 다성분 정량분석 방법 중 회절강도 를 이용한 일반적인 방법은 외부표준물질로 강옥 (corundum)을 사용하는 matrix-flushing method (Chung, 1974a, b)과 reference intensity ratios (RIRs) 방법(Hillier, 2003) 등이 있다. 이러한 회절강 도 이용 방법은 특정 회절선의 회절 강도 또는 면 적을 이용하는 반면에, 리트벨트법(Rietveld meth- od)은 분석한 전체 구간의 회절자료를 이용하는 방 법(Full Pattern Fitting)이다. 리트벨트법에서는 분 말 회절패턴에 포함되어 있는 개별 광물의 결정구 조 정보와 기기분석 인자 정보를 이론적으로 재현 한 모형 패턴을 실제 측정된 분석 결과 패턴에 맞 추어 가며 그 차이를 최소화시키는 방식으로 각 광 물상의 결정구조가 결정된다. 리트벨트법은 본래 분말회절자료(powder diffraction data)를 이용하여 광물의 결정구조분석을 수행하기 위해 개발된 해 석법이었지만, 최근의 컴퓨터 관련 기술의 발달로 인해서 구조분석뿐만 아니라 광물혼합시료의 정량 분석에도 효과적으로 적용하게 되었다(Rietveld, 1969; Jones, 1989). 전통적으로 잘 알려진 Fullprof, GSAS, RIETAN 등의 리트벨트법 기반 결정구조 해석 프로그램은 무료로 배포하며 이를 이용하여 구조분석 및 정량분석을 수행할 수 있다. 또한 결 정학적 이론의 복잡성을 단순화하거나 사용의 편 의성을 향상시킨 다양한 종류의 리트벨트법 기반 프로그램들(SIEROQUANT
TM
, CeriusTM
, DIFF- RACPLUS
TOPAS 등)이 최근에 많이 개발되어 상용화되었고, 국내에서도 해양퇴적물 연구를 위하여 광물정량분석이 활용되고 있다(Son et al., 2009;
Moon et al., 2009; Cho et al., 2011). 또한 전구간 회절자료 이용법 중 결정구조 이론에 기반하지 않 고 표준광물시료의 실측 회절선을 데이터베이스화 하여 합성회절선으로 사용는 방식의 프로그램 (ROCKJOCK)을 이용하여 황철석의 정량분석이 수행되기도 하였다(Chon et al., 2006). 그러나 분 말 X-선회절패턴을 이용한 정량분석법은 시료의 전처리 방법과 기기 종류에 따른 해석자료 결과의 재현성 등과 관련된 정확도와 정밀도에 있어서 오 차와 오류가 발생할 수 있기 때문에 정량분석을 수 행함에 있어서 여전히 많은 주의가 필요하다.
DIFFRAC
PLUS
TOPAS (Bruker AXS Inc., Kar- lsruhe, Germany) 소프트웨어는 세 가지 종류의 X-선 회절패턴에 대한 Fitting 모델이 가능하다. 첫 번째는 결정구조 모델(structural model)로서 공간 군, 격자상수, 단위포 내 원소의 종류 및 위치 등 리트벨트법의 인자들을 모두 포함하고 있다. 두 번 째는 격자 모델(lattice model)로서 공간군, 격자상 수, 가상의 결정구조 인자를 포함하며, Pawley phase이나 Le Bail phase로도 표현된다. 세 번째는 피크 모델(peak phase model)로서 관련 피크의 위 치와 면적의 집합체로 표현된다. 이 중에 결정구조 모델만이 전통적인 리트벨트법에 기반한 정량 X- 선회절 분석에 적용가능하다. 그러나 리트벨트 기 반 정량 X-선회절 광물분석은 복합광물상 시료 내 모든 광물상이 동정가능하며, 모두 결정질이고, 각 각의 광물상에 대한 결정구조를 알고 있다는 가정 을 만족해야 한다. 따라서 일정량의 비정질이나 결 정도가 매우 낮은 광물상을 포함할 경우, 알려진 결정구조 정보 없이 리트벨트법에 의한 광물정량을 수행하는 것은 매우 어렵다(Bish and Howard, 1988;Hill and Howard, 1987; O’Connor and Raven, 1988).
이러한 경우, 시료에 포함되어 있지 않은 내부 표 준물질을 이용하거나(Williams and Van Riessen, 2010), PONKCS (partial or no known crystal struc- ture) 방법(Scarlett and Madsen, 2006)을 적용하여
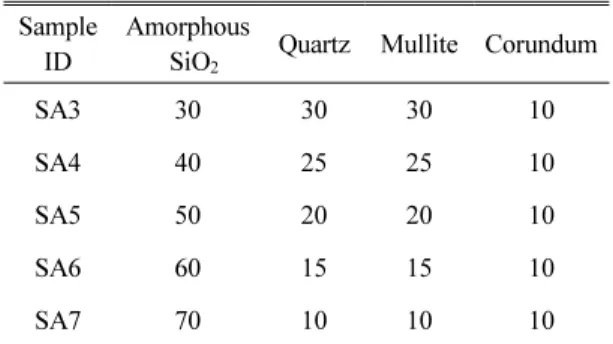
Sample ID
Amorphous
SiO
2
Quartz Mullite CorundumSA3 30 30 30 10
SA4 40 25 25 10
SA5 50 20 20 10
SA6 60 15 15 10
SA7 70 10 10 10
Table 1. Synthetic mineral mixtures simulating the simple compositions for fly ash (wt%)
광물의 정량분석을 수행할 수 있다. PONKCS 방법은 결정구조정보가 부족한 미지의 광물상을 임 의의 결정구조와 가상의 결정구조 인자로 재정의 하고, 이를 기반으로 혼합되어 있는 타 광물과의 정량적 분석을 리트벨트법에 기반하여 수행하는 방법이다.
석탄회는 석탄연소부산물로서 원연료의 성분, 광 물조성, 발전소 특성 및 운영방법에 따라서 다양한 조성을 갖는다. 결정질 광물조성은 주로 석영과 뮬 라이트이며, 약 40∼80 wt%의 비정질을 포함하고 있다(Vassilev and Vassileva, 1996). 최근 이러한 석탄회를 지오폴리머로 재활용하려는 연구가 활발 히 진행되고 있으며, 이때 실제 주 반응성을 가지 는 물질은 비정질의 규산알루미늄(aluminosilicate) 물질임이 알려졌다(Pietersen et al., 1989; Brouwers and Van Eijk, 2002; Sindhunata et al., 2006). 따 라서 석탄회 내의 비정질 물질과 결정질 광물상을 정량하는 것은 석탄회의 지오폴리머 재활용에 있 어서 필수적이며 우선적인 단계이다. 최근 Williams and Van Riessen (2010)은 X-선회절 분석과 X-선 형광 분석 자료를 사용하여 석탄회의 결정질 광물 을 정량화하고 이를 토대로 반응성 비정질량(비정 질 알루미나와 비정질 실리카)을 산출한 바 있다.
이들은 bulk X-선회절 분석뿐만 아니라 시료의 흡 수도를 고려한 최적의 내부 표준시료의 선택과 석 영, 뮬라이트, 산화철 등의 주요 구성 광물들에 대 한 전자현미경분석을 보완 수행하였다.
본 연구에서는 비정질 실리카를 많이 포함하고 있는 석탄회의 광물조성을 단순 모형화하여 주구 성광물인 비정질 실리카, 석영, 뮬라이트, 강옥으로 구성된 인공광물혼합시료를 제조하였다. 구성된 인 공광물혼합시료의 비정질 실리카에 대하여 PONKCS 방법을 적용한 정량 X-선회절 분석을 수행하였으 며, 내부표준물질을 이용한 전통적인 리트벨트법 기반의 정량방법과 그 결과를 비교하고 그 의미를 고찰하였다.
연구방법 시료 준비 및 X-선회절 분석
인공광물혼합시료는 각각 다른 함량의 비정질 실 리카(amorphous SiO
2
, 99.8%, Aldrich), 석영(SiO2
,∼99%, Sigma-Aldrich), 뮬라이트(Al
6
O13
Si2
, Aldrich), 강옥(α-Al2
O3
, NIST SRM 676a)으로 4 g씩 제조하였으며, 그 함량 비율은 표 1에 제시하였다. SA5 시료는 PONKCS 방법의 적용을 위한 내부표준물 질 혼합을 위하여 약 20 g 정도로 충분히 준비하 였다. 준비된 시료들은 모두 8 mL 에탄올을 이용 하여 미세분말화장치(micronizer, McCrone)에서 5 분간 5 µm 이하로 균질 혼합 및 미세분말화하였 으며, 50°C의 전기로에서 건조 후 아게이트 막자 사발에서 재분쇄하였다.
X-선회절 분석은 Cu target과 LynxEye position sensitive detector가 부착된 D8 Advance diffrac- tometer (Bruker-AXS)를 이용하여 수행하였다. 회 절 패턴은 5°∼100° 2θ 구간, 0.01° 스텝, 스텝당 1초, 30 rpm과 0.5 rps 회전형 시료 스테이지의 조 건으로 취득되었으며, 0.3° 발산슬릿과 2.5° 이차 Soller 슬릿이 사용되었으나 산란제거용 슬릿과 knife edge는 사용되지 않았다. 기기 인자(fundamental parameter)를 구하기 위해서 동일한 조건으로 표준 시료(LaB
6
, NIST SRM 660b)에 대한 X-선회절 패 턴을 취득하였다.리트벨트 구조분석 및 정량 X-선회절 분석 리트벨트법을 이용한 정량 X-선회절 분석법은 초기 결정구조 인자를 필요로 하며, 초기 결정구조 모델을 선택함에 있어서 매우 신중해야 한다. 일반 적으로 광물상의 신뢰도 있는 결정구조자료는 Inorganic Crystal Structure Database (ICSD, FIZ Karlsruhe)에서 얻을 수 있으며, 그밖에 미국 광물 학회의 American Mineralogist Crystal Structure Database (http://rruff.geo.arizona.edu/AMS/amcsd.
php)나 Crystallography Open Database (COD, http://www.crystallography.net/)에서 획득할 수 있 다. 본 연구에서 비정질 실리카 이외에 사용된 초
7.52 7.54 7.56 7.58 7.6 7.62
Lattice parameter a (A
)0.24
0.28 0.32 0.36 0.4 0.44
Si /Al
R 2 = 0.974
o
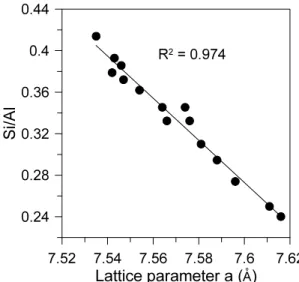
Fig. 1. Relationship between Si/Al ratio and the lattice parameter a of the commonly encountered mullite structures from the ICSD database.
Sample ID
Amorphous
SiO
2
Quartz Mullite Corundum CaF2
SAF1 45 18 18 9 10
SAF2 40 16 16 8 20
SAF3 35 14 14 7 30
SAF4 30 12 12 6 40
SAF5 25 10 10 5 50
Table 2. Five internal standard mixtures of SA5 sample and fluorite (CaF 2 ) (wt%)
기 결정구조 정보는 ICSD 2009에서 수집되었으며 석영, 뮬라이트, 강옥, 형석의 ICSD 번호는 각각 # 174, # 66448, # 63647, # 41413 번이다. 석영, 강 옥, 형석은 결정구조 및 구성원소가 단순하여 리트 벨트 구조분석 및 정량 X-선회절 분석 수행 시 초 기 결정구조 정보에 따른 차이가 크게 나타나지 않 는다. 그러나 뮬라이트의 경우, Al
4+2x
Si2-2x
O10-x
형 태의 고용체로서 x는 0.14∼0.49값을 가지며, 이에 따라 정량 X-선회절 분석에 큰 영향을 미치게 된 다. Si와 Al의 구성비는 결정구조의 격자상수 크기 와 매우 밀접한 상관관계를 가지기 때문에 초기 결 정구조를 선택함에 있어서 중요한 지표로 사용될 수 있다. 따라서 ICSD 2009의 뮬라이트 결정구조 들에서 제공되는 격자상수 a와 Si/Al 고용체 조성 비의 상관관계를 도시하였으며, 일차적 리트벨트 구조분석 결과로 얻어진 격자상수 a (7.5818 Å)와 가장 유사한 ICSD # 66448 (Al4.75
Si1.25
O9.63
)의 뮬 라이트 결정구조 정보를 초기 결정구조 모형으로 선택하였다(그림 1).리트벨트 구조분석은 Bruker DIFFRACPLUS TOPAS (version 4.2) 프로그램을 사용하여 계산되 었으며, 회절형태(peak shape)에 영향을 미치는 형 태함수 및 기기인자(instrumental parameter)는 X- 선분말회절 형태 표준시료인 LaB
6
의 회절자료를 이용하여 FPA (fundamental parameters approach) 방법을 적용하였다(Cheary and Coelho, 1992; Ortizet al., 2000). 리트벨트 구조분석 요소는 스케일 인자, 0점 인자, 기저선 함수 인자, 단위포 및 편향 성 인자, crystallite size 인자, 피크 형태 함수 인 자, 원자 자리 좌표 인자, 비대칭성 인자, 전체 열 진동 인자 등으로 구성되어 있으나, 본 연구에서는 구조분석 계산에는 스케일 인자, 0점 인자, 기저선 (background) 함수 인자, 단위포 인자, crystallite size (L) 인자만 포함시켰으며, 그 외의 인자는 초 기 구조모형의 기본 값으로 고정하였다.
PONKCS 방법을 적용할 비정질 실리카의 결정 모형을 구성하기 위하여 내부표준물질로는 형석 (fluorite, CaF
2
, 99.985%, Alfa)을 사용하였으며, 표준 검정선을 구하기 위하여 총 중량 4 g을 기준 으로 SA5 시료와 형석의 혼합 비율을 5가지로 준 비하였다(표 2). SA5 시료와 CaF2
비율은 9 : 1, 8 : 2, 7 : 3, 6 : 4, 5 : 5로서, 비정질 실리카와 CaF2
비 율로는 8.2 : 1.8, 6.7 : 3.3, 5.4 : 4.6, 5.3 : 5.7, 3.3 : 6.7에 해당한다. 내부표준시료 혼합시료들은 인공 광물혼합시료와 동일한 방법으로 미세분말화장치 를 이용하여 균질하게 혼합하고 미세분쇄하여 준 비하였다.연구결과 및 토의
PONKCS 방법을 적용하여 비정질 실리카의 결 정모형을 구성하기 위해서는 크게 두 단계의 과정 이 필요하다. 첫 번째로는 Pawley phase (lattice model)를 구성하는 단계이며, 두 번째는 ZMV (Z
= No. of formula units in unit cell, M = molec- ular mass of formula unit, V = unit cell volume) 인자를 검정하는 단계이다. 여기서 ZM은 단위포 중량을, V는 단위포 부피를 의미한다. 비정질 실리 카의 X-선회절 패턴은 약 21° 2θ 부근에서 폭넓은
0 20 40 60 80 100
2 Theta (degree)
-1000 0 1000 2000 3000 4000
Int ensi ty (cps)
Yobs Ycalc Yobs - Ycalc Bragg_position
Amorphous SiO
2Fig. 2. Powder diffraction pattern of amorphous SiO 2 overlaid with calculated pattern from Pawley phase model.
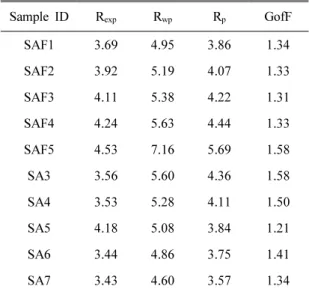
Sample ID R
exp
Rwp
Rp
GofFSAF1 3.69 4.95 3.86 1.34
SAF2 3.92 5.19 4.07 1.33
SAF3 4.11 5.38 4.22 1.31
SAF4 4.24 5.63 4.44 1.33
SAF5 4.53 7.16 5.69 1.58
SA3 3.56 5.60 4.36 1.58
SA4 3.53 5.28 4.11 1.50
SA5 4.18 5.08 3.84 1.21
SA6 3.44 4.86 3.75 1.41
SA7 3.43 4.60 3.57 1.34
Note: R
p
(profile), Rwp
(weighted profile), Rexp
(expec- ted profile), GofF (goodness of fit) according to Young (1993)Table 3. Summary of Rietveld analysis agreement indices for the internal standard mixtures and the synthetic mineral mixtures (%)
회절 피크를 보인다. 비정질 실리카를 Pawley phase 로 구성하기 위하여 21° 2θ 부근 회절선을 포함하 여 주변의 임의의 회절선을 수 개 추가하고, TOPAS 프로그램의 iterative least-squares indexing (LSI indexing)을 이용하여 최적의 공간군과 단위포 정 보를 가정하였다. 가정된 Pawley phase는 리트벨 트 구조분석으로 계산되어 사방정계의 공간군 P222, a = 7.304(33) (Å), b = 5.172(24) (Å), c = 4.508 (14) (Å), 단위포 부피 170.3(12) (Å
3
)로 설정되었 다. 이때 리트벨트 구조분석의 완성도를 지시하는 잔차 지수(residual index)인 Rexp
(expected profile R), Rwp
(weighted profile R), Rp
(profile R), GofF (Goodness of Fitness, Rwp
/Rexp
)는 각각 3.83%, 3.84%, 2.87%, 1.00으로서 충분한 신뢰도를 보여 주었다(그림 2). 실제 구조분석이 얼마나 잘 이루 어졌는지를 지시하는 지수는 GofF인데 Rwp
/Rexp
비로 나타내며 R
wp
과 Rexp
지수의 차이가 작을수록 구조분석이 성공적으로 수행되었다고 할 수 있다.리트벨트 정량 이론(Bish and Howard, 1988; Hill and Howard, 1987; O’Connor and Raven, 1988)에 따르면, 비정질 실리카의 ZM은 그 중량비(W), 구 조분석된 스케일 인자(S), 내부표준시료(CaF
2
)의 ZMV 인자에 의하여 결정되며(Scarlett and Madsen, 2006), 다음의 식으로 요약된다.
ZM
amrphous SiO2
는 SA5 시료와 5가지 CaF2
내부표준혼합시료의 구조분석 결과로부터 산출된 표준 검정선에 의해 결정되는데, 최소자승법으로 5가지
ZM
amrphous SiO2
계산 값과 실제 중량 값의 차가 최소화되는 값을 취하였다.
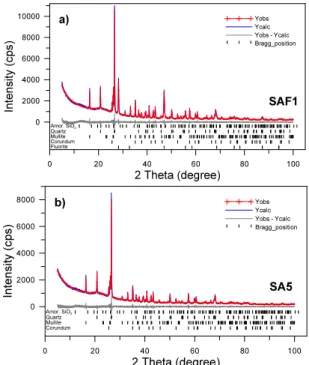
각각 5가지의 인공광물혼합시료와 내부표준물질 혼합시료에 대한 최종 리트벨트 구조분석의 신뢰 도를 지시하는 잔차 지수 R
exp
, Rwp
, Rp
, GofF (Young, 1993)는 표 3에 제시하였다. 또한 대표적인 시료에 대한 리트벨트 구조분석 결과들을 그림 3에 도시 하였다. 구조분석 계산 후 이론적으로 기대되는 지 수 Rexp
는 3.43∼4.53%, 가중치 지수 Rwp
는 4.60∼7.16%, R
p
는 3.57∼5.69%로 나타났다. GofF 값은 1.21∼1.58로서, 복합 광물상의 분말 X-선 결정구 조 해석 결과로서는 충분히 신뢰할 수 있는 수준으 로 판단된다. CaF2
내부표준물질 혼합시료의 리트 벨트 정량분석 결과와 인공광물혼합시료에 대한 PONKCS 정량분석 결과는 표 4와 그림 3에 제시 하였다.PONKCS 방법은 비정질 함유량이 높거나 구성 광물의 결정구조 정보가 부족하여 분말 X-선회절 자료와 결정구조 정보를 100% 활용하더라도 리트 벨트 결정구조 분석의 완성도를 높이기 어려운 점
Sample ID
Amorphous
SiO 2 Quartz mullite corundum CaF 2
SAF1 43.29(25) 18.558(67) 18.684(98) 9.467(66) 10 SAF2 38.13(20) 16.693(64) 16.88(10) 8.288(66) 20 SAF3 32.80(19) 14.680(61) 15.23(11) 7.291(66) 30 SAF4 28.43(18) 12.525(61) 12.90(12) 6.149(69) 40 SAF5 24.27(21) 10.121(70) 10.55(14) 5.060(81) 50 SA3 26.13(34) 31.14(16) 31.84(19) 10.898(91) - SA4 38.75(27) 25.26(13) 25.49(16) 10.495(83) - SA5 48.59(28) 20.56(12) 20.06(17) 10.785(97) - SA6 60.25(20) 14.938(85) 14.51(14) 10.297(83) - SA7 72.46(15) 9.388(58) 8.51(11) 9.643(74) -
Note: Esd’s on the last significant digit are in paren- thesesTable 4. Rietveld quantification results of the in- ternal standard mixtures, and PONKCS quantifica- tion results of the synthetic mixtures using the Pawley phase model for amorphous SiO 2 (wt %)
0 20 40 60 80 100
2 Theta (degree)
0 2000 4000 6000 8000 10000
In te ns ity (cp s)
Yobs Ycalc Yobs - Ycalc Bragg_position
SAF1
Amor. SiO2 Quartz Mullite Corundum Fluorite
a)
0 20 40 60 80 100
2 Theta (degree)
0 2000 4000 6000 8000
Int ensi ty ( cp s)
Yobs Ycalc Yobs - Ycalc Bragg_position
SA5
Amor. SiO2 Quartz Mullite Corundum
b)
Fig. 3. Plot showing the observed, calculated powder diffraction patterns and difference as determined from Rietveld refinement for a) SAF1 and b) SA5 samples. The Bragg reflections for the phases are indicated by vertical bars.
토광물 혼합물질, 시멘트 물질, 석탄회 등의 정량 분석에 매우 유용하게 사용될 수 있다. 최근 여러 연구자들이 라테라이트 내 pooly ordered 논트로나 이트와 강옥의 정량분석(Scarlett and Madsen, 2006;
Scarlett et al., 2008; Wang et al., 2011)이나, 비 산재 석탄회와 메타카올린을 원재료 기반으로 한 지오폴리머(geopolymer)의 정량분석(Williams et al., 2011)에 성공적으로 적용된 바 있다. 본 연구 에서 비정질 실리카를 Pawley phase 모형으로 구 성한 PONKCS 방법을 적용하여 정량분석을 수행 한 결과, 비정질 실리카의 경우, 원 중량 대비 치우 침(bias)의 절대값 평균은 1.85 wt%였다. 30 wt%
의 비정질 실리카를 포함한 SA3 시료를 제외하면 비정질 실리카의 원 중량 대비 3 wt% 이내의 치우 침를 보여주고 있다. 비정질 실리카 함량이 30 wt%로 낮아짐에 따라서 원중량에 대비하여 점차 저평가되는 한계를 보이는데, 이는 낮은 함량의 비 정질 실리카가 보이는 배경 회절패턴이 낮기 때문 인 것으로 판단된다. 그러나 SA3 시료의 경우 낮 은 함량의 비정질 실리카가 보이는 배경 회절패턴 이 낮음에도 불구하고, 원 중량 대비 4 wt% 정도 의 치우침을 보여주었다(그림 4).
그밖에 석영, 뮬라이트, 강옥의 경우, 치우침의 절대값 평균은 각각 0.53 wt%, 0.87 wt%, 0.57 wt%였다(표 4). 모든 시료에서 결정질 광물인 석 영, 뮬라이트, 강옥의 원 함량에 대하여 2 wt% 이 내의 치우침을 보여줌으로서 비교적 정확한 정밀 도의 정량분석이 수행되었음을 확인할 수 있었다 (그림 4). SA5 시료에 대하여 10∼50 wt% 비율의 내부표준물질(CaF
2
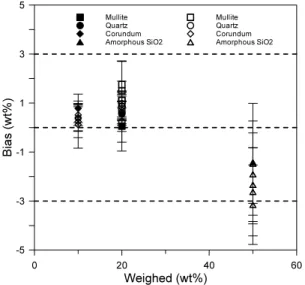
) 혼합법을 적용한 전통적인 리 트벨트 정량분석 결과들과 PONKCS 방법을 적용 한 결과를 비교하면, PONKCS 방법의 결과에서 비정질 실리카의 함량을 포함한 모든 광물조성의 원 중량에 대한 치우침이 상대적으로 낮게 나타났 다(그림 5). 따라서 PONKCS 방법은 비정질 실리 카를 포함한 인공광물혼합시료에 대하여 신뢰도 높고 성공적인 정량 분석법임을 확인해 주었다. 또 한 이러한 방법은 비정질 실리카를 포함하는 타 혼 합광물상 물질에 대한 분말 X-선회절 정량분석을 수행할 때 일반적으로 적용될 수 있을 것으로 기대 된다.0 20 40 60 80
Weighed (wt%)
-6 -4 -2 0 2 4 6
Bi as (wt%)
Amorphous SiO
2Quartz
Mullite Corundum
Fig. 4. PONKCS quantification results of the syn- thetic mixtures using the Pawley phase model for amorphous SiO 2 . Error bars represent a 6σ range of quantification results. The “bias” represents the dif- ference between the weighed and measured values.
0 20 40 60
Weighed (wt%)
-5 -3 -1 1 3 5
Bias ( w t% )
Mullite Quartz Corundum Amorphous SiO2
Mullite Quartz Corundum Amorphous SiO2
Fig. 5. Comparisons of overall bias between the PONKCS method (closed symbols) and the traditio- nal rietveld method (open symbols) using the dif- ferent ratios of internal standard (CaF 2 ) for SA5 sample including 50% amorphous SiO 2 . Error bars represent a 6σ range of quantification results. The
“bias” represents the difference between the weighed and measured values.
결 론
본 연구에서는 석탄회 광물조성의 단순 모사를 위하여 비정질 실리카, 석영, 뮬라이트, 강옥으로 제조한 인공광물혼합시료를 대상으로 리트벨트법 과 PONKCS 방법을 적용한 정량 X-선회절 분석 을 수행하였다.
PONKCS 방법을 적용한 비정질 실리카의 결정 모형은 사방정계의 공간군 P222, a = 7.304 (Å), b = 5.172 (Å), c = 4.508 (Å), 단위포 부피 170.3 (Å
3
)로 설정되었으며, ZMamrphous SiO2
는 2.117로 결 정되었다. PONKCS 방법을 이용한 정량분석 결과, 30 wt%의 비정질 실리카를 포함한 SA3 시료를 제외하면 비정질 실리카의 원 중량 대비 3 wt% 이 내의 치우침을 보여주었다. 또한 모든 시료에서 결 정질 광물인 석영, 뮬라이트, 강옥의 원 함량에 대 하여 2 wt% 이내의 치우침을 보여줌으로서 비교 적 정확한 정밀도의 정량분석이 수행되었음을 확 인하였다.내부표준물질 혼합법을 적용한 전통적 리트벨트 정량분석 결과에 비하여, PONKCS 방법의 결과에 서 모든 광물조성의 원 중량에 대한 치우침이 상대 적으로 낮게 나타났다. 이러한 결과는 PONKCS 방법이 비정질 실리카 포함 인공광물혼합시료에 대하여 신뢰도 높고 성공적인 정량분석법이며, 비 정질 실리카를 포함하는 타 광물혼합물질에 대한 분말 X-선회절 정량분석을 수행할 때 일반적으로
적용가능함을 지시한다.
사 사
본 논문은 환경부 글로벌탑 환경기술개발사업 중 폐금 속유용자원재활용기술개발사업의 지원에 의하여 연구되 었으며 이에 감사드립니다(과제번호: 11-E28-IR).
참고문헌
Bish, D.L. and Howard, S.A. (1988) Quantitative phase analysis using the Rietveld method. Journal of Applied Crystallography, 21, 86-91.
Brouwers, H.J.H. and Van Eijk, R.J. (2002) Fly ash re- activity: extension and application of a shrinking core model and thermodynamic approach. Journal of Materials Science, 37, 2129-2141.
Cheary, R.W. and Coelho, A. (1992) A fundamental parameters approach to X-ray line-profile fitting.
Journal of Applied Crystallography, 25, 109-121.
Cho, H.G., Kim, S.-O., Yi, H.-I., and Shin, K.-H.
(2011) Mineral distribution in the southeastern Yellow Sea surface sediments; KORDI cruise samples in
2010. Journal of the Mineralogical Society of Korea, 24, 205-216 (in Korean with English abstract).
Chon, C.-M., Kim, J.G., and Lee, G.H. (2006) Pyrite content using quantitative X-ray diffraction analysis and its application to prediction of acid rock drai- nage. Journal of the Mineralogical Society of Korea, 19, 71-80 (in Korean with English abstract).
Chung, F.H. (1974a) Quantitative Interpretation of X-ray Diffraction Patterns of Mixtures. I. Matrix- Flushing Method for Quantitative Multicomponent Analysis. Journal of Applied Crystallography, 7, 519-525.
Chung, F.H. (1974b) Quantitative Interpretation of X-ray Diffraction Patterns of Mixtures. II. Adiabatic Principle of X-ray Diffraction Analysis of Mixtures.
Journal of Applied Crystallography, 7, 526-531.
Hill, R.J. and Howard, C.J. (1987) Quantitative phase analysis from neutron powder diffraction data using the Rietveld method. Journal of Applied Crystallog- raphy, 20, 467-474.
Hillier, S. (2003) Quantitative analysis of clay and oth- er minerals in sandstones by X-ray powder dif- fraction (XRPD). In: Clay Minerals Cements in Sandstones (R.H. Worden and S. Morad, editors).
Special Publication 34, International Association of Sedimentologists, 213-251.
Jones, R.C. (1989) A computer program technique for X-ray diffraction curve fitting/peak decomposition.
In: Quantitative Mineral Analysis of Clays. Pevear D.R., and Mumpton F.A. (eds.), cms workshop lec- tures, 1, The Clay Minerals Society, 39-52.
Moon, D.H., Cho, H.G., Kim, S.-O., Yi, H.-I., and Do, J.Y. (2009) Quantitative X-ray diffraction analysis of the Gyeonggi bay surface sediments. Journal of the Mineralogical Society of Korea, 22, 279-288 (in Korean with English abstract).
O’Connor, B.H. and Raven, M.D. (1988) Application of the Rietveld refinement procedure in assaying powdered mixtures. Powder Diffraction, 3, 2-6.
Ortiz, A.L., Cumbrera, F.L., Sanchez-Bajo, F., Guiber- teau, F., and Caruso, R. (2000) Fundamental Para- meters Approach in the Rietveld Method: A Study of the Stability of Results Versus the Accuracy of the Instrumental Profile. Journal of the European Ceramic Society, 20, 1845-1851.
Pietersen, H.S., Fraay, A.L.A., and Bijen, J.M. (1989) Reactivity of fly ash at high pH, in fly ash and coal conversion by-products: Characterization, utilization and disposal VI. In: Glasser FP, Day RL, editors.
Materials research society symposium proceedings.
Materials Research Society, 139.
Rietveld, H.M. (1969) A profile refinement method for nuclear and magnetic structures. Journal of Applied Crystallography, 2, 65-71.
Scarlett, N.V.Y. and Madsen, I.C. (2006) Quantifica- tion of phases with partial or no known crystal structures. Powder Diffraction, 21, 278-284.
Scarlett, N.V.Y., Madsen, I.C., and Whittington, B.I.
(2008) Time-resolved diffraction studies into the pressure acid leaching of nickel laterite ores: a com- parison of laboratory and synchrotron X-ray experi- ments. Journal of Applied Crystallography, 41, 572- 583.
Sindhunata, van Deventer, J.S.J., Lukey, G.C., and Xu, H. (2006) Effect of curing temperature and silicate concentration on fly-ash-based geopolymerization.
Industrial & Engineering Chemistry, 45, 3559-3568.
Son, B.-K., Kim, H.-J., and Ahn, Gi.-O. (2009) Mineral composition of the sediment of Ulleung basin, Korea. Journal of the Mineralogical Society of Korea, 22, 115-127 (in Korean with English abstract).
Vassilev S.V. and Vassileva C.G. (1996) Occurrence, abundance and origin of minerals in coals and coal ashes. Fuel Processing Technology, 48, 85-106.
Wang, X., Li, J., Hart, R.D., Van Riessen, A., and McDonald, R. (2011) Quantitative X-ray diffraction phase analysis of poorly ordered nontronite clay in nickel laterites. Journal of Applied Crystallography, 44, 902-910.
Williams, R.P. and Van Riessen, A. (2010) Determina- tion of the reactive component of fly ashes for geo- polymer production using XRF and XRD. Fuel, 89, 3683-3692.
Williams, R.P. Hart, R.D., and Van Riessen, A. (2011) Quantification of the extent of reaction of meta- kaolin-based geopolymers using X-ray diffraction, scanning electron microscopy, and energy-dispersive spectroscopy, Journal of the American Ceramic Society, 94, 2663-2670.
Young, R.A. (1993) The Rietveld Method. IUCr Mono- graphs on Crystallography, Vol. 5, Oxford Universi- ty Press, 298p.
접수일(2012년 12월 22일), 수정일(1차 : 2013년 2월 27일), 게재확정일(2013년 2월 28일), 책임편집위원 : 이용재