Korean J. Mineral. Petrol. Vol. 34, No. 2, p. 147~156, 2021 https://doi.org/10.22807/KJMP.2021.34.2.147
몽골 남부 족도르 동 광화 지역 석영맥의 유체포유물 연구
오트곤-에르덴 다바수렌1,2·이범한1,2*·김남훈1·고상모1,2·유봉철1,2·서정훈3
1한국지질자원연구원 DMR 융합연구단
2과학기술연합대학원대학교 광물·지하수자원학과
3인하대학교 에너지자원공학과
Fluid Inclusion Study of Quartz Veins in Zogdor Copper Mineralized Area, Southern Mongolia
Otgon-Erdene Davaasuren1,2, Bum Han Lee1,2*, Namhoon Kim1, Sang-Mo Koh1,2, Bong Chul Yoo1,2, and Jung Hun Seo3
1Convergence Research Center for Development of Mineral Resources (DMR), Korea Institute of Geoscience and Mineral Resources
2Department of Mineral & Groundwater Resources, University of Science and Technology (UST)
3Department of Energy and Resources Engineering, Inha University
요 약: 몽골 남부 구르반사이한 호상 열도 지형 내 족도르 지역의 함동 석영맥에 대한 유체포유물 연구 결 과를 보고한다. 족도르 지역에는 후기 백악기 퇴적층 내에 정치된 화강섬록 반암 내에 구조적으로 제어되는 동 광화작용이 나타난다. 이러한 화강섬록 반암 내에 동 광물 함유 석영맥은 프로필리틱 변질대의 석영-녹렴 석-자철석 및 석영-자철석을 포함하는 열수 변질 양상을 보인다. 석영맥은 광물 조합에 따라 두 가지 유형으 로 분류되며 주로 황동석과 함께 산출되고 드물게는 반동석, 자철석, 황철석과 함께 산출된다. 석영-자철석±
황동석 및 석영-녹렴석-자철석 조합의 석영맥 내 유체포유물은 기포 크기 5-30 vol.%, 염농도 2-13 wt.% NaCl, 균질화 온도 107-270°C인 2상의 수성 포유물이다. 관찰된 석영맥의 광물 조합과 모암의 지구화학적 특성 및 변질 양상 등으로 판단했을 때, 유체포유물 자료는 연구 지역이 반암동 관련 광화작용의 프로필리틱 변질 영 역에 해당함을 보여준다.
핵심어: 남부 몽골, 족도르, 유체포유물, 석영맥, 반암동 광화작용
Abstract:
We report fluid inclusion study results of copper-bearing quartz veins in Zogdor area, which is located within the Gurvansayhan island arc terrane of Southern Mongolia. At the Zogdor area, structure- controlled copper mineralization is hosted in granodiorite-porphyry, which emplaced in the late Cretaceous formation. Within this granodiorite porphyry, copper-bearing quartz veins are associated with the hydrothermal alteration that includes quartz-epidote-magnetite, and quartz-magnetite in the propylitic zones. The veins are classified into two types, according to their mineral composition, which occur mainly as chalcopyrite, rare amounts of bornite, magnetite, and pyrite. Fluid inclusions in the quartz veins from the quartz-magnetite±chalcopyrite and quartz-epidote-magnetite veins are two-phase aqueous inclusions having bubble sizes of 5-30 vol.%, evident salinities of 2.0-22.6 wt.% NaCl, and homogenization temperatures of 107-270°C. Based on mineral assemblages of the observed veins, along with the geochemical properties and alteration faces of the host rock, fluid inclusion data show that the study area corresponds to propylitic alteration zone in the porphyry Cu related mineralization.Keywords:
Southern Mongolia, Zogdor, fluid inclusions, quartz vein, porphyry copper mineralization*Corresponding author Tel: +82-42-868-3946 E-mail: [email protected]
INTRODUCTION
The Zogdor copper mineralization area is located in the Gurvansayhan terrane of the South Gobi metallo-
genic province of Southern Mongolia (Figs. 1a and b), about 50 km northwest of the Oyu Tolgoi copper-gold deposit. This province hosts many mineral deposits including Cu-Au-(Mo) and Cu-Mo-(Au) bearing metal-
Fig. 1. (a) Simplified terrane subdivision map of Southern Mongolia (Badarch et al., 2002), inset shows the copper metal-
logenic belt of Mongolia. (b) Geological map of the Southern Mongolia with major porphyry Cu-Au deposits
and study area. Copper metallogenic provinces, belts: I-Altay, II-Ikh Nuur, III-Khangay, IV-Govi-Altay, V-Baydrag-
Bayankhongor, VI-Nuuruudiin khundii, VII-Selenge-Erdenet, VIII-Burd, IX-Khentii, X-Eastern Mongolia, XI-Southern
Mongolia.
lic ore deposits (Windley et al., 2007), and is one of the largest metallogenic district in Mongolia (Kirwin et al., 2005). These metallic deposits in the South Gobi metallogenic provinces are spatially associated with late Paleozoic igneous activity and have temporally min- eralization ages of 372-324 Ma (Khashgerel et al., 2006;
Watanabe and Stein, 2000; Otgon-Erdene et al., in preparation). Recently, an increasing number of por- phyry Cu-Au deposits (e.g., Khatsavch, Kharmagtai, and Shuteen) and Cu prospecting area (e.g., Nariin khudag, Oyut Ulaan, Ikh Shankhai, and Zogdor) have been discovered along the Southern Mongolia (Batkhishig et al., 2010; Blight et al., 2010; Boldbaatar et al., 2019;
Otgon-Erdene et al., 2016; Son et al., 2019). It indi- cates that the South Gobi region is one of the highest potential area for porphyry-type mineralization. In addition, a new copper mineralized prospecting area
was recently discovered in the Zogdor area (Otgon- Erdene et al., in preparation).
In this study, we carried out microthermometric analy- sis for fluid inclusion from copper-bearing veins in order to determine the nature, temperature, and pressure environ- ments of the mineralizing fluids to clarify their potential sources in South Gobi metallogenic province, and to suggest a possible genetic model for the mineraliza- tion in the Zogdor area.
GEOLOGICAL BACKGROUND OF THE STUDY AREA
According to Badarch et al. (2002), the study area belongs to the Gurvansayhan terrane (Fig. 1b), which is considered to have formed via complex processes of island-arc accretion and paleo-oceanic rifting. The
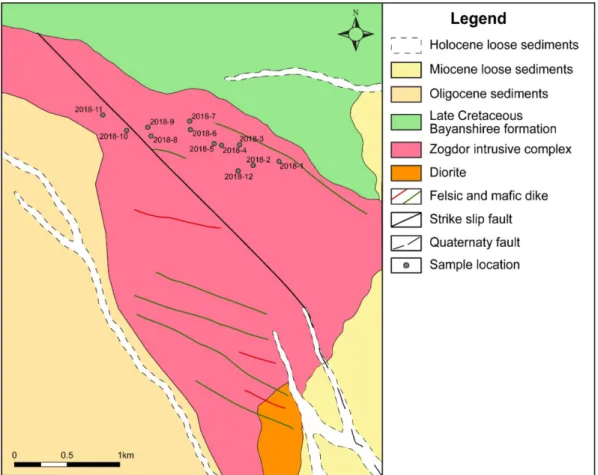
Fig. 2. Geological map of the study area (modified from Jamiyandorj and Zoljargal, 2010), with sample locations.
Gurvansayhan terrane is dominated by Lower to Mid- dle Paleozoic arc-related volcanic and volcanoclastic rocks, with fragments of ophiolites and mélanges, and Silurian and Devonian terrigenous and volcanoclastic rocks distributed along its northern margin (Badarch et al., 2002; Lamb and Badarch, 2001; Windley et al., 2007; Zorin et al., 1993). The terrane developed during several episodes of magmatism in the Silurian-Mid- dle Devonian and Late Devonian to Permian and porphyry-type mineralization were formed during the Devonian to Carboniferous period. (Perello et al., 2001;
Wainwright et al., 2011; Windley et al., 2007).
The sedimentary rocks in the area consist of the Upper Cretaceous Bayanshiree Formation, which con-
tains mainly sandstone and siltstone (Fig. 2). A granodio- rite porphyry is the ore-hosting intrusion and occurs as stocks in the central-western part of the mineraliza- tion district (Fig. 3a). The emplacement ages for the ore-hosting granodiorite and monzogranite are dated to ca. 337 Ma, and 330 Ma, respectively (Otgon-Erdene, 2017). The Zogdor Cu area is found near granodiorite porphyry contact zone and occurs as complex Cu-bear- ing quartz veins composed of veinlets and dissemi- nated mineralization (Fig. 3b). The major sulfides of ores are pyrite, chalcopyrite, galena, and pyrrhotite, and subordinate with bornite, limonite, malachite, and chalcocite (Fig. 3c).
Fig. 3. Photographs and photomicrographs of quartz vein slabs and minerals from the Zogdor area. (a) View of field area
facing east, (b) outcrop of host granodiorite porphyry with supergene minerals, (c) Euhedral and massive magnetite
crystals in white and transparent quartz veins outcropping in sample 2018-3. (d) and (g) Quartz-magnetite-epidote
veins, (e) and (h) A polished slab showing a massive white and transparent quartz-magnetite±epidote vein. (f) and
(i) under reflected and transmitted light showing the mineralization in quartz vein. Abbreviations of minerals: Bn,
Bornite; Ccp, chalcopyrite; Ep, epidote; Grd, granodiorite; Mag, magnetite; Mal, Malachite; Qz, quartz.
COPPER BEARING VEINS
Petrographic descriptions including vein–host min- eralogy, mineral paragenesis, and alteration faces from the seven quartz samples is summarized in Table 1.
The veins were divided into two types (type I and II) on the basis of their major mineral assemblages: (1) quartz - magnetite ± (chalcopyrite); and (2) quartz - epidote - (magnetite) (Fig. 3d and 3g). Type I veins are marked by massive magnetite, in which vein is ca.
1~1.5 cm in wide, while minor epidote precipitated at vein margins (Fig. 3e and 3f). Supergene malachite has filled in the fractures and along grain boundaries (Fig. 3g). Type II veins are composed of subhedral pyrite and 10~50 µm chalcopyrite grains under the micro- scope showing 1~2 cm in width (Fig. 3h and 3i).
The evidences of hydrothermal hypogene and/or supergene ore-forming processes at the Zogdor are followings; the cross-cutting relationships of ore veins, the mineral assemblages, and the paragenetic sequences (Fig. 4). Stage I is represented by quartz – K–feld- spar – biotite – epidote – chlorite – sericite ± chalcopy- rite ± magnetite veinlets or veins. Stage II can be represented by quartz – epidote ± chalcopyrite – pyrite – magne- tite ± bornite ± covellite veins. Stage III is represented by quartz – calcite ± chalcopyrite ± pyrite – hematite veins associated with propylitic alteration. Secondary min-
erals such as malachite and azurite were formed in the supergene zone due to surface weathering and groundwater.
SAMPLES AND METHODS
Fluid Inclusion Microthermometry
We surveyed twelve trenches and collected four samples from ore-bearing quartz veins in the Zogdor area
Table 1. Descriptions of quartz veins from the Zogdor area
Sample # Host stratigraphy Vein type Alteration Vein description Vein minerals 2018-1 Late Carboniferous
granodiorite Qz-Ep-Mag propylitic stockwork Qz veinlets with Mag,
Ccp Mag, Ccp
2018-2 Late Carboniferous
granodiorite Qz-Ep barren 1 cm massive Qz vein with Hem Hem 2018-3 Late Carboniferous
granodiorite Qz-Mag±Ccp propylitic massive Qz-Mag-Ccp veins up to
10-15 cm thick Mag, Ccp 2018-4 Late Carboniferous
granodiorite Qz-Ep-Mag potassic massive Qz-Mag-Ccp-Ep veins up to
5-10 cm thick Mag, Ccp 2018-5 Late Carboniferous
granodiorite Qz-Mag±Ccp propylitic 5-10 cm massive Qz vein with
Mag, Ep Mag
2018-6 Late Carboniferous
granodiorite Qz-Ep-Mag propylitic 0.5-1 cm Qz veinlets with Mag, Ep Mag 2018-7 Late Carboniferous
granodiorite Qz-Ep-Mag propylitic 0.5 cm Qz veinlets Mag
Abbreviations of minerals: Ccp, chalcopyrite; Ep, epidote; Hem, hematite; Mag, magnetite; Qz, quartz
Fig. 4. Mineral paragenesis of the quartz vein.
(Fig. 2 and Table 2). Double-polished quartz pieces were prepared, and pseudo-secondary fluid inclusion assem- blages in the quartz grains were chosen by petrography.
Microthermometry of the inclusions was analyzed by a Linkam FTIR 600 heating–freezing stage at Inha University. The ice-melting temperature (T
m ice
) and homogenization temperature (Th
) were determined from 21 aqueous inclusion assemblages (Table 2), with at least three single inclusions measured in each assem- blage. The apparent salinities (NaCl wt.%) were cal- culated from the Tm ice
(Bodnar and Vityk, 1994; Driesner and Heinrich, 2007). Based on the two-phase surface NaCl–H2
O model system (Driesner and Heinrich, 2007), Th
values were combined with the fluid salinities to estimate the minimum entrapment pressure and iso- choric curves.RESULTS AND DISCUSSION
Liquid-rich two-phase inclusions with bubble sizes of 5-30 vol.% are predominant in the quartz veins but salt-bearing brine inclusions were not observed (Fig. 5). Homogenization temperature and salinity from the quartz – magnetite ± chalcopyrite and quartz – epidote – magnetite vein–types have modal range of 107–270°C and 2–22.6 wt.% NaCl equivalent, respec- tively (Fig. 6). These values are consistent to what is expected from an propylitic alteration zone (Bodnar et al., 2014). Fig. 7 shows the relationship between the homogenization temperature and salinity of fluid inclu- sion of porphyry Cu deposits (Bodnar et al., 2014), which have been associated with alteration type and/or mineralization for 13 deposits representing 1915
Table 2. Results of microthermometry of quartz-hosted fluid inclusion assemblages from the quartz–magnetite–epi-
dote±(chalcopyrite) veins in the study area
Fluid inclusion assemblage Vein type Phase T
m ice
Salinity Th
Density (Pcalc
)o
C wt.% NaClo
C g/cm3
bar2018-3-1_B5-7 Qz-Mag±Ccp L+V av. -1.7 2.9 199 0.89 15
2018-3-1_B5-10 Qz-Mag±Ccp L+V av. -2.6 4.3 142 0.95 4
2018-3-1_B5-11 Qz-Mag±Ccp L+V av. 2.1 3.5 270 0.80 54
2018-3_chip1_B5-1 Qz-Mag±Ccp L+V av. -9.4 13.2 195 0.97 12
2018-3_chip1_B5-3 Qz-Mag±Ccp L+V av. -4.9 7.7 181 0.94 10
2018-3_chip1_B10-2 Qz-Mag±Ccp L+V av. -1.2 2.0 263 0.80 49
2018-3_chip1_B10-3 Qz-Mag±Ccp L+V av. -4.9 7.7 194 0.93 13
2018-3_chip2_B5-2 Qz-Mag±Ccp L+V av. -2.8 4.6 141 0.95 4
2018-3_chip2_B5-4 Qz-Mag±Ccp L+V av. -2.2 3.7 144 0.94 4
2018-3_chip2_B5-6 Qz-Mag±Ccp L+V av. -2.5 4.1 129 0.96 3
2018-3_chip2_B20-1 Qz-Mag±Ccp L+V av. -2.7 4.5 219 0.87 22
2018-3_chip2_B20-4 Qz-Mag±Ccp L+V av. -3.9 6.3 220 0.89 22
2018-3_chip2_B30-2 Qz-Mag±Ccp L+V av. -4.3 6.9 247 0.86 36
2018-3_chip3_B5-1 Qz-Mag±Ccp L+V av. -20.3 22.6 123 1.10 2
2018-3_chip3_B5-2 Qz-Mag±Ccp L+V av. -8.7 12.5 116 1.00 2
2018-3_chip3_B5-3 Qz-Mag±Ccp L+V av. -8.1 11.8 107 1.06 1
2018-3_chip3_B5-4 Qz-Mag±Ccp L+V av. -7.2 10.7 131 1.01 3
2018-3_chip3_B5-5 Qz-Mag±Ccp L+V av. -2.4 4.0 164 0.93 7
2018-6-2_B10-1 Qz-Ep-Mag L+V av. -1.5 2.6 152 0.93 5
2018-6-4_B5-1 Qz-Ep-Mag L+V av. -1.4 2.4 115 0.96 2
2018-6-4_B5-2 Qz-Ep-Mag L+V av. -1.1 2.0 124 0.95 2
Notes: L = liquid, V = vapor, av. = average
Abbreviations of minerals: Ccp, chalcopyrite; Ep, epidote; Mag, magnetite; Qz, quartz
data. Compared to the argillic or propylitic zone, the potassic and phyllic zone data are much more abundant.
Fluid inclusions associated with phyllic and potassic alteration show a similar range of salinities (mainly 0–60 wt.% NaCl), and homogenization temperatures in the phyllic zone are typically between 200 and 400°C with few values lower than 400°C, whereas in the potassic zone, temperatures spread from 250 to 600°C, and rather higher than 600°C. In the pro- pylitic zone, T
h
and salinities are between 100 and 350°C and between 0 and 25 wt.% NaCl, respec- tively (Fig. 7).Microthermometric measurements, homogenization temperature, and salinity show the presence of two- phase (L+V) of ore fluids: (1) low temperature (115 to 152°C) and salinity (2.0 to 2.6 wt.% NaCl) in rela- tion to quartz – epidote vein and (2) low to moder-
Fig. 5. Photomicrographs of representative types of fluid inclusions in quartz from the study area. (a) and (b) two phase liquid-rich inclusions in quartz-magnetite±chalcopyrite veins, (c) and (d) two phase inclusions in quartz-epidote-magne- tite veins.
Fig. 6. Plot of homogenization temperatures versus salini-
ties obtained from microthermometries of fluid
inclusion assemblages. The isobaric curves and salini-
ties were calculated based on the model H
2O–NaCl
system (Driesner and Heinrich, 2007). Abbreviations
of minerals: Ccp, chalcopyrite; Ep, epidote; Mag,
magnetite; Qz, quartz.
Fig. 7. Homogenization temperatures vs. salinities of specific liquid-rich, vapor-rich, and halite-bearing fluid inclusions plot- ted as a function of the alteration zone (potassic, phyllic, and propylitic) (Bodnar et al., 2014).
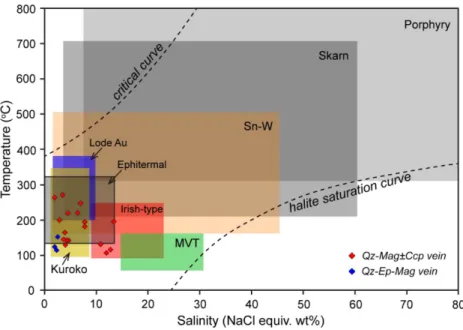
Fig. 8. Homogenization temperatures vs. salinity plot (Wilkinson, 2001) for fluid inclusion data. Abbreviations of minerals:
Ccp, chalcopyrite; Ep, epidote; Mag, magnetite; Qz, quartz.
ate temperature (107 to 270°C) and salinity (2.0 to 22.6 wt.% NaCl) in relation to quartz – magnetite ± chalcopyrite vein. The microthermometric results pre- sented in Fig. 8 and the low salinity of the fluid inclu- sions suggest that mineralization in Zogdor area occurred within distal environment of porphyry Cu deposit (Wilkinson, 2001). This study represents the result of a preliminary exploration phase and further works are needed on fluid inclusion from drilling samples on depth.
CONCLUSION
1) Two types of quartz veins (type I and II) are dominant in the Zogdor area; type I = quartz – magne- tite ± (chalcopyrite), and type =quartz – epidote – (mag- netite) associated with the granodiorite-porphyry.
2) Phyllic and propylitic alteration by hydrothermal activities are dominant in granodiorite-porphyry intru- sion. Cu mineralization is characterized by dissemi- nated ores, stockwork veins, and minor hydrothermal breccias. The main ore minerals are pyrite, chalco- pyrite, magnetite, and/or bornite.
3) Fluid Inclusion data indicate that the ore–form- ing fluids contain mainly two–phase liquid–rich inclu- sions and low to moderate temperature (107-270°C) and salinities (2.0-22.6 wt.%).
4) Based on mineral assemblages of the observed veins, along with the geochemical properties and alter- ation faces of the host rock, our results indicate that the study area is related with porphyry Cu mineralization and corresponds to propylitic zone.
ACKNOWLEDGEMENTS
We thank Mr. Jun Hee Lee and Mr. Tongha Lee at Inha University for their assistance in microther- mometry experiments. We are grateful to Dr. Sang Joon Pak and Dr. Chang Seong Kim for their careful and constructive comments, which have greatly improved the manuscript. This work was supported by the National Research Council of Science & Technology (NST) grant by the Korea government (MSIT) (No. CRC-15-06- KIGAM).