pISSN: 0378-6471 eISSN: 2092-9374 DOI : 10.3341/jkos.2011.52.8.943
= 증례보고 =
스펙트럼 도메인 빛간섭단층촬영에서 발생하는 오류
김형준⋅정혜원⋅김형찬 건국대학교 의학전문대학원 안과학교실
목적: 스펙트럼 도메인 빛간섭단층촬영에서 발생하는 오류의 빈도 및 황반두께 측정에 미치는 영향을 알아보고자 하였다.
대상과 방법: 267명 267안을 대상으로 Spectralis HRA+OCT를 이용해 검사를 시행하고 이를 후향적으로 분석하였다. 정상안과 망막질 환이 있는 안에서 각각 전체 볼륨스캔과 중심부 1 mm 영역내에서 관찰되는 오류에 대해서 조사하였고 망막질환의 분류에 따른 오류의 빈도를 비교하였다.
결과: 전체 볼륨스캔의 79.4%에서, 중심부 1 mm 영역 내에서는 26.6%에서 적어도 하나 이상의 오류가 관찰되었다. 내망막 경계설정 오류는 망막전막(36.1%), 외망막 경계설정 오류는 습성나이관련황반변성(40.0%)에서 가장 높은 빈도를 보였다. 중심부 1 mm 영역 내 에서는 임상적으로 유의한 오류가 6.4%에서 관찰되었으며 습성나이관련황반변성에서 43.3%로 가장 흔했다.
결론: SD OCT 볼륨스캔에서 오류는 흔히 발생하며, 중심부 1 mm 영역 내에서는 상대적으로 오류의 발생빈도가 낮았으나 임상적으로 유의한 오류가 발생할 수 있고 이는 망막두께 측정에 영향을 줄 수 있으므로 세심한 주의가 필요하다.
<대한안과학회지 2011;52(8):943-951>
■ 접 수 일: 2010년 12월 16일 ■ 심사통과일: 2011년 2월 11일
■ 게재허가일: 2011년 5월 17일
■ 책 임 저 자: 김 형 찬
서울시 광진구 화양동 4-12 건국대학교병원 안과
Tel: 02-2030-8180, Fax: 02-2030-5273 E-mail: [email protected]
* 본 논문의 요지는 2010년 대한안과학회 제104회 학술대회에서 구연으로 발표되었음.
빛간섭단층촬영(optical coherence tomography, OCT)은 망막의 단층을 비침습적으로 촬영하여 고해상도의 영상을 얻을 수 있는 진단 장비로서 망막, 특히 황반질환의 진단, 경과관찰, 치료에 매우 중요한 검사이다. 아직까지 널리 쓰 이고 있는 time domain (TD) OCT는 10 μm의 축 방향 해 상도와 초당 400의 A scan 속도를 갖고 있으며 참조거울이 움직이면서 시간에 따른 신호를 측정해 속도가 느리다는 단점이 있다. 따라서 정확한 망막상태를 평가하기 어렵고 다양한 오류가 생길 수 있으며 특히 망막질환이 있는 경우 그 빈도가 높다.1-7 Ray et al4은 TD OCT에서 발생하는 오 류를 내망막 경계설정 오류(inner retina misidentification), 외망막 경계설정 오류(outer retina misidentification), 이미 지등록 오류(out of register), 중심부이탈 오류(off cen- ter), 부적합 영상획득 오류(degraded), 주변부 영상절단 오류(cut edge) 등 6가지로 분류하였다. 나이관련황반변성, 당뇨황반부종 등 다양한 황반부 질환의 치료효과 판정 및 관련 임상연구에는 정확한 황반두께 측정값이 대단히중요
하다. 최근에 유리체강내 항혈관내피성장인자(anti-vascular endothelial growth factor, anti-VEGF) 주입 치료가 널리 보급되면서 치료 효과 판정에 정확한 황반두께 측정이 필 수적이 되었으나 TD OCT에서 생길 수 있는 여러 가지 오 류에 의해 임상적으로 망막두께 측정 오류가 발생하여 질 병의 진단 및 치료효과 판정에 어려움이 생길 수 있다.
최근 개발된 spectral domain (SD) OCT는 5 μm의 고해 상도와 초당 20,000 이상의 A scan 속도를 갖고 있다. SD OCT 는참조거울이 고정되어 있으며 간섭계(interferometer)에 서 나온 빛의 스펙트럼이 동시에 분광계(spectrometer)에 의해 탐지된 후 퓨리에 변환(Fourier transform)에 의해 망 막의 두께 정보를 얻게 된다. 이러한 SD OCT는 TD OCT 에 비해 스캔속도가 50배 이상 빠르고 높은 해상도를 보여 망막 내 미세 구조를 훨씬 더 자세하게 보여 준다.8,9 SD OCT가 처음 개발되었을 때에는 고해상도, 빠른 속도, 정교 한 이미지 처리 소프트웨어 등으로 인하여 오류 발생의 빈 도는 TD OCT에 비해 매우 적을 것으로 기대되었다. 그러 나 여러 연구 결과 SD OCT에서도 소프트웨어 에러(segmenta- tion software error), 검사자에 의한 에러(operator-induced acquisition error), 환자(patient motion or eccentric fix- ation)에 의해서 많은 오류가 생길 수 있다.10,11
이에 본 연구에서는 SD OCT에서 발생하는 오류의 빈도 를 알아보고 이러한 오류가 황반두께 측정에 미치는 영향 을 알아보고자 하였다. 또한 정상안과 망막질환이 있는 안 에서 오류의 빈도에 차이가 있는지를 비교 분석하였다.
A B
C
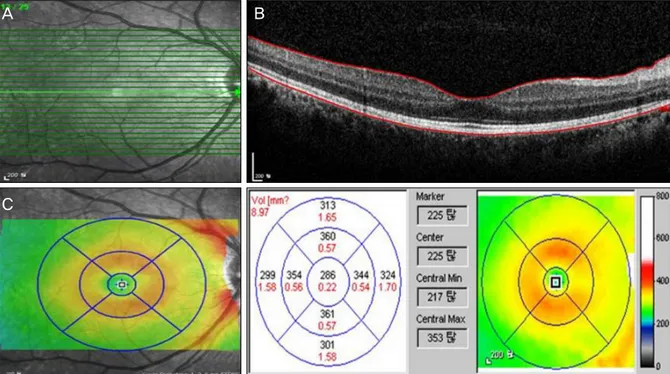
Figure 1. Example of Spectralis volume scan output display. (A) Fundus image showing scan area and individual horizontal
line scans. (B) Cross-sectional image and segmentation line of a normal eye with inner retina layer segmentation at the in- ternal limiting membrane and outer retina layer segmentation at the Bruch’s membrane. (C) False-color thickness map with overlying 1, 3, 6 mm concentric circles, corresponding thickness measurements and thickness map.대상과 방법
2008년 12월부터 2009년 11월까지 본원 안과외래를 방 문하여 SD OCT로 검사한 267명 267안을 대상으로 의무기 록과 검사기록을 후향적으로 분석하였다. 대상안들을 정상 안과 망막질환이 있는 안으로 분류하였고 망막질환에는 망 막전막, 황반원공, 당뇨황반부종, 중심장액맥락망막병증, 중 간포도막염, 건성 및 습성 나이관련황반변성이 포함되었다.
SD OCT 검사는 Spectralis HRA+OCT (Heidelberg Engineering, Dossenheim, Germany)를 사용하여 1명의 숙련된 검사자에 의해 시행되었다. High speed mode를 이 용하여 황반부 6×6 mm에 해당하는 부위를 768 픽셀로 이 루어진 25개의 B scan을 이용하여 검사하였다. Eye tracking을 하는 automatic real time (ART) 기능을 사용 하여 측정하였으며 1, 3, 6 mm 동심원을 포함하는 볼륨스 캔(volume scan)을 사용하였다(Fig. 1). 환자당 병변이 있 는 눈에서 찍은 하나의 볼륨스캔 (volume scan)을 본 연구 에 포함시켰고 이미지 질 값(image quality score)이 16 dB 미만이고 오류가 심해서 수동으로 보정할 수 없는 볼륨 스캔은 본 연구에서 제외하였다.
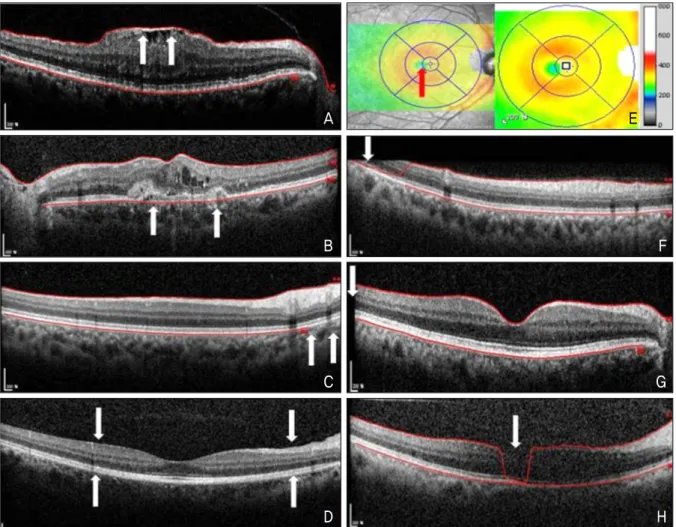
SD OCT에서 발생하는 오류는 경계 설정오류인 내망막 경계설정 오류(inner retina misidentification), 외망막 경 계설정 오류(outer retina misidentification), 불완전한 경
계설정 오류(incomplete segmentation line), 경계설정실 패 오류(no segmentation line)와 그 외에 이미지 등록 오 류(out of register), 중심부이탈 오류(off center), 부적합 영상획득 오류(degraded), 주변부 영상절단 오류(cut edge) 로 분류하였다(Fig. 2). 볼륨스캔 중 B scan에서 발생하는 오류를 전체 영역과 중심부 1 mm 영역 내에서 각각 조사하 였고 특정한 오류가 여러 개 있는 경우 하나로 계산하였으 며 다른 형태의 오류가 여러 개 있는 경우 각각을 오류에 포함시켰다. 중심부 1 mm 영역 내에 오류가 있는 스캔에 대해서는 황반중심두께(macular center thickness, MCT) 와 황반 중심 1 mm 영역내의 망막 두께 평균인 황반두께 (foveal thickness, FT)를 기록하였고 경계설정 오류의 심 한 정도에 따라 망막두께에 1/3 미만의 오류를 경증(mild), 1/3 에서 2/3는 중등도(moderate), 2/3 초과하는 오류를 중증(severe)으로 분류하였다. 또한 SD OCT에서 제공하 는 소프트웨어로 경계설정 오류가 있는 스캔을 수동으로 보정하여 MCT와 FT를 재산출하였다(Fig. 3). 임상적으로 유의한 오류는 수동으로 보정하기 전과 후에 황반두께 10% 혹은 50 μm 이상의 차이가 있거나 황반부종, 망막얇 아짐으로 오진될 수 있는 오류로 정의하였고 황반부종과 망막얇아짐의 경계수치는 각각 325 μm 이상, 255 μm 미만 으로 하였다.
볼륨스캔과 각각의 라인스캔(line scan)에서 오류 발생
A E
B F
C G
D H
Figure 2. Types of artifacts. (A) Inner retina misidentification. (B) Outer retina misidentification. (C) Incomplete segmenta-
tion line. (D) No segmentation line. (E) Off-center. (F) Out of register. (G) Cut edge. (H) Degraded.A B
Figure 3. Segmentation error correction and retinal thickness maps. (A) Line scan from a patient with age-related macular
degeneration. White arrows indicate places where automated segmentation algorithm fail to follow the retinal pigment epi- thelium (RPE) pattern created by drusen. Automated macular center thickness (red rectangle) and foveal thickness (red circle) measurements are shown. (B) Same cross-sectional image with segmentation manually adjusted to follow the RPE contour of the outer retina boundary. Note the changes in macular center thickness (red rectangle) and foveal thickness (red circle) measurements. Red arrows point to thinner retinal areas associated with drusen not seen on the uncorrected thickness map.Table 1. Frequency and percentage of volume scans and percentage of individual line scans with any artifacts for all diagnoses
Artifact All Center 1 mm
No. of scans* % scans† % lines‡ No. of scans* % scans† % lines‡
IRM 56 21.0 6.9 24 9.0 3.4
ORM 119 44.6 10.5 46 17.2 9.6
ISL 144 53.9 12.5 0 0 0
NSL 0 0 0 0 0 0
Degraded 3 1.1 0.1 1 0.4 0.1
Out of register 14 5.2 0.8 0 0 0
Cut edge 56 21.0 8.4 0 0 0
All = artifacts within entire volume scan; Center 1 mm = artifacts within center 1mm fovea; IRM = inner retina misidentification; ORM = outer retina misidentification; ISL = incomplete segmentation line; NSL = no segmentation line.
*Number of volume scans with given artifact type seen in at least 1 B-scan; †Percentage of volume scans with specific type of image artifacts;
‡Percentage of total individual line scans with specific type of image artifacts.
Table 2. Frequency of off-center artifacts by diagnosis categories
Disease category No. of scans Foveal depression* Off center† %‡
Normal 38 38 0 0
ERM 40 16 1 6.3
DME 40 12 0 0
CSC 42 15 1 6.7
Intermediate uveitis 22 16 2 12.5
MH 23 23 0 0
Dry AMD 32 23 0 0
Wet AMD 30 7 0 0
Total 267 149 4 2.7
ERM = epiretinal membrane; DME = diabetic macular edema; CSC = central serous chorioretinopathy; MH = macular hole; AMD = age-related macular degeneration.
*Number of volume scans with identifiable foveal depression on color retinal thickness map; †Number of scans with foveal depression located outside of center 1-mm area; ‡Percentage of scans with identifiable foveal depressions that were off center.
빈도를 구하고 또한 질환별, 오류 형태별로 상대적인 발생 빈도를 조사하였다. 라인스캔에서 오류의 빈도는 볼륨스캔 을 구성하는 각각 25개의 라인스캔을 하나의 스캔으로 간 주하여 계산하였다. 통계적 분석은 SPSS version 15.0 (SPSS Inc, Chicago, III)을 사용하였고 라인스캔에서 정상 안과 망막질환이 있는 안에서 오류의 발생빈도에 차이가 있는지를 알아보기 위해 chi-square analysis 통해 비교하 였다. 모든 통계적인 유의성은 p<0.05 미만으로 하였다.
결 과
전체 267명 267안의 볼륨스캔이 포함되었고 평균 나이 는 55.6 ± 8.2세였으며, 정상안 38안, 망막전막 40안, 당뇨 황반부종 40안, 중심장액맥락망막병증 42안, 중간포도막염 22안, 황반원공 23안, 건성나이관련황반변성 32안, 습성나 이관련황반변성 30안이었다. logMAR로 측정한 평균 최대 교정시력은 정상안 0.15 ± 0.14, 망막전막 0.38 ± 0.28, 당 뇨황반부종 0.42 ± 0.30, 중심장액맥락망막병증 0.39 ± 0.30, 중간포도막염 0.31 ± 0.28, 황반원공 0.52 ± 0.45, 건성나
이관련황반변성 0.28 ± 0.20, 습성나이관련황반변성 0.74
± 0.49였다.
267개의 볼륨스캔 중 전체 영역에서는 212개(79.4%)의 스캔에서, 중심부 1 mm 영역 내에서는 71개(26.6%)의 스 캔에서 적어도 하나 이상의 오류를 보였다. 볼륨스캔과 각 각의 라인스캔 전체 영역에서의 오류 중 불완전한 경계설 정 오류(볼륨스캔: 53.9%, 라인스캔: 12.5%)가 가장 많았 고 그 다음으로 외망막 경계설정 오류(볼륨스캔: 44.6%, 라인스캔: 10.5%), 주변부 영상절단 오류 (볼륨스캔: 21.0%, 라인스캔: 8.4%), 내망막 경계설정 오류(볼륨스캔: 21.0%, 라인스캔: 6.9%) 순이었다. 경계설정실패 오류는 단 하나 의 스캔에서도 관찰되지 않았다. 중심부 1 mm 영역내에서 는 외망막 경계설정 오류(볼륨스캔: 17.2%, 라인스캔:
9.6%)가 가장 흔했고 그 다음으로 내망막 경계설정 오류 (볼륨스캔: 9.0%, 라인스캔: 3.4%) 순이었다(Table 1). 중 심부이탈 오류는 중심오목(foveal depression)을 확인할 수 있는 149개의 스캔 중 4개(2.7%)에서 관찰되었고 중간 포도막염에서 12.5%로 가장 흔했다(Table 2).
질환별 오류의 빈도는 내망막 경계설정 오류의 경우 망
Table 3. Percentage of line scans with artifacts, stratified by artifact type and diagnosis categories
Artifact Normal ERM DME CSC Intermediate uveitis MH Dry AMD Wet AMD
IRM 0.8 36.1 2.9 0.4 2.4 8.2 0.1 0.3
ORM 2.6 5.7 6.1 8.4 8.7 8.2 9.0 40.0
ISL 1.6 13.2 16.2 14.2 10.7 4.4 11.4 8.3
NSL 0 0 0 0 0 0 0 0
Degraded 0.1 0.1 0 0.2 0 0 0 0
Out of register 0.7 0.7 1.5 0.4 0 0 2.0 0.3
Cut edge 4.9 5.6 12.2 6.0 5.1 5.4 13.6 14.4
ERM = epiretinal membrane; DME = diabetic macular edema; CSC = central serous chorioretinopathy; MH = macular hole; AMD = age-related macular degeneration; IRM = inner retina misidentification; ORM = outer retina misidentification; ISL = incomplete segmentation line; NSL = no segmentation line.
Table 4. Percentage of line scans in center 1mm with artifacts, stratified by artifact type and diagnosis categories
Artifact Normal ERM DME CSC Intermediate uveitis MH Dry AMD Wet AMD
IRM 0 13.0 0 0 0 18.3 0 0
ORM 1.6 1.0 1.0 8.6 0 0 12.5 55.3
ISL 0 0 0 0 0 0 0 0
NSL 0 0 0 0 0 0 0 0
Degraded 0.1 0 0 0 0 0 0 0
Out of register 0 0 0 0 0 0 0 0
Cut edge 0 0 0 0 0 0 0 0
ERM = epiretinal membrane; DME = diabetic macular edema; CSC = central serous chorioretinopathy; MH = macular hole; AMD = age-related macular degeneration; IRM = inner retina misidentification; ORM = outer retina misidentification; ISL = incomplete segmentation line; NSL = no segmentation line.
Table 5. Comparison of artifact frequency by disease category versus normal eyes
Artifact ERM DME CSC Intermediate uveitis MH Dry AMD Wet AMD
IRM <0.001 0.001 0.182 0.016 <0.001 0.037 0.123
ORM 0.001 <0.001 <0.001 <0.001 <0.001 <0.001 <0.001
ISL 0.039 0.895 0.166 0.002 <0.001 0.003 <0.001
NSL - - - -
Degraded 0.971 0.305 0.623 0.447 0.436 0.359 0.374
Out of register 0.923 0.111 0.283 0.044 0.039 0.021 0.185
Cut edge 0.584 <0.001 0.302 0.902 0.703 <0.001 <0.001
The proportion of line scans with artifacts was compared for disease category compared with normal eyes. All values shown are p-values from chi-square analysis. p<0.05 was considered significant and is shown in boldface. Dashes (-) indicate that the artifact was not observed and frequencies were not compared.
ERM = epiretinal membrane; DME = diabetic macular edema; CSC = Central serous chorioretinopathy; MH = macular hole; AMD = age- related macular degeneration; IRM = inner retina misidentification; ORM = outer retina misidentification; ISL = incomplete segmentation line; NSL = no segmentation line.
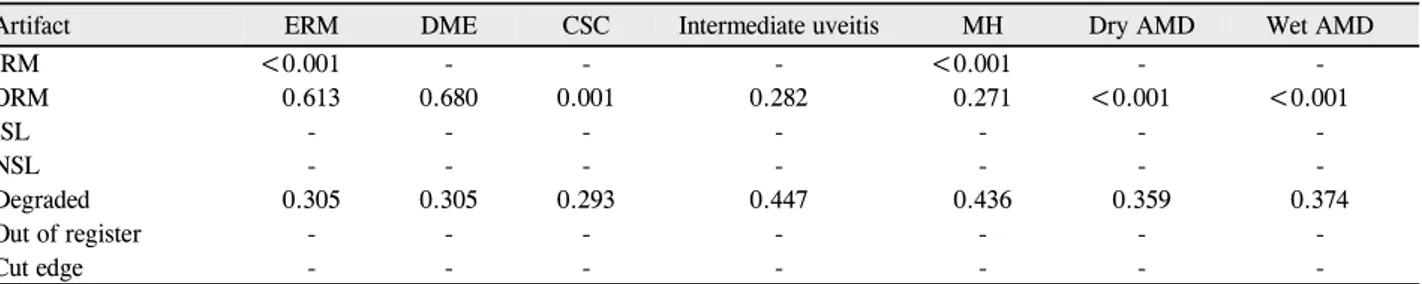
막전막에서 36.1%, 외망막 경계설정 오류의 경우 습성나이 관련황반변성에서 40%로 가장 흔했다. 중심부 1 mm 영역 내에서는 내망막 경계설정 오류의 경우 황반원공에서 18.3%, 외망막 경계 설정오류의 경우 습성나이관련황반변 성에서 55.3%로 가장 높은 빈도를 보였다(Table 3, 4). 정 상안과 망막질환이 있는 안에서 오류의 빈도를 비교했을 때 대부분의 오류에서 유의한 차이를 보였고, 이러한 차이 는 중심부 1 mm 영역 내에서는 덜 흔했다(Table 5, 6). 임 상적으로 유의한 오류는 전체 볼륨스캔 중 17개(6.4%)에 서 보였고 습성나이관련황반변성에서 43.3%로 가장 흔했
으며 수동으로 보정하기 전과 후 황반중심두께 차이의 평 균은 49.5 μm, 황반두께 차이의 평균은 54.0 μm이었다 (Table 7, 8).
고 찰
본 연구에서는 최근 널리 쓰이기 시작한 고해상도의 SD OCT에서 발생하는 오류의 빈도를 알아보고 이러한 오류가 황반두께측정에 미치는 영향을 알아 보고자 하였다. 그 결 과 대부분의 오류는 장비에 의한 소프트웨어 에러에 의해
Table 6. Comparison of artifact frequency in center 1-mm area by disease category versus normal eyes
Artifact ERM DME CSC Intermediate uveitis MH Dry AMD Wet AMD
IRM <0.001 - - - <0.001 - -
ORM 0.613 0.680 0.001 0.282 0.271 <0.001 <0.001
ISL - - - -
NSL - - - -
Degraded 0.305 0.305 0.293 0.447 0.436 0.359 0.374
Out of register - - - -
Cut edge - - - -
The proportion of line scans with artifacts was compared for disease category compared with normal eyes. All values shown are p-values from chi-square analysis. p<0.05 was considered significant and is shown in boldface. Dashes (-) indicate that the artifact was not observed and frequencies were not compared.
ERM = epiretinal membrane; DME = diabetic macular edema; CSC = Central serous chorioretinopathy; MH = macular hole; AMD = age-related macular degeneration; IRM = inner retina misidentification; ORM = outer retina misidentification; ISL = incomplete segmentation line;
NSL = no segmentation line.
Table 7. Percentage of volume scans, stratified by artifact severity and diagnosis categories
Artifact severity Normal ERM DME CSC Intermediate uveitis MH Dry AMD Wet AMD
Mild 5.3 20.0 2.5 11.9 0 8.7 12.5 23.3
Moderate 0 10.0 0 4.8 0 8.7 6.3 23.3
Severe 0 2.5 0 2.4 0 34.8 6.3 36.7
Clinically significant error 0 0 0 0 0 8.7 6.3 43.3
ERM = epiretinal membrane; DME = diabetic macular edema; CSC = Central serous chorioretinopathy; MH = macular hole; AMD = age-related macular degeneration.
Table 8. Impact of artifacts on center 1-mm thickness measurements
Artifact severity No. of scans* Average |△MCT|† Average |△FT|‡
Mild 29 5.7 4.3
Moderate 17 25.1 18.1
Severe 23 36.4 39.7
Clinically significant error 17 49.5 54.0
Thickness measurement changes after segmentation error corrections.
*No. of scans = number of volume scans per artifact severity grade; †Average of the absolute value of differences between automated and corrected manual macular center thickness measurements (micrometers); ‡Average of the absolute value of differences between automated and corrected foveal thickness (micrometers).
주로 발생하였고 그중에서 망막 경계설정 오류가 가장 흔 했다. 정상안과 비교했을 때 특정 망막질환이 있는 안에서 특정한 형태의 오류 빈도가 높았으며, 중심부 1 mm 영역 내에서 보이는 오류의 빈도는 상대적으로 낮았지만 오류의 심한 정도에 따라 황반두께 측정치에 영향을 주었다.
Ray et al4은 TD OCT인 Stratus OCT를 이용한 망막두 께지도(retinal thickness map)에서 중심오목이 보이지 않 거나 중심부 이탈이 보이는 경우에 6 radial scan의 이미지 를 분석하여 약 43.2%의 오류 발생률을 보고하였다. Sadda et al5은 역시 Stratus OCT를 이용하여 망막두께지도와 관 계없이 6 radial line이나 fast macular thickness 프로토콜 로 촬영한 모든 이미지의 오류를 분석하여 약 92%에서 하 나 이상의 오류가 발생했다고 보고하였다. 최근에 Ho et al10이 세 종류의 SD OCT (Cirrus HD-OCT, RTVue-100, Topcon 3D-OCT 1000)와 Stratus OCT를 사용한 연구에
서는 Stratus OCT에서 73.8%의 오류가 발생하였고 Cirrus HD-OCT에서는 68.5%로 오류 발생 빈도가 가장 낮았다 고 하였다. Han and Jaffe11는 두 개의 SD OCT (Cirrus HD OCT, Spetralis HRA+OCT)를 사용하여 SD OCT에서 발 생하는 오류의 종류와 빈도를 조사하였는데 그 결과 Cirrus HD OCT에서는 전체 볼륨스캔 중 84.7%, Spectralis HRA+OCT에서는 90.9%에서 적어도 하나 이상의 오류가 있었고 중심부 1 mm 영역 내에서는 각각 32.7%, 37.5%에 서 오류가 있었다고 보고하였다. 본 연구에서는 전체 볼륨 스캔 중 79.4%에서, 중심부 1 mm 영역 내에서는 26.6%에 서 적어도 하나 이상의 오류를 보여 Han and Jaffe11의 연 구와 비교했을 때 조금 낮은 오류 발생빈도를 보였지만 TD OCT에 비해 훨씬 빠른 속도와 높은 해상도를 갖고 있는 SD OCT에서도 오류 발생빈도가 높음을 알 수 있었다. 이 전의 여러 연구와 본 연구 결과를 종합해 보면 OCT의 종류
나 분석 방법, 분석에 포함된 망막질환에 따라 오류 발생빈 도에 차이가 있었고 SD OCT에서는 TD OCT에 비해 높은 해상도와 빠른 속도, 정교해진 내장 소프트웨어를 바탕으로 TD OCT보다 전반적인 오류 발생 빈도가 감소하긴 하였으 나 여전히 높은 빈도로 오류가 발생한다는 것을 알 수 있다.
중심부이탈 오류(off center)는 중심오목을 확인할 수 있 는 스캔 중 2.7%에서 관찰되었고 중간포도막염에서 12.5%
로 가장 높은 빈도를 보였다. 그 이유로는 중간포도막염에 서는 매체 혼탁에 의해서 검사자가 황반 중심부를 정확히 확인할 수 없기 때문이었을 것으로 생각된다. Han and Jaffe11 의 연구에서는 Cirrus HD-OCT에서 7.4%, SpectralisHRA+
OCT에서 11.8%의 중심부 이탈 오류를 보고하여 본 연구 에서보다 더 높은 발생빈도를 보였다. 중심부이탈 오류를 없애는 것은 정확한 망막두께를 측정하는 데 필수적인 요 소이므로 중심부이탈 오류를 보이는 스캔에 대해서는 반복 적인 검사가 필요하고 그 외에 검사자나 환자에 의해서 발 생하는 오류인 이미지 등록 오류(out of register), 주변부 영상절단 오류(cut edge)도 반복적인 검사로 오류 발생빈도 를 최소화할 수 있다. 부적합 영상획득 오류(degraded)는전 체 볼륨스캔 중 3개(볼륨스캔: 1.1%, 라인스캔: 0.1%)에서 관찰되어 발생빈도가 매우 낮았으며 정상안과 망막질환이 있는 안에서 발생빈도를 비교했을 때 통계적으로 유의한 차이를 보이지 않았다. 이는 망막질환 종류보다 매체 혼탁 여부가 OCT 이미지 질을 좌우하기 때문이며 실제로 검사 시 심한 백내장이나 유리체혼탁이 있는 환자들의 경우 이 미지 판독이 어려운 경우가 많았다.12,13
망막 경계 설정오류는 OCT의 소프트웨어 에러에 의해서 발생하는 것으로 본 연구에서 가장 흔히 관찰되었다. 그중 불완전한 경계설정 오류(incomplete segmentation line)가 가장 흔했고 내망막 경계보다 외망막 경계에서 더 흔하게 발생하였다. 이러한 오류는 외망막의 병변, 망막혈관의 그 림자 등으로 인해서 혹은 명확한 원인 없이 경계 라인이 끊 어지는 것으로 주로 스캔의 주변부에서 발생하기 때문에 망막두께측정에는 거의 영향을 주지 않을 것으로 생각한다.
Han and Jaffe11의 연구에서는 경계설정실패 오류(no segmentation line)가 드물게 발생하였으나 본 연구에서는 단 하나의 스캔에서도 발생하지 않았다. 내망막 경계설정 오류(inner retina misidentification)와 외망막 경계설정 오 류(outer retina misidentification)는 각각 망막전막, 황반 원공 및 나이관련황반변성에서 가장 흔했는데 이러한 결과 는 내망막과 외망막 경계에 병변이 있는 경우 OCT가 정확 하게 인지하지 못하여 망막 경계 설정 오류가 발생한 것으 로 생각된다. 따라서 망막전막, 황반원공 및 나이관련황반 변성 환자의 OCT 결과를 판독할 때는 이러한 망막 경계설
정 오류가 흔히 발생할 수 있다는 것을 유념할 필요가 있다.
SD OCT에서 발생하는 오류가 황반두께측정에 미치는 영향을 알아보기 위해 중심부 1 mm 영역 내에서 발생하는 오류를 따로 분석하였다. 오류의 심한 정도에 따라 분류하 였으며 수동으로 보정하여 황반중심두께와 황반두께를 재 산출하였고, 수동으로 보정하기 전과 후에 황반두께 10%
혹은 50 μm 이상의 차이가 있거나 황반부종 혹은 망막얇아 짐으로 오진될 수 있는 경우에는 임상적으로 유의한 오류 로 정의하였다. 황반두께의 10% 이상의 변화는 이전에 TD OCT 연구에서 보인 변동성(scan variability)을 상회하는 수치로 TD OCT보다 재현성(reproducibility)이 향상된 SD OCT에서 이러한 차이는 임상적으로 유의하다.14-18 두 번 째 기준인 황반두께 50 μm이상의 변화는 이전 연구에서 습 성 나이관련황반변성의 재치료 기준이 되었던 경계수치로 이 또한 임상적으로 유의하다고 할 수 있다.19 마지막으로 황반부종은 325 μm 이상, 망막얇아짐은 255 μm 미만을 경 계수치로 하였고 이는 이전에 Spectralis OCT 연구 결과를 바탕으로 정하였다.17본 연구에서 임상적으로 유의한 오류 는 전체 볼륨스캔 중 17개(6.4%)의 스캔에서 관찰되었는 데 황반원공 2개(8.7%), 건성 나이관련황반변성 2개 (6.3%), 습성 나이관련황반변성 13개(43.3%)였다. 이러 한 결과는 Han and Jaffe11의 연구에서 임상적으로 유의한 오류가 Cirrus HD-OCT에서 5.1%, Spectralis HRA+OCT 에서 8.0%인 것과 유사하였다. 임상적으로 유의한 오류를 수동으로 보정한 결과 황반중심두께 차이의 평균은 49.5 μ m, 황반두께 차이의 평균은 54.0 μm이었다. 이러한 오류는 정확한 황반두께 측정을 방해하는 요인이며 환자의 치료와 경과관찰에 혼란을 줄 수 있을 뿐만 아니라 OCT를 사용하 는 임상연구의 결과에도 영향을 줄 수 있기 때문에 OCT를 해석할 때 이런 오류의 가능성을 항상 염두에 두어야 하겠다.
결론적으로 본 연구에서는 SD OCT가 TD OCT에 비해 다양한 장점을 지니고 있지만 여전히 기계가 만드는 오류 가 흔하게 나타나고 있음을 알 수 있었다. 이러한 오류를 줄이기 위해서는 검사자에 의한 정확한 검사가 필수적이며, 향후 새로운 SD OCT 장비의 개발로 경계설정 소프트웨어 가 향상되면 이러한 오류의 발생이 많이 줄어들 것으로 기 대된다. 또한 SD OCT를 사용하여 망막두께를 평가할 때 특히 중심부 1 mm 영역내에서 보이는 임상적으로 유의한 오류가 있는지 반드시 확인하여 질병의 진단 및 치료경과 등을 판단해야 한다.
참고문헌
1) Leung CK, Chan WM, Chong KK, et al. Alignment artifacts in op-
tical coherence tomography analyzed images. Ophthalmology 2007;114:263-70.
2) Patel PJ, Chen FK, da Cruz L, Tufail A. Segmentation error in Stratus optical coherence tomography for neovascular age-related macular degeneration. Invest Ophthalmol Vis Sci 2009;50:399-404.
3) Ghazi NG, Kirk T, Allam S, Yan G. Quantification of error in opti- cal coherence tomography central macular thickness measurement in wet age-related macular degeneration. Am J Ophthalmol 2009;
148:90-6.
4) Ray R, Stinnett SS, Jaffe GJ. Evaluation of image artifact produced by optical coherence tomography of retinal pathology. Am J Ophthalmol 2005;139:18-29.
5) Sadda SR, Wu Z, Walsh AC, et al. Errors in retinal thickness meas- urements obtained by optical coherence tomography. Ophthalmology 2006;113:285-93.
6) Sadda SR, Joeres S, Wu Z, et al. Error correction and quantitative subanalysis of optical coherence tomography data using computer- assisted grading. Invest Ophthalmol Vis Sci 2007;48:839-48.
7) Domalpally A, Danis RP, Zhang B, et al. Quality issues in inter- pretation of optical coherence tomograms in macular diseases.
Retina 2009;29:775-81.
8) Hangai M, Ojima Y, Gotoh N, et al. Three-dimensional imaging of macular holes with high-speed optical coherence tomography.
Ophthalmology 2007;114:763-73.
9) Ahlers C, Michels S, Beckendorf A, et al. Three-dimensional imaging of pigment epithelial detachment in age-related macular degeneration using optical coherence tomography, retinal thick- ness analysis and topographic angiography. Graefes Arch Clin Exp Ophthalmol 2006;244:1233-9.
10) Ho J, Sull AC, Vuong LN, et al. Assessment of artifacts and re- producibility across spectral- and time-domain optical coherence tomography devices. Ophthalmology 2009;116:1960-70.
11) Han IC, Jaffe GJ. Evaluation of artifacts associated with macular
spectral-domain optical coherence tomography. Ophthalmology 2010;117:1177-89.
12) Tappeiner C, Barthelmes D, Abegg MH, et al. Impact of optic me- dia opacities and image compression on quantitative analysis of optical coherence tomography. Invest Ophthalmol Vis Sci 2008;
49:1609-14.
13) Kok PH, van Dijk HW, van den Berg TJ, Verbraak FD. A model for the effect of disturbances in the optical media on the OCT image quality. Invest Ophthalmol Vis Sci 2009;50:787-92.
14) Diabetic Retinopathy Clinical Research Network. Reproducibility of macular thickness and volume using Zeiss optical coherence to- mography in patients with diabetic macular edema. Ophthalmology 2007;114:1520-5.
15) Browning DJ, Fraser CM, Propst BW. The variation in optical co- herence tomography-measured macular thickness in diabetic eyes without clinical macular edema. Am J Ophthalmol 2008;145:
889-93.
16) Forooghian F, Cukras C, Meyerle CB, et al. Evaluation of time do- main and spectral domain optical coherence tomography in the measurement of diabetic macular edema. Invest Ophthalmol Vis Sci 2008;49:4290-6.
17) Wolf-Schnurrbusch UE, Ceklic L, Brinkmann CK, et al. Macular thickness measurements in healthy eyes using six different optical coherence tomography instruments. Invest Ophthalmol Vis Sci 2009;50:3432-7.
18) Leung CK, Cheung CY, Weinreb RN, et al. Comparison of macular thickness measurements between time domain and spectral do- main optical coherence tomography. Invest Ophthalmol Vis Sci 2008;49:4893-7.
19) Patel PJ, Chen FK, Ikeji F, et al. Repeatability of stratus optical co- herence tomography measures in neovascular age-related macular degeneration. Invest Ophthalmol Vis Sci 2008;49:1084-8.
=ABSTRACT=
Artifacts Associated with Spectral-Domain Optical Coherence Tomography
Hyung Jun Kim, MD, Hyewon Chung, MD, PhD, Hyung Chan Kim, MD, PhD
Department of Ophthalmology, Konkuk University Medical Center, Konkuk University School of Medicine, Seoul, Korea
Purpose: To report frequencies of image artifacts associated with spectral-domain optical coherence tomography (SD-OCT) and to evaluate the impact of artifacts on foveal thickness measurements.
Methods: This retrospective study included 267 eyes of 267 patients who underwent OCT volume scanning using Spectralis HRA+OCT (Heidelberg Engineering, Heidelberg, Germany). Macular volume scans of normal and diseased eyes were systematically evaluated for image artifacts within each scan overall and within the center 1-mm area. The fre- quency of each artifact type was compared for scans stratified by diagnosis category.
Results: Among the volume scans, 79.4% had at least 1 artifact overall, and 26.6% had at least 1 artifact in the center 1-mm area. The highest percentage of inner retina misidentification occurred in the epiretinal membrane (36.1%), whereas the highest percentage of outer retina misidentification occurred in neovascular age-related macular degeneration (wet AMD, 40.0%). Clinically significant artifacts involving the center 1-mm area were observed in 6.4% of volume scans and were most common in wet AMD (43.3%).
Conclusions: Image artifacts in SD-OCT volume scanning are common, but relatively less common in the center 1-mm area of scans. Clinicians should carefully review scans for artifacts when using SD-OCT images and retinal thickness measurements because clinically significant artifacts may affect retinal thickness measurements.
J Korean Ophthalmol Soc 2011;52(8):943-951
Key Words: Artifact, Spectral domain optical coherence tomography
Address reprint requests to Hyung Chan Kim, MD, PhD
Department of Ophthalmology, Konkuk University Medical Center
#4-12 Hwayang-dong, Gwangjin-gu, Seoul 143-729, Korea
Tel: 82-2-2030-8180, Fax: 82-2-2030-5273, E-mail: [email protected]