https://doi.org/10.14734/PN.2019.30.4.187 pISSN 2508-4887•eISSN 2508-4895
Seung Woo Yang, MD, PhD1,*, Su Hyun Chae, MD1,*, So Ra Kim, MD1, Young Hee Hong, MD1, Meari Dong, MD1, Hee Sun Kim, MD, PhD2, Han-Sung Kwon, MD, PhD1, In-Sook Sohn, MD, PhD1, Han-Sung Hwang, MD, PhD1
1Division of Maternal and Fetal Medicine, Department of Obstetrics and Gynecology, Research Institute of Medical Science, Konkuk University School of Medicine, Seoul;
2Department of Obstetrics and Gynecology, Ilsan Paik Hospital, Inje University College of Medicine, Goyang, Korea
Objective: In Korean population, information is lacking regarding fetal subcutaneous tissue thickness (SCTT) detected during pregnancy in the normal maternal condition. Thus, the aim of this study is to evaluate SCTT in the basic fetal biometry measurement plane, and to identify the clinical significance of SCTT in estimating fetal weight.
Methods: In this retrospective observational study, 856 term pregnant women were recruited bet
ween 1st January 2013 and 31st December 2015. Estimated fetal weight (EFW) and fetal SCTT were measured routine ultrasonography within one week before delivery. The women were divided in two groups: SCTT group (n=46) and nonSCTT group (n=810). Pregnancy outcomes including birth weight (BW) and EFW were compared between the two groups.
Results: The incidence of SCTT was 5.4% and no significant differences in parity, maternal age, maternal prepregnancy body mass index or gestational age at delivery were found between the groups. EFW, BW, amniotic fluid index, and cesarean section rate were higher in the SCTT group than in the nonSCTT group. The difference between EFW and BW was only significant in the SCTT group.
Moreover, SCTT and EFW were positively correlated with BW (SCTT group: EFW 3,460±472 g vs. BW 3,779±496 g, P=0.013; nonSCTT group: EFW 3,011±436 g vs. BW 3,090±468 g, P=0.324).
Conclusion: Fetal SCTT detected during routine biometric ultrasonography evaluation in the third trimester of pregnancy could suggest larger BW than EFW. Therefore, physicians should pay careful attention in such cases during assessments for delivery.
Key Words: Birth weight, Fetal weight, Subcutaneous tissue, Pregnancy trimester, third, Ultrasono
graphy
Introduction
Ultrasonography is widely used for the prenatal evaluation of fetal weight, achieved through various morphometric formulae. Most of these formulae combine basic biometric parameters such as biparietal diameter (BPD), head circumference (HC), abdominal circumference (AC) and femur length (FL).1 The Hadlock and Shepard methods are the most commonly used, with a limitation of 62% sensitivity and 93% specificity for the Hadlock method for the prediction of fetal macrosomia, and a 21% sensitivity and 99% specificity for the Shepard method.2 Consequently, other sonographic parameters with higher predictive values for fetal weight are required. Formulae using fetal parameters such as liver dimension, cerebellar diameter, kidney length, upper arm soft tissue thickness, femur volume, and cheek-to-cheek diameter have been developed but are not always accurate.2-5
*These authors contributed equally to this work.
Received: 19 February 2019 Revised: 13 April 2019 Accepted: 10 June 2019 Correspondence to HanSung Hwang, MD, PhD Division of Maternal and Fetal Medicine, Department of Obstetrics and Gynecology, Research Institute of Medical Science, Konkuk University School of Medicine, 120 Neungdong
ro, Gwangjingu, Seoul 05029, Korea Tel: +82220307747
Fax: +82220307748 E-mail: [email protected] Copyright© 2019 by The Korean Society of Perinatology
This is an Open Access article distributed under the terms of the Creative Com
mons Attribution NonCommercial License (http://creativecommons.org/
license/bync/4.0/), which permits
Clinical Significance of Fetal Subcutaneous
Thickness via Ultrasonography Biometry in
the Third Trimester for Estimating Fetal Birth
Weight
account for 46% of the variance noted in neonatal weight.6 Some previous studies assessed the relationship between ultrasono- graphy fat mass and neonatal BW.7-9 These ultrasonography- derived anthropometric evaluations of fetal body fat composition showed significant correlations with BW and estimated fetal weight (EFW).
Fetal subcutaneous tissue thickness (SCTT) observed on ul- trasonography examination in the second or third trimester has not been clarified, although it is an indicator of poor perinatal and neonatal outcomes. Moreover, there is a lack of information on SCTT detected during pregnancy in the normal maternal con- dition. Some studies focused on SCTT measurement for asses- sing BW;10,11 however, in these studies, specific areas such as mid-arm, mid-thigh, or subscapular fat mass were measured.
Thus, we evaluated BW considering SCTT in Hadlock biometry method which are using in widely.
Therefore, in this study, we measured the third trimester SCTT on routine ultrasonography fetal biometry during normal pregnancy. We compare the perinatal and neonatal outcomes of fetuses and the differences between BW and EFW in fetuses with or without SCTT.
Methods
1. Patients
This was a retrospective observational study that enrolled pregnant women with fetuses of gestational ages between 37+0 and 41+6 weeks. Gestational age was determined based on the last menstrual period and confirmed via an early ultrasonography scan in all cases. The women visited the outpatient obstetrics ultrasonography clinic of Konkuk University Medical Center bet- ween 1st January 2013 and 31st December 2015. The inclusion criteria were a healthy singleton pregnancy, the absence of fetal anomalies, and the absence of abnormalities during deli- very. The exclusion criteria were preterm delivery, multiple pregnancies, preeclampsia, maternal diabetes mellitus, maternal gestational diabetes mellitus, maternal chronic hypertension, fetal growth restriction, and fetal anomalies. In total, 856 women were recruited and divided in two groups as follows: SCTT group (n=46) and non-SCTT group (n=810).
2. Ultrasonography scans
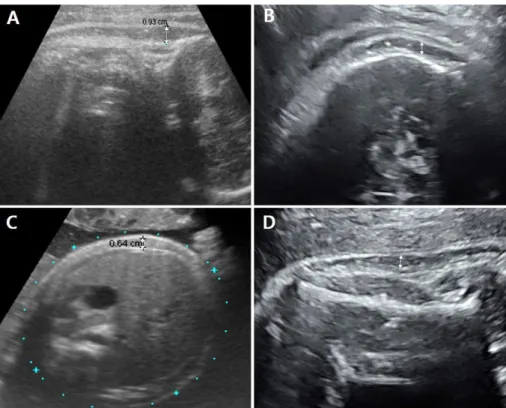
Data from routine ultrasonography examinations performed the week before delivery were reviewed and compared. Ultraso- nography biometric parameters were measured, including BPD, HC, AC, FL, and humerus length (HL) to calculate EFW. Additio- nally, SCTT was defined as the thickest inner-to-inner distance of sonolucent areas under the skin level in the routine biometric parameters of fetal BPD, HC, AC, FL and HL during ultrasono- graphy measurement. All measured values were averaged with respect to each individual. If SCTT was observed in two or more sites during measurement, the average SCTT was calculated (Fig. 1). Positive SCTT group was defined as prominent SCTT measurement group. Negative SCTT group was defined as non measureable SCTT group due to abscent or minimal to visualiza- tion. This study was approved by the Institutional Review Board of Konkuk University Hospital (project number: KUH1040062).
3. Statistical analysis
Differences in clinical characteristics and neonatal outcomes were analyzed using the Chi-squared test and Mann-Whitney U test. To compare differences between BW and EFW, the Wilco- xon signed-rank test and paired t-test were used. To assess the relationship among BW, SCTT, and EFW, Spearman’s cor- relation was used, and linear regression was used for the equa- tion model of BW. The data analysis was performed using the Statistical Package for Social Sciences for Windows, version 18.0 (SPSS Inc., Chicago, IL, USA). A P-value of <0.05 was con- sidered statistically significant.
Results
The incidence of SCTT was 5.4% and the averaged SCTT ranged from 2.6 to 13.4 mm. The clinical characteristics of both groups before delivery are summarized in Table 1. EFW deter- mined by ultrasonography, amniotic fluid index, and cesarean section rate was higher in the SCTT group than in the non- SCTT group. No significant differences in parity, maternal age, maternal pre-pregnancy body mass index, maternal glucose levels, or gestational age at delivery were found between the groups. Uterine artery Doppler ultrasonography and fetal middle cerebral artery Doppler ultrasonography showed no abnormal
unit admission rate, meconium staining, or neonatal hemoglobin levels between the groups. However, neonatal BW was signifi- cantly higher in the SCTT group than in the non-SCTT group (3,714 vs. 3,140 g, P<0.001). Differences between the mean EFW determined by ultrasonography and BW were statistically noted in the SCTT group but not in the non-SCTT group (SCTT group:
EFW 3,460±472 g, BW 3,779±496 g, P=0.013; non-SCTT findings in either group. The postpartum outcomes of the SCTT
and non-SCTT groups are summarized in Table 2. No significant differences were found in Apgar score, neonatal intensive care
Fig. 1. Subcutaneous tissue thickness detected by ultrasonography in various planes (A, C: 37+2 weeks, male; B, D: 39+4 weeks, female). (A) Fetal ultrasonography image in the sagittal view at the posterior neck level, 9.3 mm. (B) Fetal ultrasonography image recorded in the plane used to determine humerus length, 3.2 mm. (C) Transverse view of the abdominal circumference, 6.4 mm. (D) Fetal ultrasonography image recorded in the plane used to determine head circumference, 3.6 mm.
Table 1. Clinical Characteristics of the SCTT and non-SCTT Groups before Delivery
Characteristics SCTT (n=46) Non-SCTT (n=810) P-value Maternal age (years) 33 (2342) 32 (2343) 0.657*
Parity 1 (02) 1 (02) 0.215*
BMI (kg/m2) 23 (1840) 22 (1641) 0.121*
Gestational age at delivery (weeks)
39 (3741) 39 (3741) 0.994*
Glucose (mg/dL) 92 (62217) 89 (58150) 0.114*
EFW (g) 3,543 (2,3384,857) 3,005 (2,2773,843) <0.001* AFI (cm) 14.8 (6.526.7) 12.5 (6.020.9) <0.002*
Cesarean section 27 (58.7) 352 (43.5) 0.015†
Values are presented as median (range) or number (%). A Pvalue of <0.05 was considered significant. Glucose level estimated at 3637 gestational weeks.
Abbreviations: SCTT, subcutaneous tissue thickness; BMI, body mass index; EFW, estimated fetal weight; AFI, amniotic fluid index.
*MannWhitney U test.
†Chisquared test.
Table 2. Postpartum Outcomes in the SCTT Group and Non-SCTT Group Outcomes SCTT (n=46) Non-SCTT (n=810) P-value Birth weight (g) 3,717 (2,4805,265) 3,140 (2,4254,100) <0.001
1minute Apgar score 8 (39) 8 (49) 0.217
5minute Apgar score 9 (410) 9 (610) 0.458
NICU admission 3 (6.5) 25 (3.1) 0.124
Meconium staining 1 (2.2) 42 (5.2) 0.398
Neonatal hemoglobin 14.6 (12.516.2) 15.0 (13.516.0) 0.568 Values are presented as median (range) or number (%). A Pvalue of <0.05 was considered significant using MannWhitney U test or Chisquared test.
Abbreviations: SCTT, subcutaneous tissue thickness; NICU, neonatal intensive care unit.
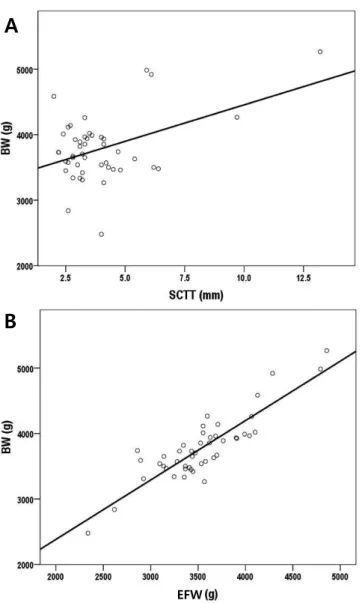
group; EFW 3,011±436 g, BW 3,090±468 g, P=0.324) (Table 3). Moreover, in the SCTT group, positive correlations were noted between BW and EFW or SCTT (EFW: r=0.443, P<0.001;
SCTT: r=0.443, P<0.001) (Fig. 2). The regression model equation was as follows: BW=623.8+0.855*EFW+33.0*SCTT (adjusted R2=0.770, F=76.3, P<0.001) (Table 4).
Discussion
Various ultrasonography formulae have been used to estimate fetal weight. EFW is generally calculated using the Hadlock for- mula, which involves ultrasonography parameters such as BPD, HC, AC, and FL.12 However, EFW and especially AC show a wide error range (±10%), which may affect clinical evaluation.11,13,14 This error may have several contributing factors. For one, fat constitutes 12 to 14% of BW,15 and fetal fat tissue is detected on ultrasonography as SCTT, seen as hypoechoic lesions under the skin, similar to fetal SCTT. Therefore, estimating the amount of subcutaneous fat tissue via ultrasonography may be useful for detecting fetal growth abnormalities.
Several studies suggest that various ultrasonography para- meters related to soft tissue thickness are useful for fetal weight estimation.2,4,5,16,17 Forouzmehr et al.16 showed that a strong posi- tive correlation exists between fetal abdominal soft tissue thick- ness in the third trimester and fetal weight. Chen et al.17 demon- strated that soft tissue thickness at the fetus’s abdomen and subscapular area is strongly correlated with fetal age. In the case of SCTT, Larciprete et al.10,11 suggested that mid-arm, mid-thigh, abdominal, and subscapular SCTT were gestational age-specific EFW
A
B
Fig. 2. Correlation between BW and EFW or SCTT. The correlation co- efficient in each graph was (A) r=0.446, P=0.002 (B) r=0.875, P<0.001 by Spearman’s rank correlation test. BW, birth weight; EFW, estimated fetal weight; SCTT, subcutaneous tissue thickness.
Table 3. Comparison of EFW by Ultrasonography with BW in Each Group
Group EFW (g) BW (g) P-value
SCTT (n=46) 3,460±472 3,779±496 0.013*
NonSCTT (n=810) 3,011±436 3,090±468 0.324†
Values are presented as mean±standard deviation. A Pvalue of <0.05 was considered significant.
Abbreviations: EFW, estimated fetal weight; BW, birth weight; SCTT, subcutaneous tissue thickness.
*Wilcoxon signedrank test.
†Paired ttest.
Table 4. Relationship between BW, SCTT, and EFW by Linear Regression Analysis for BW Estimation
Variable B SE Beta t-value P-value
Constant 623.8 266.6 2.34 0.024
SCTT 33.0 19.3 0.132 1.711 0.044
EFW 0.855 0.080 0.825 10.667 <0.001
R Adjusted R2 F P-value
Model summary 0.883 0.770 76.3 <0.001
Regression equation BW=623.8+0.855*EFW+33.0*SCTT A Pvalue of <0.05 was considered significant.
Abbreviations: BW, birth weight; SCTT, subcutaneous tissue thickness; EFW, esti
mated fetal weight.
reference values for fetal weight. Based on these studies, several EFW calculation formulae have been suggested.18-20 However, these formulae have a large risk of error because identifying the correct ultrasonography plane is difficult with these techniques, and the observations may vary with physician ability. Therefore, we suggest that the ultrasonographic plane routinely used to determine BPD, HC, AC, FL, and HL be used to examine SCTT thickness in the third trimester.
In this study, the SCTT group showed an increased EFW and amniotic fluid index compared to the non-SCTT group. BW were more increased in the SCTT group than in the non-SCTT group.
Because of the increased BW, the cesarean section rate was also increased in the SCTT group. Most of the cesarean sections were due to cephalopelvic disproportion. The difference bet- ween EFW and BW was significant only in the SCTT group.
Additionally, since SCTT and EFW were significantly correlated with BW, an estimated equation for BW using EFW and SCTT was feasible. Therefore, appropriate care should be exercised if fetal SCTT is detected in third trimester biometry. Based on our result, this finding could be a sign that the weight of the fetus at delivery may be higher than that expected based on EFW.
This study was limited by its retrospective design and small size.
Thus, analysis based on maternal characteristics including parity and indication of cesarean section will be necessary. Although, there was no difference in neonatal outcomes between the two groups in this study, a future large scale study could estimate adverse neonatal outcomes following the increased incidence of cephalopelvic disproportion and macrosomia. However, this study suggests a definition of SCTT based on the more popular fetal biometric evaluation of the Hadlock formula as against other formulae including specific measures such as mid-arm, mid-thigh or subscapular fat mass. For further study, we have designed a prospective longitudinal study of SCTT from its initial appearance and will suggest cut-off values for macrosomia. Adipose tissues are accumulated in the fetal subcutaneous area21 and some studies have indicated an association between maternal gestational diabetes mellitus or diabetes mellitus and fetal SCTT.22,23 Thus, application with respect to maternal gestational diabetes mellitus or diabetes mellitus in pregnancy would be necessary.
In conclusion, fetal SCTT detected during routine biometric ultrasonography evaluation in the third trimester of pregnancy could suggest larger BW than EFW. Therefore, physicians should
pay careful attention in such cases during assessments for delivery.
Acknowledgement
This research was supported by the Basic Science Research Program through the National Research Foundation of Korea (NRF) funded by the Ministry of Science, ICT & Future Planning (NRF-2017R1C1B2010487).
This research was supported by a grant of the Korea Health Technology R&D Project through the Korea Health Industry Development Institute (KHIDI), funded by the Ministry of Health
& Welfare, Republic of Korea (grant number: HI17C1713).
References
1) Warska A, Maliszewska A, Wnuk A, Szyszka B, Sawicki W, Cendrowski K.
Current knowledge on the use of ultrasound measurements of fetal soft tissues for the assessment of pregnancy development. J Ultrason 2018;18:50-5.
2) Rotmensch S, Celentano C, Liberati M, Malinger G, Sadan O, Bellati U, et al. Screening efficacy of the subcutaneous tissue width/femur length ratio for fetal macrosomia in the non-diabetic pregnancy. Ultrasound Obstet Gynecol 1999;13:340-4.
3) Chauhan SP, West DJ, Scardo JA, Boyd JM, Joiner J, Hendrix NW. Ante- partum detection of macrosomic fetus: clinical versus sonographic, in- cluding soft-tissue measurements. Obstet Gynecol 2000;95:639-42.
4) Luo H, Zhou S, Yang T, Liu S, Xu H. Ultrasonic multiple measurement esti- mation of fetal weight in parturient. Hua Xi Yi Ke Da Xue Xue Bao 2001;
32:618-20.
5) Lee W, Balasubramaniam M, Deter RL, Yeo L, Hassan SS, Gotsch F, et al.
New fetal weight estimation models using fractional limb volume. Ultra- sound Obstet Gynecol 2009;34:556-65.
6) Catalano PM, Tyzbir ED, Allen SR, McBean JH, McAuliffe TL. Evaluation of fetal growth by estimation of neonatal body composition. Obstet Gy- necol 1992;79:46-50.
7) Galan HL, Rigano S, Radaelli T, Cetin I, Bozzo M, Chyu J, et al. Reduction of subcutaneous mass, but not lean mass, in normal fetuses in Denver, Colorado. Am J Obstet Gynecol 2001;185:839-44.
8) Bernstein IM, Goran MI, Amini SB, Catalano PM. Differential growth of fetal tissues during the second half of pregnancy. Am J Obstet Gynecol 1997;176:28-32.
9) Maruotti GM, Saccone G, Martinelli P. Third trimester ultrasound soft- tissue measurements accurately predicts macrosomia. J Matern Fetal Neonatal Med 2017;30:972-6.
10) Larciprete G, Valensise H, Vasapollo B, Novelli GP, Parretti E, Altomare F, et
al. Fetal subcutaneous tissue thickness (SCTT) in healthy and gestational diabetic pregnancies. Ultrasound Obstet Gynecol 2003;22:591-7.
11) Larciprete G, Valensise H, Barbati G, Di Pierro G, Jarvis S, Deaibess T, et al.
Ultrasound-determined fetal subcutaneous tissue thickness for a birth- weight prediction model. J Obstet Gynaecol Res 2007;33:635-40.
12) Hadlock FP, Deter RL, Harrist RB, Park SK. Estimating fetal age: computer- assisted analysis of multiple fetal growth parameters. Radiology 1984;
152:497-501.
13) Chang TC, Robson SC, Boys RJ, Spencer JA. Prediction of the small for gestational age infant: which ultrasonic measurement is best? Obstet Gynecol 1992;80:1030-8.
14) Skovron ML, Berkowitz GS, Lapinski RH, Kim JM, Chitkara U. Evaluation of early third-trimester ultrasound screening for intrauterine growth retardation. J Ultrasound Med 1991;10:153-9.
15) Spady DW, Atrens MA, Szymanski WA. Effects of mother's smoking on their infants' body composition as determined by total body potassium.
Pediatr Res 1986;20:716-9.
16) Forouzmehr A, Shahrokh A, Moulaei M. Estimation of birth weight using sonographically measured fetal abdominal subcutaneous tissue thick- ness. Iran J Radiol 2004;2:48-9.
17) Chen L, Wu JJ, Chen XH, Cao L, Wu Y, Zhu LJ, et al. Measurement of fetal abdominal and subscapular subcutaneous tissue thickness during preg-
nancy to predict macrosomia: a pilot study. PLoS One 2014;9:e93077.
18) Abuelghar W, Khairy A, El Bishry G, Ellaithy M, Abd-Elhamid T. Fetal mid- thigh soft-tissue thickness: a novel method for fetal weight estimation.
Arch Gynecol Obstet 2014;290:1101-8.
19) Scioscia M, Scioscia F, Vimercati A, Caradonna F, Nardelli C, Pinto LR, et al. Estimation of fetal weight by measurement of fetal thigh soft-tissue thickness in the late third trimester. Ultrasound Obstet Gynecol 2008;
31:314-20.
20) Kalantari M, Negahdari A, Roknsharifi S, Qorbani M. A new formula for estimating fetal weight: the impression of biparietal diameter, abdo- minal circumference, mid-thigh soft tissue thickness and femoral length on birth weight. Iran J Reprod Med 2013;11:933-8.
21) Catalano PM, Thomas A, Huston-Presley L, Amini SB. Increased fetal adi- posity: a very sensitive marker of abnormal in utero development. Am J Obstet Gynecol 2003;189:1698-704.
22) Araujo Júnior E, Peixoto AB, Zamarian AC, Elito Júnior J, Tonni G. Macro- somia. Best Pract Res Clin Obstet Gynaecol 2017;38:83-96.
23) Tantanasis T, Daniilidis A, Giannoulis C, Tzafettas M, Dinas K, Loufopoulos A, et al. Sonographic assessment of fetal subcutaneous fat tissue thick- ness as an indicator of gestational diabetes. Eur J Obstet Gynecol Reprod Biol 2010;152:157-62.