ABSTRACT
The purpose of this study was to investigate the relationship between serum tumor markers and dietary intakes in healthy adults to address a nutrition guide for cancer prevention. We analyzed tumor-related markers, carcinoembryonic antigen (CEA), alpha-fetoprotein (AFP), prostate-specific antigen (PSA), and cancer antigen 125 (CA125) in serum and daily food and nutrient intakes using a 24-hour recall method in 23 healthy men and 32 healthy women.
The average age was 50.7 years for men and 48.9 years for women. There were no significant differences in biochemical tumor markers and food intake between the men and women except energy intake. A significantly positive correlation was found between serum AFP, a biochemical marker of liver cancer, and serum glutamic oxaloacetic transaminase (GOT) and/
or glutamic pyruvate transaminase (GPT) in both men and women. CEA had a significant and negative correlation with energy intake for men and food intake in women. PSA, a biomarker of prostate cancer, was significantly and positively correlated with the intake of animal iron and cholesterol in men. CA125, a biomarker of gynecologic cancers, was significantly and positively correlated with meat intake in women. As this study revealed the significant relationship between biochemical tumor markers and dietary factors, further studies are needed to elucidate the underlying mechanism of this relationship.
Keywords: Tumors; Biomarkers; Carcinoembryonic antigen; Alpha-fetoproteins;
Prostate-specific antigen; CA-125 antigen; Diet
INTRODUCTION
Cancer is known to be the leading cause of death as population aging continues. According to the statistics of the Korea National Statistical Office in 2015, 27.9% of the deaths were due to cancer, which is the most common cause of death in Korea [1]. Gastric cancer, liver cancer, and uterine cancer, which are known to be common in Korea, have been decreasing, while lung cancer and so-called Western cancer such as colon cancer, breast cancer, and prostate cancer are rapidly increasing [2]. These changes in cancer incidence seem to be mainly caused by the westernization of eating habits such as consuming meat and instant food.
Cancer not only has a high mortality rate, but is also susceptible to sequela and requires
Original Article
Received: May 1, 2018 Revised: May 30, 2018 Accepted: Jun 1, 2018 Correspondence to Mi-Kyeong Choi
Division of Food Science, Kongju National University, 54 Daehak-ro, Yesan 32439, Korea.
E-mail: [email protected] Copyright © 2018. The Korean Society of Clinical Nutrition
This is an Open Access article distributed under the terms of the Creative Commons Attribution Non-Commercial License (https://
creativecommons.org/licenses/by-nc/4.0/) which permits unrestricted non-commercial use, distribution, and reproduction in any medium, provided the original work is properly cited.
ORCID iDs Mi-Hyun Kim
https://orcid.org/0000-0002-0805-0630 Mi-Kyeong Choi
https://orcid.org/0000-0002-6227-4053 Conflict of Interest
The authors declare that they have no competing interests.
Mi-Hyun Kim , Mi-Kyeong Choi
Division of Food Science, Kongju National University, Yesan 32439, Korea
Relationship Between Serum
Tumor-related Markers and Dietary
Intakes in Korean Healthy Adults
environment [3]. Cancer is a disease that takes decades to develop, and is mainly caused by smoking, drinking and other drug use, physical damage, inadequate eating habits, and lack of physical activity [4]. Considering that cancer is the most representative disease that threatens a healthy life, cancer prevention is very important, and strategies to prevent cancer can be found in one's personal lifestyle and environment [5].
The National Cancer Center in Korea recommends that a cancer medical examination should be conducted periodically while following healthy life guidelines such as non-smoking, desirable eating habits, regular exercise, maintaining healthy weight, and moderate drinking for cancer prevention [6]. Cancer medical examinations vary as to target, examination cycle, and screening method according to the type of cancer. Several methods, such as ultrasound, computed tomography, and magnetic resonance imaging, are used in cancer medical examinations. But the discovery limit of tumors is from 10 to 5 mm, and if less than this, then they are very difficult to find [7].
Tumor marker screening performed using blood is a simpler and easier way to screen and monitor cancer. Since the first discovery of alpha-fetoprotein (AFP) by Abelev in 1963, carcinoembryonic antigen (CEA), cancer antigen 19-9 (CA19-9), prostate-specific antigen (PSA), and cancer antigen 125 (CA125) have been found. These tumor markers are used for population screening, diagnosis, prediction of prognosis, and follow-up observation [8].
However, there are no ideal tumor markers indicating an early detection, accurate diagnosis, and prognosis. Even so, tumor markers can be used to investigate their relationship with dietary factors for cancer prevention in healthy people.
Recently, the screening of various tumor markers has been done with the generalization of health and medical screening [7]. However, studies on the relationship between these markers and the dietary factors for cancer prevention are limited. The purpose of this study was to investigate the relationship of serum tumor markers (CEA, AFP, PSA, and CA125) with dietary intake in Korean healthy adults.
MATERIALS AND METHODS
Subjects
Study subjects were recruited from Daecheon in South Korea. Among the study volunteers, those with a diagnosis of any disease, those under medication and diet control, and pregnant or lactating women were excluded. Finally, 55 subjects (23 men and 32 women between the ages of 32 and 74) participated in the current study. The study was conducted according to the guidelines of the Declaration of Helsinki and all procedures were approved by the Institutional Review Board of Sungshin Women's University (IRB-2010-018). Written informed consent was obtained from all subjects.
Anthropometric measurements
Body weight and height were measured using the InBody Body Composition Analyzer (X-SCAN PLUS II, Biospace, Seoul, Korea) and a stadiometer while subjects were barefoot and wearing minimal clothing. All measurements were repeated twice, and the two
measurements were averaged. Body mass index (BMI) was calculated as weight in kilograms divided by squared height in meters.
Blood collection and analysis
Fasting blood was collected using syringes and transferred into both complete blood count bottles (CBC bottles, Vacutainer 3 mL; BD, Franklin Lakes, NJ, USA) and vacuum blood collection tubes in the morning after the day of the dietary intake survey. Serum was separated by centrifugation at 400 × g for 15 minutes. Hemoglobin (Hb) and hematocrit (Hct) were analyzed using an autoanalyzer (ADVIA 1650; Bayer, Tokyo, Japan) within 1 hour of blood collection. Serum was stored at −70°C until the test was conducted. Serum glutamic oxaloacetic transaminase (GOT) and glutamic pyruvate transaminase (GPT) were analyzed using an autoanalyzer (ADVIA 1650; Bayer). Serum AFP (RIA; Diasorin Co., Saluggia, Italy), CEA (RIA-gnost CEA; Cisbio International Co., Paris, France), PSA (RIA-mat; Sangted Co., Bonn, Germany), and CA125 (DPC Coat-A-Count RIA; Siemens Ltd., Washington, D.C., USA) were analyzed by radioimmunoassay method.
Dietary intake survey
The dietary intake survey was conducted for one day using a 24-hour recall method through personal interviews performed by well-trained staff members. Subjects provided the types and amounts of all foods consumed for breakfast, lunch, dinner, and snacks from waking in the morning until bedtime. In order to aid recall and increase the accuracy of intake, food models and photographs were used. Daily energy and nutrient intake were analyzed using Can-Pro 4.0 (The Korean Nutrition Society, Seoul, Korea).
Statistical analysis
Data were presented as mean ± standard deviation (SD). Differences in the variables between men and women were assessed using the unpaired Student's t-test. The correlation between each variable was evaluated for its significance using Pearson's correlation test and then partial correlation was conducted after adjusting for age and BMI as potential confounding factors that have potential impacts on tumor-related biomarkers. To check normal
distribution of variables, a Shapiro-Wilk test was conducted. Statistical analysis system (SAS) version 9.4 (SAS Institute, Cary, NC, USA) was used for all statistical analyses. Two-sided p values of < 0.05 were considered statistically significant.
RESULTS
General and tumor-related biomarker
General characteristics and serum tumor-related biomarkers of the subjects are shown in Table 1. The mean age, weight, height, and BMI were 50.7 years, 70.4 kg, 168.4 cm, and 24.7 kg/m2 for men and 49.0 years, 57.9 kg, 155.1 cm, and 24.1 kg/m2 for women, respectively (Data not shown). Hb, Hct, GOT, and GPT of total subjects were 14.1 g/dL, 41.7%, 28.0 IU/L, and 29.7 IU/L, respectively. As serum tumor markers, AFP, CEA, and PSA for men were 4.6 ng/mL, 1.6 ng/mL, and 1.0 ng/mL, respectively, and the levels of AFP, CEA, and CA125 for women were 2.4 ng/mL, 1.5 ng/mL, and 21.5 U/mL, respectively. There were no significant differences in biochemical tumor markers between the men and women.
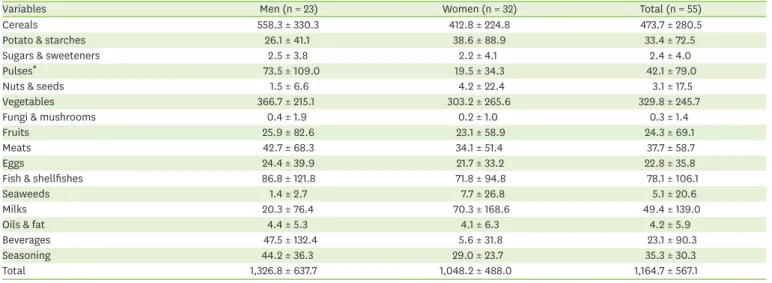
Daily nutrient and food intake
Daily nutrient and food intakes of the subjects are shown in Tables 2 and 3. Daily intakes of energy and nutrients such as protein, carbohydrate, phosphorus, iron, and zinc of the men were significantly higher than those of the women (2,279.2 kcal vs. 1,541.3 kcal, p < 0.01).
However, there was no significant difference in food intake between the men and women (1,326.8 g/d vs. 1,048.2 g/d).
Relationship of serum tumor marker with general biomarker
Correlation between serum tumor markers and general biomarkers of the subjects are shown in Table 4. After adjusting for confounding factors of age and BMI, there was a significantly positive correlation between AFP, biochemical marker of liver cancer, and GOT and/or GPT in both men and women. Also, there was a significant and positive correlation between CEA and Hb and Hct in women.
Table 1. General and tumor-related biomarkers in blood of the subjects
Variables Men (n = 23) Women (n = 32) Total (n = 55)
Hb (g/dL)† 15.5 ± 1.5 13.1 ± 1.1 14.1 ± 1.8
Hct (%)† 45.5 ± 3.7 39.0 ± 2.8 41.7 ± 4.6
GOT (IU/L)* 38.3 ± 25.1 20.7 ± 4.3 28.0 ± 18.5
GPT (IU/L)† 45.4 ± 43.2 18.4 ± 6.1 29.7 ± 31.1
AFP (ng/mL) 4.6 ± 9.5 2.4 ± 1.0 3.3 ± 6.2
CEA (ng/mL) 1.6 ± 0.7 1.5 ± 1.0 1.5 ± 0.9
PSA (ng/mL) 1.0 ± 0.6 - 1.0 ± 0.6
CA125 (U/mL) - 21.5 ± 18.3 21.5 ± 18.3
Values are expressed as mean ± standard deviation.
Hb, hemoglobin; Hct, hematocrit; GOT, glutamic oxaloacetic transaminase; GPT, glutamic pyruvate transaminase; AFP, alpha-fetoprotein; CEA, carcinoembryonic antigen; PSA, prostate-specific antigen; CA125, cancer antigen 125.
*p < 0.01, †p < 0.001; significance between men and women as determined by t-test.
Table 2. Daily nutrient intakes of the subjects
Variables Men (n = 23) Women (n = 32) Total (n = 55)
Energy (kcal/d)† 2,279.2 ± 1,140.5 1,541.3 ± 686.9 1,849.9 ± 967.3
Protein (g/d)* 83.2 ± 43.6 59.4 ± 31.3 69.3 ± 38.4
Plant protein (g/d)† 55.8 ± 27.7 34.2 ± 19.1 43.3 ± 25.2
Animal protein (g/d) 27.4 ± 22.7 25.1 ± 19.6 26.1 ± 20.8
Lipid (g/d) 44.5 ± 40.2 33.1 ± 25.9 37.8 ± 32.8
Plant lipid (g/d) 27.6 ± 36.1 15.5 ± 12.1 20.6 ± 25.5
Animal lipid (g/d) 16.9 ± 19.6 17.6 ± 19.5 17.3 ± 19.4
Carbohydrate (g/d)† 385.8 ± 168.1 254.4 ± 115.3 309.3 ± 153.0
Fiber (g/d)* 25.6 ± 13.0 17.8 ± 12.7 21.1 ± 13.2
Ca (mg/d) 519.5 ± 299.5 446.0 ± 328.6 476.7 ± 316.0
Plant Ca (mg/d) 362.7 ± 191.7 260.2 ± 205.4 303.1 ± 204.4
Animal Ca (mg/d) 156.9 ± 175.2 185.7 ± 222.2 173.7 ± 202.6
P (mg/d)* 1,136.8 ± 610.2 828.9 ± 458.9 957.6 ± 544.2
Fe (mg/d)* 18.5 ± 13.5 10.9 ± 6.8 14.1 ± 10.7
Plant Fe (mg/d)* 16.2 ± 13.5 8.7 ± 5.9 11.9 ± 10.4
Animal Fe (mg/d) 2.3 ± 1.8 2.2 ± 1.9 2.2 ± 1.8
Na (mg/d) 6,026.4 ± 2,984.8 4,563.9 ± 2,915.6 5,175.5 ± 3,006.6
K (mg/d) 2,794.8 ± 1,483.2 2,273.3 ± 1,370.5 2,491.4 ± 1,428.9
Zn (mg/d)* 10.1 ± 4.4 7.5 ± 4.4 8.6 ± 4.5
Vitamin A (µg RE/d) 560.0 ± 501.3 710.3 ± 679.4 647.4 ± 610.7
Vitamin B1 (mg/d) 1.2 ± 0.6 1.0 ± 0.6 1.1 ± 0.6
Vitamin B2 (mg/d) 1.0 ± 0.7 1.0 ± 0.7 1.0 ± 0.7
Vitamin B6 (mg/d) 2.0 ± 1.2 1.5 ± 0.9 1.7 ± 1.0
Niacin (mg/d) 16.1 ± 8.8 12.6 ± 8.4 14.1 ± 8.7
Vitamin C (mg/d) 78.6 ± 49.1 72.8 ± 56.9 75.2 ± 53.4
Folate (µg/d) 291.2 ± 145.1 226.2 ± 181.9 253.4 ± 169.1
Vitamin E (mg/d) 10.9 ± 8.2 8.9 ± 7.7 9.7 ± 7.9
Cholesterol (mg/d) 256.6 ± 253.6 221.4 ± 190.0 236.1 ± 217.4
Values are expressed as mean ± standard deviation.
*p < 0.05, †p < 0.01; significance between men and women as determined by t-test.
Relationship between serum tumor marker and nutrient intake
Correlation between serum tumor markers and nutrient intakes in the subjects are shown in Table 5. After adjusting for confounding factors of age and BMI, CEA had a significantly negative correlation with energy intake for men. CEA also had a significantly negative correlation with the intake of protein, carbohydrate, zinc, vitamin B6, and folate in both men and women. PSA, a biomarker of prostate cancer, was significantly and positively correlated with animal iron and cholesterol intake in men.
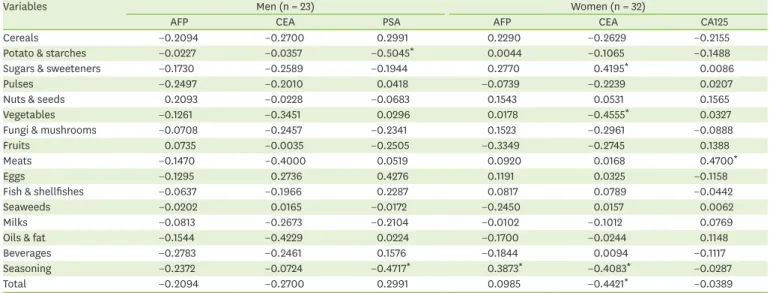
Relationship of serum tumor marker with food intake
Correlation between serum tumor markers and food intakes in the subjects are shown in Table 6. After adjusting for confounding factors of age and BMI, CEA had a significantly negative correlation with food intake in women. CA125, a biomarker of gynecologic cancers, was significantly and positively correlated with meat intake in women.
DISCUSSION
This study analyzed four tumor biomarkers (AFP, CEA, PSA, and CA125) and their relationship with dietary intakes in healthy adults. Serum CEA, a commonly used tumor marker in gastrointestinal cancer had a significant negative correlation with energy in men Table 3. Daily food intakes of the subjects (unit: g/d)
Variables Men (n = 23) Women (n = 32) Total (n = 55)
Cereals 558.3 ± 330.3 412.8 ± 224.8 473.7 ± 280.5
Potato & starches 26.1 ± 41.1 38.6 ± 88.9 33.4 ± 72.5
Sugars & sweeteners 2.5 ± 3.8 2.2 ± 4.1 2.4 ± 4.0
Pulses* 73.5 ± 109.0 19.5 ± 34.3 42.1 ± 79.0
Nuts & seeds 1.5 ± 6.6 4.2 ± 22.4 3.1 ± 17.5
Vegetables 366.7 ± 215.1 303.2 ± 265.6 329.8 ± 245.7
Fungi & mushrooms 0.4 ± 1.9 0.2 ± 1.0 0.3 ± 1.4
Fruits 25.9 ± 82.6 23.1 ± 58.9 24.3 ± 69.1
Meats 42.7 ± 68.3 34.1 ± 51.4 37.7 ± 58.7
Eggs 24.4 ± 39.9 21.7 ± 33.2 22.8 ± 35.8
Fish & shellfishes 86.8 ± 121.8 71.8 ± 94.8 78.1 ± 106.1
Seaweeds 1.4 ± 2.7 7.7 ± 26.8 5.1 ± 20.6
Milks 20.3 ± 76.4 70.3 ± 168.6 49.4 ± 139.0
Oils & fat 4.4 ± 5.3 4.1 ± 6.3 4.2 ± 5.9
Beverages 47.5 ± 132.4 5.6 ± 31.8 23.1 ± 90.3
Seasoning 44.2 ± 36.3 29.0 ± 23.7 35.3 ± 30.3
Total 1,326.8 ± 637.7 1,048.2 ± 488.0 1,164.7 ± 567.1
Values are expressed as mean ± standard deviation.
*p < 0.05; significance between men and women as determined by t-test.
Table 4. Correlation between tumor-related and general biochemical markers adjusted for age and BMI of the subjects
Variables Men (n = 23) Women (n = 32)
AFP CEA PSA AFP CEA CA125
Hb −0.0699 −0.0954 0.2198 0.2529 0.4027* −0.0387
Hct −0.0344 −0.0410 0.0857 0.1648 0.4357* 0.0471
GOT 0.7297‡ 0.2360 −0.0776 0.3284 0.1927 −0.1477
GPT 0.9273‡ 0.0754 −0.0532 0.5163† −0.0859 −0.0793
BMI, body mass index; Hb, hemoglobin; Hct, hematocrit; GOT, glutamic oxaloacetic transaminase; GPT, glutamic pyruvate transaminase; AFP, alpha-fetoprotein;
CEA, carcinoembryonic antigen; PSA, prostate-specific antigen; CA125, cancer antigen 125.
*p < 0.05, †p < 0.01, ‡p < 0.001; significance as determined by Pearson's correlation coefficient.
correlated with animal iron and cholesterol intake in men, while CA125, a biomarker of gynecologic cancers, was positively correlated with meat intake in women.
Table 5. Correlation between serum tumor markers and nutrient intakes adjusted for age and BMI of the subjects
Variables Men (n = 23) Women (n = 32)
AFP CEA PSA AFP CEA CA125
Energy −0.2444 −0.5028* 0.2630 0.0348 −0.3416 0.0133
Protein −0.2739 −0.4669* 0.1485 0.0377 −0.2843 0.0671
Plant protein −0.3163 −0.4360 −0.0025 −0.0281 −0.4506* 0.0317
Animal protein −0.1695 −0.4063 0.2900 0.0878 0.0115 0.0731
Lipid −0.2193 −0.4740* 0.3143 −0.0676 −0.0644 0.1985
Plant lipid −0.2074 −0.4224 0.2884 −0.2277 −0.0634 0.0624
Animal lipid −0.0917 −0.2454 0.1475 0.0585 −0.0461 0.2303
Carbohydrate −0.2184 −0.4680* 0.2252 0.0741 −0.4014* −0.0694
Fiber −0.3006 −0.3867 −0.1873 −0.0746 −0.4074* 0.1140
Ca −0.2264 −0.3116 −0.1525 −0.1270 −0.4020* 0.0553
Plant Ca −0.3284 −0.2805 −0.1268 −0.0731 −0.3751 0.1294
Animal Ca −0.0378 −0.2353 −0.1263 −0.1127 −0.2262 −0.0397
P −0.2386 −0.4256 0.0488 0.0080 −0.3591 0.0511
Fe −0.3416 −0.3896 0.1184 0.0262 −0.4611* 0.2301
Plant Fe −0.3273 −0.3592 0.0474 0.0042 −0.4922† 0.1464
Animal Fe −0.1524 −0.2853 0.5784† 0.0808 −0.1125 0.3670
Na −0.3104 −0.2838 0.1193 −0.0546 −0.3805 −0.0308
K −0.2393 −0.3827 −0.1411 −0.1072 −0.3287 −0.0042
Zn −0.2361 −0.5192* 0.0839 −0.0011 −0.3889* 0.0798
Vitamin A −0.2079 −0.3704 −0.0793 0.0944 −0.2139 −0.1309
Vitamin B1 −0.2985 −0.1290 0.0157 −0.0110 −0.1151 0.0065
Vitamin B2 −0.2000 −0.1987 0.0174 0.0620 −0.2244 0.0126
Vitamin B6 −0.1607 −0.5319* 0.0406 0.1573 −0.4013* 0.0288
Niacin −0.1857 −0.5304* 0.0606 0.1043 −0.3753 0.0970
Vitamin C −0.1874 −0.2808 −0.2357 0.0154 −0.4383* 0.0221
Folate −0.2977 −0.4647* −0.1955 −0.0347 −0.4159* 0.0354
Vitamin E −0.2344 −0.6233† 0.1622 −0.0878 −0.2208 0.0681
Cholesterol −0.1728 −0.1849 0.5558* 0.1070 −0.0800 0.1512
BMI, body mass index; AFP, alpha-fetoprotein; CEA, carcinoembryonic antigen; PSA, prostate-specific antigen; CA125, cancer antigen 125.
*p < 0.05, †p < 0.01; significance as determined by Pearson's correlation coefficient.
Table 6. Correlation between serum tumor markers and food intakes adjusted for age and BMI of the subjects
Variables Men (n = 23) Women (n = 32)
AFP CEA PSA AFP CEA CA125
Cereals −0.2094 −0.2700 0.2991 0.2290 −0.2629 −0.2155
Potato & starches −0.0227 −0.0357 −0.5045* 0.0044 −0.1065 −0.1488
Sugars & sweeteners −0.1730 −0.2589 −0.1944 0.2770 0.4195* 0.0086
Pulses −0.2497 −0.2010 0.0418 −0.0739 −0.2239 0.0207
Nuts & seeds 0.2093 −0.0228 −0.0683 0.1543 0.0531 0.1565
Vegetables −0.1261 −0.3451 0.0296 0.0178 −0.4555* 0.0327
Fungi & mushrooms −0.0708 −0.2457 −0.2341 0.1523 −0.2961 −0.0888
Fruits 0.0735 −0.0035 −0.2505 −0.3349 −0.2745 0.1388
Meats −0.1470 −0.4000 0.0519 0.0920 0.0168 0.4700*
Eggs −0.1295 0.2736 0.4276 0.1191 0.0325 −0.1158
Fish & shellfishes −0.0637 −0.1966 0.2287 0.0817 0.0789 −0.0442
Seaweeds −0.0202 0.0165 −0.0172 −0.2450 0.0157 0.0062
Milks −0.0813 −0.2673 −0.2104 −0.0102 −0.1012 0.0769
Oils & fat −0.1544 −0.4229 0.0224 −0.1700 −0.0244 0.1148
Beverages −0.2783 −0.2461 0.1576 −0.1844 0.0094 −0.1117
Seasoning −0.2372 −0.0724 −0.4717* 0.3873* −0.4083* −0.0287
Total −0.2094 −0.2700 0.2991 0.0985 −0.4421* −0.0389
BMI, body mass index; AFP, alpha-fetoprotein; CEA, carcinoembryonic antigen; PSA, prostate-specific antigen; CA125, cancer antigen 125.
*p < 0.05; significance as determined by Pearson's correlation coefficient.
AFP is a fetal serum protein that is produced at birth and decreases after birth, and decreases to the level observed in adults after 18 months. It may be increased in liver cancer or germ cell tumors. Therefore, it can be used for determination of cancer stage or therapeutic effect and as a screening test for hepatocellular carcinoma in oriental countries, which have a high prevalence of liver cancer [9]. Serum GOT and GPT are useful markers for diagnosis of liver disease. This study also showed that serum AFP was positively correlated with serum GOT and/or GPT in both men and women.
CEA is a glycoprotein that is the most commonly used tumor marker in gastrointestinal cancer. It was initially thought to be a specific marker for colorectal cancer, but it could also be increased in breast, lung, and liver cancer. CEA is not well used as a screening test because of its low positive predictive value, but it can be used for examining stage of cancer, prognosis, and recurrence [9]. In this study, serum CEA showed a significantly negative correlation with the intake of various nutrients such as protein, carbohydrate, zinc, vitamin B6, and folate in men and women. Therefore, CEA also showed a significantly negative correlation with energy intake in men and total food intake in women, which can represent various nutrient intakes.
Many studies [10-13] have shown that malnutrition increases the risk of cardiovascular disease or cerebrovascular disease as well as cancer, including the American Cancer Society cohort study [14] and the Italian cohort study [15]. Kim [16] also showed a 1.65-fold risk of cancer death in the group with energy intake less than 75% of estimated energy requirement in a study with national longitudinal data. This means that the risk of cancer is significantly higher in the group with poor energy intake. This present study is a cross-sectional study and cannot be directly compared with the previous longitudinal studies. Even so, the result that CEA was significantly and negatively correlated with energy and food intake indicates the importance of adequate energy and food intake in healthy people.
PSA is a proteolytic enzyme synthesized in the epithelium of the prostate gland. It is a useful tumor marker for screening prostate cancer because it is rarely expressed in other tissues except the prostate gland. However, PSA is specific for prostate tissue but not tumor specific, and may be increased in cases of prostate hyperplasia, prostatitis, and prostate infarction.
PSA can be used for post-operative recurrence as well as prostate cancer screening. [17].
CA125 is a polymeric glycoprotein that increases in gynecologic cancers such as ovarian cancer and endometrial cancer. In addition, it can be increased in pancreatic cancer, lung cancer, breast cancer, colorectal cancer, and gastrointestinal cancer. Screening tests are less valuable, but are associated with the prognosis of endometrial cancer and the size, stage, and survival rate of ovarian cancer [18].
In this study, PSA as a biomarker of prostate cancer was significantly and positively correlated with animal iron and cholesterol intake in men. CA125, a biomarker of gynecologic cancers, was positively correlated with meat intake in women. Undesirable eating habits are an important cause of cancer development, as seen in 30% of all cancer deaths. The most common risk factors are animal saturated fats and meat, and these dietary factors are associated with the development of various types of cancer, especially colon cancer, breast cancer, and prostate cancer [19]. Meanwhile, it has been reported that iron overload may increase the risk of developing neoplasms by weakening the host defense against cancer cells [20,21]. Excess iron accumulation in tissues may increase the risk of cancer by increasing
study, the results indicating a positive correlation of PSA with animal iron and cholesterol intake in men and CA125 with meat intake in women may be similar to the results of previous studies [19-22]. However, the present study is a cross-sectional study of simple correlations, and future research is needed to explain the direct relationship between these tumor biomarkers and dietary factors.
This study has some limitations in generalizing the results. The cross-sectional nature of this study does not allow us to determine the direct relevance or causality of the factors shown in the results. In addition, since the number of subjects is small, the reliability of the results may be low. Moreover, we did not analyze lifestyle related to cancer such as drinking, smoking, and physical activity. Nevertheless, this study is especially noteworthy in that it is the first to examine the relationship between serum tumor markers and dietary factors. Therefore, the results of this study provide useful information for future studies for cancer prevention.
CONCLUSION
Regarding the relationships of the four tumor biomarkers with dietary intake, serum CEA had a significantly negative correlation with energy intake in men and total food intake in women. PSA, a biomarker of prostate cancer, showed a significantly positive correlation with animal iron and cholesterol intake in men. For women, CA125, a biomarker of gynecologic cancers, was positively correlated with meat intake. These findings may serve as a foundation for implementing nutrition guidelines for the prevention and management of cancers.
REFERENCES
1. Statistics Korea. Causes of death statistics in 2015. Daejeon: Statistics Korea; 2015.
2. Koh SJ, Kim JS. The reasons for the increased incidence of colorectal cancer in Korea. Korean J Med 2010;79:97-103.
3. Kim H, Yang DW, Kang E, Kim D, Kim J, Bae EY. Cancer care costs at the end of life. Korean J Health Econ Policy 2017;23:123-42.
4. Yoo KY, Kang D, Park SK, Kim SU, Kim SU, Shin A, Yoon H, Ahn SH, Noh DY, Choe KJ. Epidemiology of breast cancer in Korea: occurrence, high-risk groups, and prevention. J Korean Med Sci 2002;17:1-6.
PUBMED | CROSSREF
5. Miller SM, Bowen DJ, Lyle J, Clark M, Mohr D, Wardle J, Ceballos R, Emmons K, Gritz E, Marlow L.
Primary prevention, aging, and cancer: overview and future perspectives. Cancer 2008;113:3484-92.
PUBMED | CROSSREF
6. National Cancer Center (KR). Guideline for cancer prevention [Internet]. Available from http://ncc.re.kr/
main.ncc?uri=manage01_3. [cited 2018 April 21]. 2016.
7. Kim JY, Shim SC, Jeong HS, Lee SS. Clinical efficacy of various tumor markers in medical screening.
Korean J Med 2001;60:148-55.
8. Kobayashi T, Kawakubo T. Prospective investigation of tumor markers and risk assessment in early cancer screening. Cancer 1994;73:1946-53.
PUBMED | CROSSREF
9. Zur B, Holdenrieder S, Walgenbach-Brünagel G, Albers E, Stoffel-Wagner B. Method comparison for determination of the tumor markers AFP, CEA, PSA and free PSA between Immulite 2000 XPI and Dimension Vista 1500. Clin Lab 2012;58:97-105.
PUBMED
10. Baker JP, Detsky AS, Wesson DE, Wolman SL, Stewart S, Whitewell J, Langer B, Jeejeebhoy KN.
Nutritional assessment: a comparison of clinical judgement and objective measurements. N Engl J Med 1982;306:969-72.
PUBMED | CROSSREF
11. Volkert D, Kruse W, Oster P, Schlierf G. Malnutrition in geriatric patients: diagnostic and prognostic significance of nutritional parameters. Ann Nutr Metab 1992;36:97-112.
PUBMED | CROSSREF
12. Mowé M, Bøhmer T, Kindt E. Reduced nutritional status in an elderly population (> 70 y) is probable before disease and possibly contributes to the development of disease. Am J Clin Nutr 1994;59:317-24.
PUBMED | CROSSREF
13. McCullough ML, Feskanich D, Stampfer MJ, Giovannucci EL, Rimm EB, Hu FB, Spiegelman D, Hunter DJ, Colditz GA, Willett WC. Diet quality and major chronic disease risk in men and women: moving toward improved dietary guidance. Am J Clin Nutr 2002;76:1261-71.
PUBMED | CROSSREF
14. Seymour JD, Calle EE, Flagg EW, Coates RJ, Ford ES, Thun MJAmerican Cancer Society. Diet Quality Index as a predictor of short-term mortality in the American Cancer Society Cancer Prevention Study II Nutrition Cohort. Am J Epidemiol 2003;157:980-8.
PUBMED | CROSSREF
15. Farchi G, Fidanza F, Grossi P, Lancia A, Mariotti S, Menotti A. Relationship between eating patterns meeting recommendations and subsequent mortality in 20 years. Eur J Clin Nutr 1995;49:408-19.
PUBMED
16. Kim HR. A study on the association of diet quality and risk of mortality and major chronic diseases from nationally representative longitudinal data. Health Soc Welf Rev 2013;33:5-30.
CROSSREF
17. Oesterling JE, Jacobsen SJ, Chute CG, Guess HA, Girman CJ, Panser LA, Lieber MM. Serum prostate- specific antigen in a community-based population of healthy men. Establishment of age-specific reference ranges. JAMA 1993;270:860-4.
PUBMED
18. Jacobs I, Bast RC Jr. The CA 125 tumour-associated antigen: a review of the literature. Hum Reprod 1989;4:1-12.
PUBMED | CROSSREF
19. Ferguson LR. Meat consumption, cancer risk and population groups within New Zealand. Mutat Res 2002;506-507:215-24.
PUBMED | CROSSREF
20. Knekt P, Reunanen A, Takkunen H, Aromaa A, Heliövaara M, Hakulinen T. Body iron stores and risk of cancer. Int J Cancer 1994;56:379-82.
PUBMED | CROSSREF
21. Schümann K, Ettle T, Szegner B, Elsenhans B, Solomons NW. On risks and benefits of iron supplementation recommendations for iron intake revisited. J Trace Elem Med Biol 2007;21:147-68.
PUBMED | CROSSREF
22. Weinberg ED. Iron and neoplasia. Biol Trace Elem Res 1981;3:55-80.
PUBMED | CROSSREF