Background and Purpose The rapid increases in the elderly population and urbanization in South Korea have influenced both demographics and the environment. This study investi- gated trends in the prevalence and incidence of Parkinson’s disease (PD), and the associations of PD with the urban and rural environments in South Korea.
Methods This study examined subjects aged 40 years or older in a cohort constructed using the National Sample Cohort data set in South Korea during 2002–2013. We estimated the age-standardized prevalence and incidence of PD based on the 2002 population, and esti- mated their trends. We analyzed regional differences in these rates by dividing South Korea into three regions based on geographic characteristics and two regions based on the degree of urbanization.
Results The standardized prevalence rates of PD per 100,000 increased significantly from 75.8 in 2003 to 136.8 in 2012 (p<0.0001), especially in older subjects. The standardized preva- lence of PD was highest in metropolitan Seoul. The standardized incidence of PD per 100,000 was 13.9 in 2003 and 10.3 in 2012, with no significant trend (p>0.05). The standardized inci- dence of PD in younger subjects was lower in eastern Korea than in the other two regions, while in the older subjects it was lower in western Korea than in metropolitan Seoul over al- most the entire analyzed period. The standardized incidence of PD did not differ significantly between metropolitan and nonmetropolitan areas.
Conclusions The standardized prevalence of PD increased steadily from 2003 to 2012 in South Korea, while its standardized incidence has remained constant. There were regional differences in the prevalence and incidence of PD based on the degree of urbanization and the area of agricul- tural land.
Key Words Parkinson’s disease, National Sample Cohort, prevalence, incidence, age standardization, environment.
Region-Based Analysis of Prevalence and Incidence of Parkinson’s Disease: Analysis of the National Sample Cohort in South Korea
INTRODUCTION
Parkinson’s disease (PD) is a common neurodegenerative disorder characterized by mo- tor symptoms (resting tremor, rigidity, bradykinesia, and postural instability) and nonmo- tor symptoms (autonomic nerve dysfunction, sleep disorders, pain, and dementia). Most patients will need either temporary or permanent medical-care services during the course of the disease. The progression of PD has a negative effect on the lives of patients themselves and increases the socioeconomic burden.1-3 From a socioeconomic perspective, it is nec- essary to understand changes in the epidemiological trends of PD and establish appropri- ate countermeasures.
Age is an important factor in the development of most brain degenerative diseases, in- Seung-Hwan Leea,b
Seung-Joon Leec Young-Ju Kimd
a Departments of Neurology and
c Internal Medicine, Kangwon National University School of Medicine, Chuncheon, Korea
b Brain and Neural Science Researches Institute,
Kangwon National University Hospital, Chuncheon, Korea
d Department of Statistics, Kangwon National University, Chuncheon, Korea
pISSN 1738-6586 / eISSN 2005-5013 / J Clin Neurol 2018;14(4):478-486 / https://doi.org/10.3988/jcn.2018.14.4.478
Received January 26, 2018 Revised April 1, 2018 Accepted April 8, 2018 Correspondence Seung-Hwan Lee, MD Department of Neurolgy, Kangwon National University School of Medicine, 1 Gangwondaehak-gil, Chuncheon 24341, Korea Tel +82-33-250-8802 Fax +82-33-259-5635
E-mail [email protected]
cc This is an Open Access article distributed under the terms of the Creative Commons Attribution Non-Com- mercial License (https://creativecommons.org/licenses/by-nc/4.0) which permits unrestricted non-commercial use, distribution, and reproduction in any medium, provided the original work is properly cited.
JCN
Open Access ORIGINAL ARTICLELee SH et al.
JCN
cluding PD.4 The 2015 Revision of the World Population Prospects has quantified how the number of older persons has increased in most countries and regions, including South Korea, and has projected that this increase will accelerate in coming decades (http://esa.un.org/unpd/wpp).5 In parallel, the number of patients with PD is expected to increase rap- idly in the near future.6
While the loss of dopaminergic neurons in the substantia nigra, gliosis, and eosinophilic cytoplasmic inclusion bod- ies is a key component of the pathology of PD, various eti- ologies have been proposed for the development of PD, in- cluding environmental toxins and endogenous and genetic factors that could potentially result in mitochondrial dysfunc- tion, oxidative stress, protein misfolding, and defective pro- teolysis.7-9 Although the risk factors that are significantly asso- ciated with PD remain to be confirmed, exposure to well water, pesticides, herbicides, insecticides, industrial chemicals, farming, and living in a rural area have all been implicated as environmental risk factors.10-14 In contrast, one study found that the incidence of PD was higher in urban than rural ar- eas.15 South Korea has undergone rapid urbanization and industrialization since the middle of the 20th century, and the currently inhomogeneous distribution of industrialization and urbanization within South Korea has produced distinct regional differences in the area of agricultural land and a pop- ulation concentration in large cities (http://esa.un.org/unpd/
wpp).
Based on the changes in the population structure and en- vironment caused by uneven urbanization and industrial- ization, we hypothesized that the long-term prevalence and incidence of PD in South Korea would be influenced by the aging population and the trends in geographic areas associ- ated with urban or rural environments. We also hypothe- sized that the age-standardized, hereafter simply described as standardized, prevalence and incidence rates at a specific point in time for a given population structure would enable us to infer the trends regardless of changes in population struc- ture.
To examine our hypotheses, we investigated trends in the crude and standardized prevalence and incidence rates of PD in South Korea using data from the Korean National Health Insurance Service (NHIS) program obtained from 2002 to 2013, and analyzed trends in the standardized prevalence and incidence rates of PD according to geographic charac- teristics in South Korea during the same period.
METHODS
Data acquisition
The NHIS is a universal health insurance program that offers
medical-care coverage to all residents of South Korea (http://
nhiss.nhis.or.kr). Almost all Korean residents are registered with the NHIS.
NHIS operates the NHIS sharing service to support policy and academic research using national health information materials. As part of the NHIS sharing service, the NHIS National Sample Cohort (NSC) was constructed based on data from the entire South Korea population in 2002. Re- searchers can apply for research materials online and use them after receiving approval from the NIHS. The NHIS NSC contains about one million subscribers to the NHIS and the Medical Aid program extracted using stratified sam- pling methods in 2002 and comprising approximately 2% of all Koreans. A 12-year cohort (2002–2013) of the NSC was tracked in terms of socioeconomic variables (residence loca- tion, year and month of death, cause of death, and income level) and medical-treatment details (health examinations, medical-care history, and medical-care institutions). These data enable long-term observations, and can be used to inves- tigate causal relationships. Diseases in the NSC are registered using the sixth edition of the Korean Classification of Disease, which is modified from the International Classification of Dis- ease (ICD-10) for use by the NHIS and medical-care institu- tions in South Korea.16
We inferred the distribution of a population by region and the area of arable land in South Korea using data from Statistics Korea (http://www.index.go.kr) and the Korean Statistical Information Service (http://www.kosis.kr).
This study had a population-based cohort design and was conducted using the NHIS NSC (NHIS-2017-2-325) and ap- proved by the Institutional Review Board of Kangwon National University Hospital (IRB No. KNUH-2016-02-012-001).
Analysis strategy
In addition to analyzing the epidemiologic features of PD in South Korea, we analyzed regional differences in the preva- lence and incidence of PD by dividing South Korea into three regions based on administrative and geographic character- istics, and into two regions based on the degree of urbaniza- tion. The three regions based on administrative and geograph- ic characteristics were metropolitan Seoul (Seoul, Incheon, and Gyeonggi-do), eastern Korea (Busan, Daegu, Ulsan, Gang- won-do, Gyeongsangbuk-do, and Gyeongsangnam-do), and western Korea (Gwangju, Daejeon, Chungcheongbuk-do, Chungcheongnam-do, Jeollabuk-do, Jeollanam-do, and Jeju Special Self-Governing Province). Geographically, metropol- itan Seoul is a flat area with the smallest proportion of agri- cultural land among the three regions, while economically it is industrialized and urbanized. Eastern Korea is a mountain area and comprises a large proportion of agricultural land.
Prevalence and Incidence of Parkinson Disease
JCN
Western Korea is a flat area with the largest proportion of agricultural land among the three regions (Fig. 1A).17
In terms of the degree of urbanization, the metropolitan area comprised Seoul, Incheon, Busan, Daegu, Ulsan, Gwangju, and Daejeon, and the nonmetropolitan area comprised Gyeonggi- do, Gangwon-do, Gyeongsangbuk-do, Gyeongsangnam-do, Chungcheongbuk-do, Chungcheongnam-do, Jeollabuk-do, Jeollanam-do, and Jeju Special Self-Governing Province (Fig.
1B). Most metropolitan cities in South Korea contain more than one million people.
The inhomogeneity of urbanization is certainly likely to be affected by geographic characteristics. However, in this study, South Korea was divided into three regions according to administrative and geographic characteristics and into two regions according to the degree of urbanization. Each subscriber in the cohort resided in one of the above regions.
We measured the area of agricultural land in each region in 2002 under the assumption that the area of agricultural land indirectly reflects the degree of exposure to pesticides, herbicides, farming, and rural living.
There were two potential problems with analyzing the NSC from 2002 to 2013. First, some of the subscribers are dis- qualified over time due to death or emigration, and are re- placed by newborn infants. Because this study analyzed pa- tients with PD aged 40 years or older, it is possible that some
of the disqualified or replaced subscribers constituted con- founding factors when we inferred the prevalence and inci- dence of PD in South Korea since 2003. Second, the demo- graphic structure of the cohort has changed with the ongoing increases in age and life expectancy. Because PD is a degen- erative disease associated with age, the changes in the prev- alence and incidence in the cohort over time may be exag- gerated compared to the actual rates for South Korea. We applied a standardization method18,19 to minimize these co- founding effects, using the population in 2002 as the stan- dard population to calculate the standardized overall preva- lence and incidence of PD and that in different geographic and urban/rural regions. We examined whether there were linear trends in the crude and standardized prevalence and incidence rates of PD during the study period.
Inclusion and exclusion criteria
From the NSC data set we selected subscribers who were aged 40 years or older in 2003. A case of PD was defined as a subscriber who took at least one anti-PD drug for more than 3 months within the first year after an initial diagnosis with classification code G20 in the ICD-10 protocol. The anti- PD drugs included L-dopa and L-dopa-modifying drugs, ergot/nonergot dopamine agonists, amantadine, catechol- o-methyl transferase inhibitors, anticholinergics, and sele-
Fig. 1. Population and agricultural areas in (A) three regions based on administrative and geographic characteristics and (B) two regions based on the degree of urbanization in South Korea in 2002. CCBD: Chungcheongbuk-do, CCND: Chungcheongnam-do, GGD: Gyeonggi-do, GSBD: Gyeong- sangbuk-do, GSND: Gyeongsangnam-do, GWD: Gangwon-do, JEJU: Jeju Special Self-Governing Province, JLBD: Jeollabuk-do, JLND: Jeollanam-do.
Metropolitan 48%
Metropolitan 4%
Nonmetropolitan
52% Nonmetropolitan
96%
n ∙= ∙47.6 million Area ∙= ∙18,600 km2
Population Agricultural area
Seoul metropolitan Eastern 47%
Korea 31%
Eastern Korea
33%
Western Korea
54%
Western Korea
22%
Population
n ∙= ∙47.6 million Area ∙= ∙18,600 km2
Agricultural area
Seoul metropolitan
13%
GGD GWD
GSBD Daegu
Ulsan Busan GSND JEJU
JLDN JLBD CCND
CCBD Daejeon Seoul Incheon
Gwangju
B A
Lee SH et al.
JCN
giline. We excluded subscribers with secondary (G21) or atypical (G22 and G23) parkinsonism. We also subdivided the PD patients into younger (aged 40–65 years) and older (aged >65 years) groups.
We were unable to decide whether some of the subjects in 2002 satisfied the inclusion and exclusion criteria, and so we excluded subscribers with ICD-10 classification code G20 registered in 2002 because the time of onset of their disease was unclear (n=223).
Statistical analyses
We applied the test of homogeneity to determine whether or not the structure of population differed within each of the two or three regions. The crude prevalence per 100,000 in South Korea overall and within each region was calculated by dividing the number of subjects classified as ICD-10 code G20 in each year by the total number of subjects in that year.
The standardized prevalence rate of PD can be used to cal- culate comparable prevalence rates of PD by year with the following formulas:
(Expected prevalence by age)=
(subjects with PD)
×(standard polulation by age) (total population)
(Standardized prevalence)=
∑(number for expected prevalence by age)
×100,000 ∑(standard population)
We similarly calculated the crude incidence rate of PD per 100,000 South Koreans and for each of the regions. The standardized incidence of PD corrected for the age struc- ture of the standard population of South Korea and of the regions can be used to calculate comparable incidence rates of PD by year with the following formulas:
(Expected incidence by age)=
(incidence of PD by age)×(standard population by age) (Standardized incidence)=
∑(expected incidence by age)
×100,000 ∑(standard population)
Trend analysis was applied to South Korea as a whole and to each region to investigate the trend variation in the prev- alence and incidence of PD during the study period. We as- sumed that the trends in the prevalence and incidence of PD were compatible with a linear model. The Cochran-Ar- mitage trend test was used to determine whether there were significant increasing (or decreasing) linear trends in the prevalence and incidence rates of PD.20,21 The statistical anal- ysis was performed using the statistical package SAS for Win- dows (version 9.4, SAS Institute, Cary, NC, USA).
RESULTS
In 2003, the NSC contained 395,097 subjects aged 40 years old or older, of which 306 had newly diagnosed PD (Table 1 and 2). The number of subjects had increased to 495,160 in 2012, with 820 diagnosed as PD (Table 2). As the age of the population in the cohort increased, there were more cas- es in the cohort that were aged 40 years or older than the number of persons who had been disqualified due to death or immigration. Fig. 1 shows the proportion of the popula- tion and areas of agricultural land in the regions based on urbanization and geographic characteristics in 2002. The population structure did not differ significantly between the two urbanization regions or between the three geographic regions in the homogeneity test (p>0.05) (Supplementary Fig. 1 in the online-only Data Supplement).
The crude prevalence of PD per 100,000 subjects aged 40 years old or older in South Korea increased gradually from 77.5 in 2003 to 165.6 in 2012, which was the last year of the Table 1. The example of the frequency of the newly diagnosed as Parkinson’s disease aged 40 or older by topographical and administrative regions in 2003
Regions Parkinson disease (2003)
Total
No (%) Yes (%)
Topographical regions
Seoul metropolitan 176,307 (44.7) 153 (50.0) 176,460
Eastern Korea 125,751 (31.8) 74 (24.2) 125,825
Western Korea 92,733 (23.5) 79 (25.8) 92,812
Administrative regions
Metropolitan 182,927 (46.3) 153 (50.0) 183,080
Nonmetropolitan 211,864 (53.7) 153 (50.0) 212,017
Total 394,791 306 395,097
Data are n or n (%) values.
Prevalence and Incidence of Parkinson Disease
JCN
study. The standardized prevalence of PD also increased from 75.8 to 136.8 during the same period (Fig. 2A). In the trend analysis, both the crude and standardized prevalence rates of PD increased in subjects aged 40 years old or older (p<0.0001) (Table 2). Both the crude and standardized prev- alence rates of PD increased faster in the older group than in the younger group (p<0.0001).
In the region-specific analysis based on administrative and geographic characteristics, the standardized prevalence of PD per 100,000 in 2003 was highest in metropolitan Seoul (younger group=39.7, older group=317.9), followed by western Korea (younger group=30.6, older group=226.7) and eastern Korea (younger group=23.0, older group=185.7).
In the trend analysis, the standardized prevalence rates of PD in the three regions increased gradually regardless of group, and their order did not change over the entire observation period (p<0.05) with the exception of the younger group in
eastern Korea (Fig. 3A and B). There was a prominent in- creasing trend in the standardized prevalence of PD in the older group. The standardized prevalence of PD in the older group increased faster in metropolitan Seoul than in western and eastern Korea (p<0.0001).
In the analysis of prevalence based on the degree of ur- banization, the standardized prevalence rates of PD per 100,000 in 2003 in the younger and older groups were 37.9 and 311.2, respectively, in metropolitan areas, and 27.4 and 208.8 in nonmetropolitan areas. In the trend analysis, the standardized prevalence rates of PD in the two regions in- creased gradually for all periods regardless of group (p<0.05) with the exception of the younger group in the metropoli- tan region (Fig. 3C and D). The increasing trend in the stan- dardized prevalence of PD was especially prominent in the older group, as was also the case in the region-specific analysis.
The crude incidence of PD per 100,000 South Koreans Table 2. Crude/standardized prevalence and incidence of Parkinson disease for 40 years old or older in South Korea from 2003 to 2012
Year Population (n) Parkinson disease (n) Prevalence*
De novo (n) Incidence*
Crude Standardized Crude Standardized
2003 395,097 306 77.5 75.8 56 14.2 13.9
2004 405,800 378 93.2 89.8 73 18.0 17.3
2005 417,524 432 103.5 98.3 63 15.1 14.4
2006 423,119 493 116.5 108.3 82 19.4 18.0
2007 441,470 565 128.0 117.0 79 17.9 16.4
2008 444,287 611 137.5 125.1 85 19.1 17.4
2009 456,082 671 147.1 131.2 74 16.2 14.5
2010 470,068 713 151.7 132.5 68 14.5 12.9
2011 483,608 777 160.7 136.2 87 18.0 14.8
2012 495,160 820 165.6 136.8 60 12.1 10.3
Estimation 9.7 6.8
p-value <0.0001 <0.0001 0.53 0.13
(n) indicates numbers. The p-value represents the result the Cochran–Armitage trend test.
*Prevalence rate per 100,000 persons and incidence rate per 100,000 person-years.
2003 2004 2005 2006 2007 2008 2009 2010 2011 2012 250
200
150
100
50
0
Prevalence per 100,000 persons
Standardized (40+) p<0.0001 Crude (40+) p<0.0001
2003 2004 2005 2006 2007 2008 2009 2010 2011 2012 40
35 30 25 20 15 10 5 0
Incidence per 100,000 persons
Standardized (40+) p=0.1256 Crude (40+) p=0.53
A B
Fig. 2. Trends in the crude and standardized prevalence (A) and incidence (B) rates of Parkinson’s disease for those aged 40 years or older in South Korea from 2003 to 2012.
Year Year
Lee SH et al.
JCN
aged 40 years or older was 14.2 in 2003 and 12.1 in 2012; the corresponding standardized rates of PD per 100,000 were 13.9 and 10.3, respectively (Fig. 2B). The rate fluctuated ev- ery year from 2003 to 2012, and the trend analysis showed no change in the trends for the crude or standardized inci- dence (p>0.05) (Table 2).
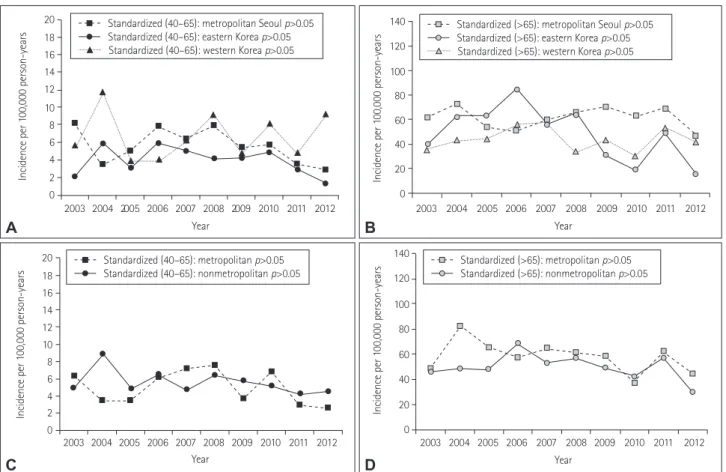
In the regional analysis based on the administrative and geographic characteristics in 2003, the standardized inci- dence rates of PD per 100,000 in the younger and older groups were 8.2 and 62.4, respectively, in metropolitan Seoul, 2.0 and 40.0 in eastern Korea, and 5.6 and 36.3 in western Korea. There were no significant trends in either group re- gardless of region for all periods (p>0.05) (Fig. 4A and B).
The standardized incidence of PD in the younger group was lower in eastern Korea than in the other two regions, while the standardized incidence in the older group was lower in western Korea than in metropolitan Seoul over almost all of the analyzed periods.
In the analysis according to the degree of urbanization, the standardized incidence rates of PD per 100,000 in 2003 were 6.3 and 48.4 in the younger and older groups, respec- tively, in metropolitan areas, and 5.0 and 46.5 in nonmetropol-
itan areas. There was no significant trend in either the met- ropolitan or nonmetropolitan area (p>0.05) (Fig. 4C and D).
DISCUSSION
We limited the PD patients in this study to those classified as ICD-10 code G20 who had taken anti-PD drugs for at least 3 months, and we used a standardized method to adjust for demographic changes in the cohort over time. To analyze possible environmental influences on the occurrence of PD, we made regional comparisons after dividing South Korea into regions that indirectly reflect urban and rural environ- ments. We were unable to obtain clinical information for the PD patients, such as the Hoehn-Yahr stage or the score on the Unified Parkinson’s Disease Rating Scale. Such data are im- portant for the clinical diagnosis of PD and for differentiat- ing PD from other neurodegenerative diseases such as atypical and secondary parkinsonism. Even with a careful diagnostic approach based on a full history and a neurological examina- tion, the diagnostic accuracy of PD reportedly still only reaches 75–90%.22-26 We therefore defined a patient with PD as one classified as ICD-10 code G20 and who had been Fig. 3. Standardized prevalence rates of Parkinson’s disease in South Korea in three regions (A and B) based on administrative and geographic char- acteristics and in two regions (C and D) based on the degree of urbanization according to age (40–65 years and >65 years). The p values are for trend analyses. *p<0.05, †p<0.001, ‡p<0.0001.
2003 2004 2005 2006 2007 2008 2009 2010 2011 2012 100
90 80 70 60 50 40 30 20 10 0
Prevalence per 100,000 persons
Standardized (40–65): metropolitan p>0.05 Standardized (40–65): nonmetropolitan*
2003 2004 2005 2006 2007 2008 2009 2010 2011 2012 100
90 80 70 60 50 40 30 20 10 0
Prevalence per 100,000 persons
Standardized (40–65): metropolitan Seoul*
Standardized (40–65): eastern Korea p>0.05 Standardized (40–65): western Korea*
2003 2004 2005 2006 2007 2008 2009 2010 2011 2012 900
800 700 600 500 400 300 200 100 0
Prevalence per 100,000 persons
Standardized (>65): metropolitan Seoul‡ Standardized (>65): eastern Korea† Standardized (>65): western Korea‡
2003 2004 2005 2006 2007 2008 2009 2010 2011 2012 900
800 700 600 500 400 300 200 100 0
Prevalence per 100,000 persons
Standardized (>65): metropolitan‡ Standardized (>65): nonmetropolitan‡
A
C
B
D
Year Year
Year Year
Prevalence and Incidence of Parkinson Disease
JCN
taking anti-PD drugs for at least 3 months. Although the finding of no trend in the standardized incidence of PD registered in the NHIS NSC during all observations might imply that the diagnosis accuracy of PD has remained relative constant, there is a risk that the actual number of patients with PD differed from this.
We found that both the crude and standardized prevalence rates of PD in the NSC increased during all observation pe- riods, and there was a tendency for the difference between the crude and standardized prevalence rates of PD to in- crease over time. These results indicated that the prevalence of PD in the NSC was probably affected by demographic changes associated with the time point of the measurement.
The process of age adjustment through standardization can help to reduce any bias in the interpretation of the results.
The trends we observed in the standardized prevalence of PD suggest that this involves factors other than the change in population structure resulting from an increasing pro- portion of elderly in the population. Because the incidence of PD in the NSC was relatively constant over the study pe- riod, the change in the life expectancy of PD patients is one possible reason for this; however, we did not evaluate this.
Some studies have found that the life expectancy of PD pa- tients was lower than that of the general population,27-29 al- though a recent study found no significant difference in the life expectancy of PD patients who receive regular specialist care using all currently available therapies.30 Our results also suggest that the life expectancy of patients with PD is increas- ing, in the same that the life expectancy of normal subjects has been increasing in recent decades.5
In the analysis by administrative and geographic regions, the standardized prevalence in the younger group was con- stant over time except in metropolitan Seoul, where it in- creased from 39.7 per 100,000 in 2003 to 46.4 per 100,000 in 2012. In contrast, the standardized prevalence in the old- er group increased rapidly in all three regions, with it being approximately twofold higher in 2012 than in 2002. Other studies conducted in South Korea and other Asian countries have obtained different results (Table 3).31-37 We believe that methodological differences including in how PD patients are defined, the inclusion and exclusion criteria, and the sta- tistical approaches have contributed to the differences among studies. The time of observation could also be an important factor affecting the measured prevalence of PD given the in-
2003 2004 2005 2006 2007 2008 2009 2010 2011 2012 20
18 16 14 12 10 8 6 4 2 0
Incidence per 100,000 person-years
Standardized (40–65): metropolitan p>0.05 Standardized (40–65): nonmetropolitan p>0.05 2003 2004 2005 2006 2007 2008 2009 2010 2011 2012 20
18 16 14 12 10 8 6 4 2 0
Incidence per 100,000 person-years
Standardized (40–65): metropolitan Seoul p>0.05 Standardized (40–65): eastern Korea p>0.05 Standardized (40–65): western Korea p>0.05
2003 2004 2005 2006 2007 2008 2009 2010 2011 2012 140
120 100 80 60 40 20 0
Incidence per 100,000 person-years
Standardized (>65): metropolitan Seoul p>0.05 Standardized (>65): eastern Korea p>0.05 Standardized (>65): western Korea p>0.05
2003 2004 2005 2006 2007 2008 2009 2010 2011 2012 140
120 100 80 60 40 20 0
Incidence per 100,000 person-years
Standardized (>65): metropolitan p>0.05 Standardized (>65): nonmetropolitan p>0.05
A
C
B
D
Fig. 4. Standardized incidence rates of Parkinson’s disease in South Korea in three regions (A and B) based on administrative and geographic char- acteristics and in two regions (C and D) based on the degree of urbanization according to age (40–65 years and >65 years). The p values are for trend analyses.
Year Year
Year Year
Lee SH et al.
JCN
creasing life expectancy of the normal population.
The effects of urbanization were greater in the older group than in the younger group. We believe that this was due to a change in life expectancy and the relatively constant inci- dence of PD. A particularly interesting finding was that the standardized prevalence was highest in metropolitan Seoul.
The standardized prevalence in the older group was ap- proximately 1.5-fold higher in the metropolitan region than in the nonmetropolitan regions. We found no significant association between agricultural area and the prevalence of PD, despite previous studies finding that rural life is a risk factor for developing PD. It is not clear why the prevalence was higher in urban areas. One possible reason is that the presence of many general hospitals in urban areas increases the opportunity for those living in a metropolitan area to be diagnosed with PD.
We found no significant change in either the crude or stan- dardized incidence of PD in the NSC during the study pe- riod, although there was a significant difference between the crude and standardized incidence rates of PD that increased over time. These results demonstrate the need for age ad- justment through standardization to reduce bias.
In contrast to our expectations, the standardized incidence of PD in South Korea did not change over the study period.
Also, subanalyses of agricultural and urban areas showed no significant trends. This finding of a constant incidence
rate of PD differs from previous studies, and the exact rea- son for our finding is unclear. Because the diagnostic accu- racy of PD has been constant for the last 2 decades,22-26 we assume that the actual incidence of PD in South Korea has also been constant.
There was a tendency for the standardized incidence of PD to differ among the three regions of metropolitan Seoul, eastern Korea, and western Korea. The standardized inci- dence in the younger group tended to be lower in eastern Korea, while that of the older group tended to be higher in metropolitan Seoul. We postulated that there is an associa- tion between the actual incidence of PD and the environ- ment. Another interesting finding is that the standardized incidence of PD varied widely during the entire observa- tional period. One possible explanation is the applied inclu- sion criteria, such as taking the anti-PD drug for at least 3 months, or a time mismatch between diagnosis and the ac- tual onset of illness. Another explanation could be that the level of environmental risk exposure changed during the time preceding the study period; however, further study is neces- sary to identify the exact cause.
One limitation of this study is that the subjects in the co- hort might have resided in different regions prior to the co- hort study, which could have biased the measured occurrence of PD in South Korea. The other limitation is that we could not determine whether any difference in residence location Table 3. Comparison of the results of the present study with those of previous studies
First author Age, years Region Ascertainment method Incidence* Prevalence* Publication year
Ho31 ≥60 Hong Kong Survey and clinical examination 3.4%† 1989
Okada32 ≥20 City in Japan Survey and clinical examination 82.0‡ 1990
Chen33 ≥40 Taiwan Survey and clinical examination 10.4‡ 130.1‡ 2001
Van den Eeden34 ≥30 California, USA Medical-care program records 13.4‡ 2003
Tan35 ≥50 Singapore Survey and clinical examination 0.3%†,‡ 2004
Seo36 ≥18 City in South Korea Survey and clinical examination 374 2007
Yamawaki37 ≥20 City in Japan Survey and clinical examination 9.8‡ in 1992 10.3‡ in 2004
145.8‡ in 1980 147.0‡ in 1992 166.8‡ in 2004
2009
Present study ≥40 South Korea NHIS records 13.9‡ in 2003
17.3‡ in 2004 14.4‡ in 2005 18.0‡ in 2006 16.4‡ in 2007 17.4‡ in 2008 14.5‡ in 2009 12.9‡ in 2010 14.8‡ in 2011 10.3‡ in 2012
75.8‡ in 2003 89.8‡ in 2004 98.3‡ in 2005 108.3‡ in 2006 117.0‡ in 2007 125.1‡ in 2008 131.2‡ in 2009 132.5‡ in 2010 136.2‡ in 2011 136.8‡ in 2012
-
*Incidence rate per 100,000 person-years, and prevalence rate per 100,000 persons, †Percentage epidemiology results in the original article, not per 100,000 persons, ‡Age-standardized value.
NHIS: National Health Insurance Service.
Prevalence and Incidence of Parkinson Disease
JCN
would directly affect the contact with external risk factors.
In conclusion, we have applied age standardization to esti- mate the actual trends in the prevalence and incidence rates of PD in the NSC by minimizing the impact of changes in population structure. The standardized prevalence of PD increased steadily from 2003 to 2012 in South Korea, while the standardized incidence of PD remained fairly constant.
The prevalence and incidence rates of PD differed with the administrative and geographic regions, and with the degree of urbanization.
Supplementary Materials
The online-only Data Supplement is available with this arti- cle at https://doi.org/10.3988/jcn.2018.14.4.478.
Conflicts of Interest
The authors have no financial conflicts of interest.
Acknowledgements
This study was supported by 2017 research grant from Kangwon Nation- al University Hospital and Kangwon National University (520170437).
The authors thank to Hanhee Choi for data management.
REFERENCES
1. Dorsey ER, George BP, Leff B, Willis AW. The coming crisis: obtaining care for the growing burden of neurodegenerative conditions. Neurol- ogy 2013;80:1989-1996.
2. Findley LJ. The economic impact of Parkinson’s disease. Parkinson- ism Relat Disord 2007;13 Suppl:S8-S12.
3. Huse DM, Schulman K, Orsini L, Castelli-Haley J, Kennedy S, Lenhart G. Burden of illness in Parkinson’s disease. Mov Disord 2005;20:1449- 1454.
4. Driver JA, Logroscino G, Gaziano JM, Kurth T. Incidence and re- maining lifetime risk of Parkinson disease in advanced age. Neurology 2009;72:432-438.
5. Kontis V, Bennett JE, Mathers CD, Li G, Foreman K, Ezzati M. Fu- ture life expectancy in 35 industrialised countries: projections with a Bayesian model ensemble. Lancet 2017;389:1323-1335.
6. Dorsey ER, Constantinescu R, Thompson JP, Biglan KM, Holloway RG, Kieburtz K, et al. Projected number of people with Parkinson dis- ease in the most populous nations, 2005 through 2030. Neurology 2007;
68:384-386.
7. Dauer W, Przedborski S. Parkinson’s disease: mechanisms and models.
Neuron 2003;39:889-909.
8. Gupta A, Dawson VL, Dawson TM. What causes cell death in Parkin- son’s disease? Ann Neurol 2008;64 Suppl 2:S3-S15.
9. Sulzer D. Multiple hit hypotheses for dopamine neuron loss in Parkin- son’s disease. Trends Neurosci 2007;30:244-250.
10. Brown TP, Rumsby PC, Capleton AC, Rushton L, Levy LS. Pesticides and Parkinson’s disease--is there a link? Environ Health Perspect 2006;
114:156-164.
11. Noyce AJ, Bestwick JP, Silveira-Moriyama L, Hawkes CH, Giovanno- ni G, Lees AJ, et al. Meta-analysis of early nonmotor features and risk factors for Parkinson disease. Ann Neurol 2012;72:893-901.
12. Golbe LI, Farrell TM, Davis PH. Follow-up study of early-life protec- tive and risk factors in Parkinson’s disease. Mov Disord 1990;5:66-70.
13. Palin O, Herd C, Morrison KE, Jagielski AC, Wheatley K, Thomas GN, et al. Systematic review and meta-analysis of hydrocarbon expo-
sure and the risk of Parkinson’s disease. Parkinsonism Relat Disord 2015;21:243-248.
14. Priyadarshi A, Khuder SA, Schaub EA, Shrivastava S. A meta-analy- sis of Parkinson’s disease and exposure to pesticides. Neurotoxicology 2000;21:435-440.
15. Taba P, Asser T. Incidence of Parkinson’s disease in estonia. Neuroep- idemiology 2003;22:41-45.
16. An SJ, Lee SH, Lee SY, Kwon JW, Lee SJ, Kim YJ. Femur fractures in parkinsonism: analysis of a national sample cohort in South Korea. J Clin Neurol 2017;13:380-386.
17. Tak HM, Kim SH, Son IL. [A study on distributions and spatial prop- erties of geomorphological mountain area]. J Korean Geogr Soc 2013;
48:1-18.
18. Choi BC, de Guia NA, Walsh P. Look before you leap: stratify before you standardize. Am J Epidemiol 1999;149:1087-1096.
19. Spiegelman M, Marks HH. I. Empirical testing of standards for the age adjustment of death rates by the direct method. Hum Biol 1966;38:280- 20. Cochran WG. Some methods for strengthening the common χ292. 2 tests.
Biometrics 1954;10:417-451.
21. Armitage P. Tests for linear trends in proportions and frequencies.
Biometrics 1955;11:375-386.
22. Hughes AJ, Daniel SE, Lees AJ. Improved accuracy of clinical diagno- sis of Lewy body Parkinson’s disease. Neurology 2001;57:1497-1499.
23. Rajput AH, Rozdilsky B, Rajput A. Accuracy of clinical diagnosis in parkinsonism--a prospective study. Can J Neurol Sci 1991;18:275-278.
24. Hughes AJ, Daniel SE, Kilford L, Lees AJ. Accuracy of clinical diagno- sis of idiopathic Parkinson’s disease: a clinico-pathological study of 100 cases. J Neurol Neurosurg Psychiatry 1992;55:181-184.
25. Hughes AJ, Daniel SE, Ben‐Shlomo Y, Lees AJ. The accuracy of diag- nosis of parkinsonian syndromes in a specialist movement disorder service. Brain 2002;125:861-870.
26. Joutsa J, Gardberg M, Röyttä M, Kaasinen V. Diagnostic accuracy of parkinsonism syndromes by general neurologists. Parkinsonism Relat Disord 2014;20:840-844.
27. Louis ED, Marder K, Cote L, Tang M, Mayeux R. Mortality from Parkinson disease. Arch Neurol 1997;54:260-264.
28. Elbaz A, Bower JH, Peterson BJ, Maraganore DM, McDonnell SK, Ahlskog JE, et al. Survival study of Parkinson disease in Olmsted County, Minnesota. Arch Neurol 2003;60:91-96.
29. Ishihara LS, Cheesbrough A, Brayne C, Schrag A. Estimated life ex- pectancy of Parkinson’s patients compared with the UK population. J Neurol Neurosurg Psychiatry 2007;78:1304-1309.
30. Diem-Zangerl A, Seppi K, Wenning GK, Trinka E, Ransmayr G, Oberaigner W, et al. Mortality in Parkinson’s disease: a 20-year follow- up study. Mov Disord 2009;24:819-825.
31. Ho SC, Woo J, Lee CM. Epidemiologic study of Parkinson’s disease in Hong Kong. Neurology 1989;39:1314-1318.
32. Okada K, Kobayashi S, Tsunematsu T. Prevalence of Parkinson’s dis- ease in Izumo city, Japan. Gerontology 1990;36:340-344.
33. Chen RC, Chang SF, Su CL, Chen TH, Yen MF, Wu HM, et al. Preva- lence, incidence, and mortality of PD: a door-to-door survey in Ilan county, Taiwan. Neurology 2001;57:1679-1686.
34. Van Den Eeden SK, Tanner CM, Bernstein AL, Fross RD, Leimpeter A, Bloch DA, et al. Incidence of Parkinson’s disease: variation by age, gender, and race/ethnicity. Am J Epidemiol 2003;157:1015-1022.
35. Tan LC, Venketasubramanian N, Hong CY, Sahadevan S, Chin JJ, Krishnamoorthy ES, et al. Prevalence of Parkinson disease in Singa- pore: Chinese vs Malays vs Indians. Neurology 2004;62:1999-2004.
36. Seo WK, Koh SB, Kim BJ, Yu SW, Park MH, Park KW, et al. Prevalence of Parkinson’s disease in Korea. J Clin Neurosci 2007;14:1155-1157.
37. Yamawaki M, Kusumi M, Kowa H, Nakashima K. Changes in preva- lence and incidence of Parkinson’s disease in Japan during a quarter of a century. Neuroepidemiology 2009;32:263-269.