Received: July 15, 2016 Revised: October 14, 2016 Accepted: November 9, 2016 CLINICAL
NEUROPHYSIOLOGY
Correspondence to Byung-Jo Kim
Department of Neurology, Korea University Anam Hospital, Korea Univer- sity College of Medicine, 73 Inchon-ro, Seongbuk-gu, Seoul 02841, Korea Tel: +82-2-920-6619
Fax: +82-2-925-2472 E-mail: [email protected]
* These authors contributed equally to this study.
Median and ulnar F-wave inversion as a supplementary criterion for diagnosis of carpal tunnel syndrome
Yoohwan Kim1*, Jae-Hong Jang1, Charles S. Cho2, and Byung-Jo Kim1,3*
1Department of Neurology, Korea University Anam Hospital, Korea University College of Medicine, Seoul, Korea
2Department of Neurology, Stanford University School of Medicine, Palo Alto, CA, USA
3Brain Convergence Research Center, Korea University Anam Hospital, Seoul, Korea
Background: Median F-wave latencies are physiologically shorter than ulnar latencies, but they are often longer relative to ulnar latencies in carpal tunnel syndrome (CTS). This study aimed to investigate the value of absolute F-waves and relative latency changes compared to ulnar latencies in the diagnosis of CTS.
Methods: F-wave latencies of median and ulnar nerves in 339 hands from 339 patients with CTS and 60 hands from 60 control subjects were investigated. Mean F-wave minimal latencies of median and ulnar nerves were compared between groups. Patients were further divided into subgroups based on Canterbury grading and then analyzed using F-wave latency differ- ences (FWLD) and F-wave ratio (FWR).
Results: Of 339 hands in the CTS group, 236 hands exhibited F-wave inversion based on the FWLD criterion and 277 hands had F-wave inversion based on the FWR criterion. F-wave in- version had a sensitivity of 81.7% using the FWR criterion to diagnose CTS. The mean FWLD and FWR were significantly greater in all patient subgroups compared to the control group (p
< 0.001). In addition, mean FWLD and FWR showed significant correlations (r = –0.683 and r = 0.674, respectively, p < 0.001) with disease severity.
Conclusions: F-wave studies are effective supplementary diagnostic tools comparing to oth- er standard electrophysiologic criteria for screening patients with CTS.
Key words: Carpal tunnel syndrome; Diagnosis; Electrodiagnosis; Sensitivity and specificity;
F-wave
INTRODUCTION
Carpal tunnel syndrome (CTS) is a common clinical condi- tion. Factors such as repetitive wrist movements, obesity, diabetes mellitus, and rheumatoid arthritis predispose me- dian neuropathy of the wrist.1-3 Diagnosis of CTS is based predominantly on clinical history and examination findings.4 Electrophysiologic study is necessary to confirm clinical impressions, particularly in atypical or subtle presentations.
Often, sensory and mixed nerve conduction studies are sen- sitive and specific enough to corroborate the clinical diag- nosis.5 Since the false-negativity rates of those studies range from 10-15%, various adjunct methods are used in conjunc- tion to increase the sensitivity and specificity.6-8
F-wave latency is a late motor response. Median F-wave latencies are physiologically shorter than ulnar latencies based on anatomical length and axonal diameter. How- ever, they are often prolonged relative to ulnar latencies in CTS. Comparing F-wave latencies between ipsilateral median and ulnar nerves is a simple adjunct study. Two small studies suggested the efficacy of this adjunct test in the late 1990s.6,9 Since then, there have been some studies of the electrodiagnostic usefulness of F-wave parameters in CTS.10-13 However, those studies reported inconsistent results regarding the usefulness of F-waves.
This study was performed to investigate the value of abso- lute F-waves and relative latency changes compared to ul- nar latencies in diagnosing CTS in a large cohort of subjects.
The sensitivity of F waves and their correlation with clinical severity of CTS was also investigated.
MATERIALS AND METHODS
Subjects
Patients between the ages of 20 and 80 years with CTS confirmed by electrodiagnostic studies were recruited from patients who consecutively visited a single neuromuscular center for clinical symptoms and signs suggestive of CTS.
Exclusion criteria included a history consistent with any spine-related problem, muscle diseases, neuromuscular junction disorders, or medical conditions that could poten- tially develop into peripheral neuropathy. Patients who had any abnormal findings that could not be explained by CTS in
the electrodiagnostic studies were excluded.
The control group consisted of patients who visited for neck pain or tightness without any symptoms or signs in- volving the shoulder or upper extremity and without any specific diagnosis after thorough examination, electrodiag- nostic studies, and imaging studies. Patients in the control group were re-examined at least once after one month to confirm that they did not have any specific neuromuscular or spine-related diseases. Approval from the institutional review board and human subjects review was obtained at study onset. Informed consent that outlined the nature of the study was obtained prior to the procedure.
Electrophysiologic study
Prior to nerve conduction study (NCS), each patient’s skin tem- perature was confirmed to be at or above 32°C by recording surface temperature at the thenar eminence. Room tempera- ture was maintained at 25°C. NCS was performed by an elec- tromyographer using the standard technique of supramaximal percutaneous stimulation given at approximately 20-33%
above the stimuli intensity that did not produce further ampli- tude increase or shortened latency. For median motor NCSs, the active electrode was placed over the belly of the abductor pollicis brevis (APB) and the reference electrode was placed over the distal tendon. The compound muscle action potential (CMAP) was obtained when the median nerve was stimulated 5 cm proximal from the active electrode on a line tracing the approximate anatomic course of the median nerve. For me- dian sensory NCSs, the active electrode was placed between two prominent middle tendons at the wrist and the reference recording electrode was placed 4 cm proximal to the record- ing electrode. Sensory nerve action potential (SNAP) was ob- tained when the median nerve was stimulated at both bases of the index finger and 7 cm distal from the active electrode.
Distal latency of CMAP was determined as onset of negative CMAP waveform deflection relative to the baseline. SNAP la- tency was determined as the negative peak. NCSs on the ulnar motor nerve with adductor digiti minimi (ADM) and sensory nerve recordings were also performed to exclude patients with any other abnormal findings in electrodiagnostic studies besides CTS. If median motor and sensory NCSs were normal, then a comparison test of median and ulnar sensory conduc- tion between the wrist and ring fingers was performed. The median and ulnar nerves were stimulated at the ring finger us-
ing ring electrodes and recorded at 14 cm from the ring finger at the wrist. A difference between the median and ulnar nerve latencies of ≥ 0.5 ms was considered abnormal.
F-waves were recorded from the APB muscle after stimu- lation of the median nerve and they were recorded from the ADM muscle after stimulation of the ulnar nerve at the wrist.
Active and reference electrodes were placed at the same points as CMAP recordings. Minimum latency was used for data analysis among recordings that were repeated at least 20 times with 1-sec interstimuli intervals using supramax- imal stimulation. For CMAP recordings, filter settings were 2-10,000 Hz, and they were 2-3,000 Hz for F-wave record- ings. Using the minimal latency of F-waves (FWML), F-wave latency difference (FWLD) was calculated for analysis by sub- tracting ulnar F-wave latency from median F wave-latency.
In addition, the F-wave ratio (FWR) was calculated using the function: FWR = median F latency/ulnar F latency.
Statistical analysis
A separate investigator not involved in performing the electrophysiologic studies or obtaining clinical data ana- lyzed data from both the control and CTS groups. In cases of patients with CTS in both hands, only NCS data from the worst hand were used for analysis. For the control group, the dominant hand was selected for analysis. Patients were further divided into groups based on Canterbury grading.
Demographic data and FWML between both groups were compared using a t-test. Differences in FWLD and FWR among the control and patient subgroups were analyzed using one-way analysis of variance. Dunnett’s test was used for post hoc analysis. Correlations of FWLD and FWR with demographic data and Canterbury grading were analyzed using Pearson correlation.
RESULRT
Subjects
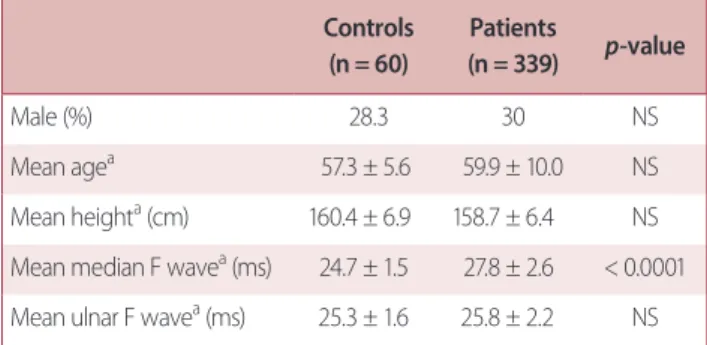
In the CTS group, data from 339 subjects generated a sam- ple size of 339 hands. Based on the Canterbury grading scale,14 25 hands were grade 1, 196 hands were grade 2, 49 hands were grade 3, 47 hands were grade 4, and 22 hands were grade 5, as shown in Table 1. Sixty control subjects were included in the analysis, generating a total sample size of 60 hands with dominance. No significant differences re- lated to demographic variables were found between control subjects and patients. These data are summarized in Table 2.
Comparison of F-waves
The absolute F-wave latencies of all subjects in the con- trol group were within normal range. Median FWML was prolonged compared to ulnar FWML in the CTS group (p Table 1. FWLD and FWR of control subjects and patient subgroups
Control Patients with Canterbury grading
1 2 3 4 5 Total
Number of hands (n) 60 25 196 49 47 22 339
Mean FWLDa (ms) –0.65 ± 0.64 1.06 ± 1.1b 0.97 ± 1.5b 2.6 ± 1.8c 3.33 ± 2.6c 7.96 ± 4.2 1.99 ± 2.6
Range of FWLD (ms) –3.2-0.6 –0.6-4.0 –3.4-5.9 –1.7-7.1 –0.3-9.0 –0.3-17.8 –3.4-17.8
Sensitivity of FWLD – 56% 61.7% 82% 94% 95.5% 69.6%
Mean FWRa (ms) 0.97 ± 0.02 1.04 ± 0.04b 1.04 ± 0.06b 1.11 ± 0.07c 1.14 ± 0.09c 1.32 ± 0.18 1.08 ± 0.11
Range of FWR (ms) 0.88-1.02 0.98-1.15 0.88-1.28 0.94-1.26 0.99-1.38 1.01-1.77 0.88-1.77
Sensitivity of FWR – 80% 72.5% 95.9% 97.9% 100% 81.7%
ANOVA was used to compare differences in FWLD and FWR among control and patient subgroups divided by Canterbury grading scale.
FWLD, F-wave latency differences; FWR, F-wave ratio.
aEach value represents mean ± standard deviation.
bVariables that did not differ significantly were marked.
CVariables that did not differ significantly were marked.
< 0.001). In the control group, mean ulnar F-wave minimal latency (FWML) was significantly prolonged compared to mean median FWML (p < 0.0001). A scatter plot of median versus ulnar FWMLs in both the control and CTS groups is included in Fig. 1.
FWLD
In the control group, mean FWLD was –0.65 ± 0.64 msec.
Based on the mean value and standard deviation, a positive
F-wave inversion test was defined as FWLD of 0.63 msec or higher.
Of 339 hands in the CTS group, 236 hands met criteria for F-wave inversion (sensitivity of 69.6%). Mean FWLDs were significantly larger in the patient group compared to the control group (p < 0.001). In addition, there were significant differences among the control group and CTS subgroups further divided according to Canterbury grading (p < 0.001).
However, there were no differences between patients with Canterbury grades 1 and 2 and between grades 3 and 4 (Table 1). The FWLD had significant correlation with height (r = –0.230, p < 0.001) and disease severity according to Can- terbury grading (r = 0.683, p < 0.001) (Fig. 2). There was no significant correlation with age.
FWR
The mean FWR of the control group was 0.97 ± 0.02. The FWR range was 0.88 to 1.02. Based on these values, positive FWR inversion was defined as a FWR of 1.01 or higher. Of 339 hands in the CTS group, 277 met criteria for F-wave in- version (sensitivity of 81.7%). FWRs were significantly higher in the patient group compared to the control group (p <
0.001). Comparison of FWRs among the control group and each patient subgroup also showed significant differences (p < 0.001), except for between subgroups of grades 1 and 2 and grades 3 and 4 (Table 1). FWR had significant correla- tion with height (r = –0.250, p < 0.001) and disease severity according to Canterbury grading (r = 0.674, p < 0.001) (Fig. 2).
There was no significant correlation with age.
DISCUSSION
The utility of median FWML, FWLD, and FWRin diagnosing CTS is not established. In 1994, Kuntzer published a study in which the sensitivities and specificities of multiple neu- rophysiologic parameters, including FWML, were analyzed in 100 patients with CTS.15 F-wave abnormalities were highly sensitive, but had low specificity for CTS. The appli- cation of F-waves in diagnosing CTS was again addressed by two studies published in the late 1990’s. These studies were based on the fact that the ulnar nerve follows a more convoluted path than the median nerve and therefore has longer latency than the median nerve in most normal peo- Fig. 1. Scatter plot of median versus ulnar F-waves. Scatter plot of medi-
an versus ulnar FWMLs in both control and CTS groups. Median FWML (MFL) was prolonged compared to ulnar FWML (UFL) in the CTS group (round). In the control group, however, UFL was significantly prolonged compared to MFL (square). CTS, carpal tunnel syndrome; FWML, F-wave minimal latency; MFL, median F-wave minimal latency; UFL, ulnar F-wave minimal latency.
Table 2. Comparison between controls and patients Controls
(n = 60)
Patients
(n = 339) p-value
Male (%) 28.3 30 NS
Mean agea 57.3 ± 5.6 59.9 ± 10.0 NS
Mean heighta (cm) 160.4 ± 6.9 158.7 ± 6.4 NS Mean median F wavea (ms) 24.7 ± 1.5 27.8 ± 2.6 < 0.0001 Mean ulnar F wavea (ms) 25.3 ± 1.6 25.8 ± 2.2 NS NS, non significant.
aEach value represents mean ± standard deviation.
ple. In 1997, Menkes et al.9 performed a prospective study in which F-waves and other nerve conduction studies were performed on 57 patients with CTS and compared with 30 normal controls. The diagnosis of CTS was based on clini- cal symptoms and palm-to-wrist mixed nerve conduction studies. The study data revealed that median F-wave laten- cy never exceeded ulnar F-wave latency by more than 0.5 msec in the control population. Setting the upper limit of normal as 2.5 standard deviations above the mean resulted in a cutoff value for F-wave minimal latency difference at approximately 1 msec. Studies in which the F-wave minimal latency difference exceeded this cutoff were called “F-wave inversions.” These were identified in 72 of 95 hands with CTS compared to 30 of 60 control hands. While the sensi- tivity of this study was still inferior to that of palm-to-wrist mixed-nerve conduction studies, it was comparable to other electrodiagnostic measurements collected, including or- thodromic median sensory studies, median terminal motor latencies, and the finding of fibrillation potentials in the APB.
A similar study by Sander et al.6 in 1998 prospectively eval- uated 50 patients compared to 34 normal controls using a comparable methodology and found the F-wave inversion test to have sensitivity of 75-78%. In this case, the abnormal cutoff for F-wave latency difference was identified as 0.6 msec. The significant difference in cutoff values was primar- ily attributed to technical factors such as filter settings and gains.
Ceviket al.10recently reported that a cut off value of 1 msec for F-wave differences from the median nerve to the ulnar nerve is a reliable test to detect CTS in the early stage for patients who do not have evidence of CTS in conven- tional NCS. However, sensitivity was as low as 53.3%. Aygül et al.11 also reported the usefulness of F-wave parameters, in- cluding amplitude, frequency, velocity, and amplitude ratio, compared to M-waves to discriminate CTS severity through a study with 57 patients and 31 control subjects. The CTS patients showed prolonged F-wave latencies, decreased fre- quencies, and increased chronodispersion compared with control values. However, Mondelli and Aretini16 reported that the F-wave was less sensitive than conventional nerve conduction study and did not have any further useful in- formation related to CTS. The purpose of the current study was to evaluate the sensitivity of the most common F-wave parameters, including FWLD and FWR, according to CTS se- verity.
The results of the present study ultimately support the utility of F-wave inversion in diagnosis of CTS. The sensitivity of F-wave inversion, using the 2 indexes of FWLD and FWR, found in this analysis was comparable to that of previous studies describing this phenomenon. The sensitivity of F-wave inversion is comparable to that of other standard electrophysiologic guidelines with pooled sensitivities of 50- 85%.17 Moreover, our study showed that F-wave inversion in CTS with Canterbury grading scale 3 or higher showed a Fig. 2. F-wave latency differences (FWLD) and F wave ratio (FWR) based on Canterbury score. FWLD and FWR correlated significantly with disease se- verity according to Canterbury grading (r = 0.683, p < 0.001; r = 0.674, p < 0.001, respectively).
higher sensitivity than conventional electrophysiologic tests.
Patients were divided into subgroups based on nerve conduction study results using Canterbury grading because electrophysiological findings are more valuable in diagnosis.
However, the grading scale has some limitations. Bland14 re- ported that grading is uncertain because of motor terminal latency > 6.5 msec with a normal SNAP or an absent SNAP with normal motor conduction. The terminal latency of mo- tor NCS is 6.5 msec for differentiating grade 4 from grade 5 was based on the personal impression of the authors, not on any scientific evidence.
F-waves are primarily reflective of motor nerve function. In cases where only sensory studies are abnormal (usually an indication of conservative management), a finding of F-wave inversion may lead to further studies (such as electromy- ography of the abductor pollicis brevis), closer follow-up, or more aggressive intervention. F-wave study in addition to conventional nerve conduction study will provide more useful information about the severity and subtypes of CTS.
There is no apparent surgical indication of CTS at this time.
According to severity and subtype of CTS, surgical release of the median nerve must be considered to prevent irrevers- ible changes. This is why F-wave studies are important.
However, it is important to clearly delineate the limitations of F-wave inversion in assessing CTS. F-waves reflect the con- ductive integrity of the entire median nerve, and abnormal F-wave measurements cannot be attributed to a lesion at the wrist without further confirmatory studies. Furthermore, the test cannot be used in individuals with concomitant ip- silateral ulnar neuropathy or a median nerve lesion proximal to the carpal tunnel. If cervical radiculopathy, plexopathy, or polyneuropathy are clinically suspected, the F-wave cannot be applied. Interpretation of F-wave latency data also be- comes more difficult in studies where CTS patients are iden- tified using electrodiagnostic criteria. In the Menkes study, patients with CTS were selected based on abnormal palm- to-wrist mixed nerve studies. As such, the sensitivity of the F-wave inversion test cannot be fairly compared to the gold standard. Our analysis also used electrodiagnostic criteria to define CTS, but the diagnosis of CTS was based on clinical criteria, including symptomatology, examination findings, positive Phalen’s maneuver, and Tinel’s sign.
We found that the F-wave inversion test is a sensitive tech- nique that allows prediction of CTS before full electrodiagnos-
tic tests in Canterbury grading scale 3 or more. It is also helpful for deciding suitable management because it reflects disease severity and motor function. Although we did not enroll pa- tients with polyneuropathy, F-wave inversion would be useful in diagnosing CTS patients with polyneuropathy. A future prospective study using an independent gold standard, such as one based solely on clinical criteria prior to electrodiagnos- tic studies, would be of greatest value in comparing F-wave parameters to other nerve conduction studies.
Acknowledgements
This work was supported by a National Research Foundation of Korea (NRF) grant funded by the Korean Government (MSIP; No. NRF-2015R1A5A7037674). We would like to thank our colleagues in the Department of Neurology, Korea Uni- versity Medical Center for their enthusiastic assistance.
REFERENCES
1. Atroshi I, Gummesson C, Johnsson R, Ornstein E, Ranstam J, Rosén I. Prevalence of carpal tunnel syndrome in a general pop- ulation. JAMA 1999;282:153-158.
2. Silverstein BA, Fine LJ, Armstrong TJ. Occupational factors and carpal tunnel syndrome. Am J Ind Med 1987;11:343-358.
3. de Krom MC, Kester AD, Knipschild PG, Spaans F. Risk factors for carpal tunnel syndrome. Am J Epidemiol 1990;132:1102-1110.
4. D'Arcy CA, McGee S. The rational clinical examination. Does this patient have carpal tunnel syndrome? JAMA 2000;283:3110- 3117.
5. American Association of Electrodiagnostic Medicine, American Academy of Neurology, and American Academy of Physical Medicine and Rehabilitation. Practice parameter for electrodiag- nostic studies in carpal tunnel syndrome: summary statement.
Muscle Nerve 2002;25:918-922.
6. Sander HW, Quinto C, Saadeh PB, Chokroverty S. Sensitive me- dian-ulnar motor comparative techniques in carpal tunnel syn- drome. Muscle Nerve 1999;22:88-98.
7. Werner RA, Andary M. Electrodiagnostic evaluation of carpal tun- nel syndrome. Muscle Nerve 2011;44:597-607.
8. Robinson LR, Micklesen PJ, Wang L. Strategies for analyzing nerve conduction data: superiority of a summary index over single tests. Muscle Nerve 1998;21:1166-1171.
9. Menkes DL, Hood DC, Bush AC. Inversion of the F-waves in medi-
an neuropathy at the wrist (carpal tunnel syndrome): an adjunc- tive electrodiagnostic method. J Contemp Neurol 1997;1:1-10.
10. Cevik MU, Altun Y, Uzar E, Acar A, Yucel Y, Arikanoglu A, et al. Di- agnostic value of F-wave inversion in patients with early carpal tunnel syndrome. Neurosci Lett 2012;508:110-113.
11. Aygül R, Kotan D, Ulvi H, Kuyucu M, Özdemir G, Ertekin A, et al.
The relationship of median nerve F-wave parameters with sever- ity and subtypes of carpal tunnel syndrome. J Back Musculoskel- et Rehabil 2014;27:1-6.
12. Park KM, Shin KJ, Park J, Ha SY, Kim SE. The usefulness of terminal latency index of median nerve and f-wave difference between median and ulnar nerves in assessing the severity of carpal tun- nel syndrome. J Clin Neurophysiol 2014;31:162-168.
13. Alemdar M. Value of F-wave studies on the electrodiagnosis of carpal tunnel syndrome. Neuropsychiatr Dis Treat 2015;11:2279- 2286.
14. Bland JD. A neurophysiological grading scale for carpal tunnel syndrome. Muscle Nerve 2000;23:1280-1283.
15. Kuntzer T. Carpal tunnel syndrome in 100 patients: sensitivity, specificity of multi-neurophysiological procedures and estima- tion of axonal loss of motor, sensory and sympathetic median nerve fibers. J Neurol Sci 1994;127:221-229.
16. Mondelli M, Aretini A. Low sensitivity of F-wave in the electro- diagnosis of carpal tunnel syndrome. J Electromyogr Kinesiol 2015;25:247-252.
17. Jablecki CK, Andary MT, Floeter MK, Miller RG, Quartly CA, Vennix MJ, et al. Practice parameter: electrodiagnostic studies in carpal tunnel syndrome. Report of the American Association of Elec- trodiagnostic Medicine, American Academy of Neurology, and the American Academy of Physical Medicine and Rehabilitation.
Neurology 2002;58:1589-1592.