Effect of Different Zeolite Supported Bifunctional Catalysts for Hydrodeoxygenation of Waste Wood Bio-oil 1
Shinyoung Oh
2⋅Sye-Hee Ahn
3⋅Joon Weon Choi
2,4,†ABSTRACT
1)Effects of various types of zeolite on the catalytic performance of hydrodeoxygenation (HDO) of bio-oil obtained from waste larch wood pyrolysis were investigated herein. Bifunctional catalysts were prepared via wet impregnation.
The catalysts were characterized through XRD, BET, and SEM. Experimental results demonstrated that HDO enhanced the fuel properties of waste wood bio-oil, such as higher heating values (HHV) (20.4–28.3 MJ/kg) than bio-oil (13.7 MJ/kg). Water content (from 19.3 in bio-oil to 3.1–16.6 wt% in heavy oils), the total acid number (from 150 in bio-oil to 28–77 mg KOH/g oil in heavy oils), and viscosity (from 103 in bio-oil to 40–69 mm2/s in heavy oils) also improved post HDO. In our experiments, depending on the zeolite support, NiFe/HBeta exhibited a high Si/Al ratio of 38 with a high specific surface area (545.1 m2/g), and, based on the yield of heavy oil (18.3–18.9 wt%) and HHV (22.4–25.2 MJ/kg), its performance was not significantly affected by temperature and solvent concentration variations. In contrast, NiFe/zeolite Y, which had a low Si/Al ratio of 5.2, exhibited the highest improved quality for heavy oil at high temperature, with an HHV of 28.3 MJ/kg at 350 °C with 25 wt% of solvent.
Keywords: bio-oil, hydrodeoxygenation, waste wood, bifunctional catalyst, zeolite
1. INTRODUCTION
For the recent decades processes of biomass con- version into renewable fuels has been attracting much attention due to decreasing of crude-oil reserves, en- hanced demand for fuels worldwide and increased climate concerns about the use of fossil-based energy carriers (Zhang et al., 2015; Kim 2016; Prajitno et al., 2016; Chiaramonti et al., 2017; Zhang et al., 2018).
In contrast to fossil fuel reserves, biomass is indicated as an abundant, sustainable and carbon-neutral re- newable energy resource for the production of biofuels and valuable chemicals.
In particular, Korea is the world's 10th largest emitter of carbon dioxide and should be reducing greenhouse gas emissions from 2013. According to the Korea Wood recycling association, the production of waste wood in Korea is about 5 million ton, and the waste from
1Date Received February 19, 2019, Date Accepted May 13, 2019
2Institute of Green-Bio Science and Technology, Pyeongchang, Gangwon-do 25354, Seoul National University, Republic of Korea
3Department of Forest Resources, Daegu University, Gyeongsan 52828, Republic of Korea
4Graduate School of International Agricultural Technology, Pyeongchang, Gangwon-do 25354, Seoul National University, Republic of Korea
†Corresponding author: Joon Weon Choi (e-mail: [email protected], ORCID: 0000-0002-9454-0475) Original Article
afforestation is the highest amount, 48% in 2005. The amount of waste wood decreased to 2 million ton in 2016, and 66% those waste wood is recycled, as charcoal or combustion in combined heat and power (CHP) system. The Korea ministry of environment established the law related to waste-to-energy and biomass-to- energy in 2009, and the Renewable Energy Portfolio Standard (RPS) was enforced from 2012.
Larch (Larix kaempferi) forests are the dominant forest type through northeastern Asia to central Siberia.
The net ecosystem production (NEP) of a larch forest has been routinely measured by the eddy covariance method at the Tomakomai flux site since the autumn of 2000 (Hirano et al., 2003). In Hokkaido, Japan, larch plantations (470,000 ha) account for about one third of all forests, because of their high productivity (Liang
et al., 2004).Fast pyrolysis technology is commonly used for the biomass conversion into liquid products, referred to as bio-oil. The bio-oil composition depends on the type of feedstock (biomass) and the pyrolysis conditions (Bridgwater, 2012). However, the high content of oxygen usually leads to disadvantageous fuel features, like high viscosity, thermal and storage instability, corrosiveness, poor heating value and immiscibility (Wen et al., 2014; Long et al., 2015; Moon et al., 2016; Lee et al., 2016; Prajitno et al., 2016; Zhang
et al., 2018) and makes it complicated for direct use(Lu et al., 2009). The key reaction of this process is the hydrogenolysis of C-O bonds (hydrodeoxygenation) of oxygen-containing compounds with the formation of water (Choudhary 2011; Mortensen et al., 2011).
Early work indicated that conventional hydro- desulphurization (HDS)/hydrodenitrogenation (HDN) catalysts exhibit promising activity in hydrodeoxy- genation (HDO) of phenolic compounds such as phenol, anisole, and guaiacol (Bredenberg et al., 1982; Laurent
et al., 1994b; Centeno et al., 1995; Ferrari et al., 2001;Buiet al., 2011a). However, these metal–sulfide catalysts
suffer from deactivation in the presence of high water content and the continuous addition of sulfur is required in the reactant stream to maintain the catalysts in the sulfide form. This last factor in particular can cause serious problems for the downstream processes (Laurent 1994a; Ferrari et al., 2001; Zakzeski et al., 2010).
Alternative hydrotreating catalysts have been sought for bio-oil upgrading (Elliott 2008; Wildschut et al., 2009; Zakzeski et al., 2010; González-Borja 2011;
Nimmanwudipong et al., 2011b; Zhao et al., 2011; Zhu
et al., 2011). Recently, Gates’ group compared Pt/Al2O
3and Pt/HY catalysts in the HDO of anisole and guaiacol. Their results showed that the transalkylation activity of the catalyst was significantly affected by the type of acidic site (Nimmanwudipong et al., 2011a;
Nimmanwudipong et al., 2012). A later study by Zhu et al. further confirmed the effect of acidic sites on the transalkylation activity in the HDO of anisole (Zhu
et al., 2011). A very recent report indicates that Fe/SiO2shows a higher hydrodeoxygenation activity without saturation of aromatic ring in the guaiacol conversion (Olcese et al., 2012). While the transalkylationactivity of the acidic catalyst offers a way to preserve the car- bon from being lost as a gas product, the presence of acidic sites interacts strongly with the phenolic compounds, resulting in rapid catalyst deactivation by coking (Centeno et al., 1995; Huber et al., 2006) Moreover, bifunctional catalysts comprised by active metal and solid acid exhibits excellent activity for HDO reaction. Support material is also thekey factor deter- mining the catalytic performance as well as active metal.
ã -Al
2O
3, which was widely used for HDO due to cheap cost, excellent texture and suitable acidity, showed excellent HDO activity in the HDO of phenolic compounds (Bui et al., 2011b; Zhang et al., 2013), occurred high amount of coke formation as well as boehmite resulting decrease the catalytic activity.
Therefore, finding the suitable catalysts to overcome
those drawbacks is conducted in numerous studies. For
example, Ni/HZSM-5, Pt/HZSM-5, Ru/HBeta and Pt/HBeta could effectively transformed guaiacol into hydrocarbons (Zhu et al., 2011; Zhao 2012; Ohta et
al., 2015; Yao et al., 2015; Zhanget al., 2018).Here, we describe the preparation and reactivity for a series of bifunctional catalysts for the HDO of waste wood bio-oil. Especially, effect of support zeolite with NiFe bimetallic catalysts on the heavy oil products after HDO process will be investigated by analyzing catalysts and product features.
2. MATERIALS and METHODS 2.1. Preparation and characterization of
NiFe bimetallic catalysts
2.1.1. Preparation of the catalysts
Catalytically active transition metal sites (Ni and Fe) were added by means of a wet impregnation method (Yakovlev et al., 2009; Ardiyanti et al., 2012). Equal amounts of nitrate-form transition metal (Ni and Fe) solution and three zeolite supportswere stirred for 1 h. After the mixture was homogenized, it was dried overnight at 80 °C and calcined in air at 550 °C for 3 h to obtain NiFe/HBeta, NiFe/ZSM-5 and NiFe/Zeolite Y. The catalysts were reduced at 500 °C for 3 h under an H
2atmosphere before use. Two commercial catalysts (CoMo/Al
2O
3and NiMo/Al
2O
3) were also performed HDO reaction to compare the activity.
2.1.2. BET specific surface area
The specific surface areas of the support and catalysts were measured by means of a Brunauer–Emmett–Teller (BET) method, and the pore distributions and cumulative pore volumes were calculated by means of the Barret–Joyner–Halenda (BJH) method, based upon the desorption branches of the N
2isotherms measured at 77 K. Samples were degassed at 523 K for 4 h before these tests.
2.1.3. Crystallinity of transition metal active sites
X-ray powder diffraction patterns (XRD) were acquired using a Bruker D8 Advance with a Cu Kα radiation source (λ = 1.5418 Å), operated at 40 kV and 40 mA with the scan speed of 0.5 °/min over the range 10–70 ° (2θ).
2.1.4. Degree of metal dispersion on three zeolite supports by SEM
The morphology of each of the catalysts was investigated by means of FE-SEM (field-emission scanning electron microscopy, AUGIRA).
2.2. Batch type hydrodeoxygenation of bio-oil from Larch
Bio-oil obtained from fast pyrolysis of waste wood was offered from Yonsei University. A stainless steel reactor equipped with a thermocouple, a pressure sensor, and a system for controlling the temperature and pressure was used as the test chamber. 4 wt%
of the reduced catalysts were added to a mixture of bio-oil and ethanol and then placed into the sealed reactor and flushed with N
2. The reactor was then pressurized to 3 MPa H
2, and the temperature was increased to the reaction temperature (300, 350, or 400
°C) (Laurent 1994b; Ferrari et al., 2001). The ethanol concentration varied 25, 10, and 5 wt% in the mixture.
Three zeolite supportedcatalyst (NiFe/HBeta, NiFe/
ZSM-5 and NiFe/ Zeolite Y) and two commercial catalysts (CoMo/Al
2O
3and NiMo/Al
2O
3) were per- formed HDO reaction to test the activity. After the reaction, three phases of four products were obtained:
liquid (immiscible light oil and lower heavy oil), char,
and gas. The upper solvent-based water-rich light oil
and lower organic heavy oil were recovered after the
reaction and separated using a separatory funnel. The
yields of char, light oil and heavy oil were calculated
according to the following equations.
Yield of char (%)
= [Solid (g) − Catalyst (g)] / [Bio-oil (g) + Ethanol (g)] × 100
Yield of light oil (%)
= [Light oil (g)] / [Bio-oil (g) + Ethanol (g)]
× 100
Yield of heavy oil (%)
= [Heavy oil (g)] / [Bio-oil (g) + Ethanol (g)] × 100
Yield of gas (%)
= 100 − [Yield of light oil + Yield of heavy oil + Yield of char]
2.3. Measuring fuel quality of heavy oil obtained from HDO
2.3.1. Physicochemical properties
To measure the water content and acidity (total acid number, TAN) of the bio-oil and heavy oils, Karl Fischer titration and ASTM D664 TAN testing were performed.
Each sample was analyzed three times; values reported in tables herein represent the averages of the triplicate analyses. Viscosities were determined at 20 °C using a VIBRO viscometer (AND, Japan). The higher heating value (HHV) was calculated according to the following equation (Friedl et al., 2005):
HHV/(J/kg) = 3.55 x [C]
2-232x[C]-2230x[H]
+51.2x[H]x[C]+131x[N]+20,600
where [C], [H], and [N] are the mass% of carbon, hydrogen, and nitrogen on dry basis, respectively. The results were corrected for the water content of the oil.
Atomic O/C and H/C were calculated to compare the hydrogenation and deoxygenation degree of each heavy oil; the degree of deoxygenation (DOD) was estimated as follows.
Degree of deoxygenation (%)
= (MO
bio-oil−MO
heavyoil)/MO
bio-oil×100
Here, MO
heavy oiland MO
bio-oilare the molar oxygen/
carbon ratios of heavy oil and bio-oil.
2.3.2. GC/MS analysis of low molecular compounds
For measuring low-molecular-weight compounds in bio-oil and heavy oils qualitatively and quantitatively, GC/MS analysis was performed with fluoranthene as an internal standard. The analysis was conducted with an Agilent 7890B coupled with a 5975C mass selective detector (MSD) and a flame ionization detector (FID) equipped with a DB-5 capillary column (60 m × 0.25 mm × 0.25 μm). The oven temperature was maintained at 50 °C for 5 min, followed by heating at a rate of 3 °C/min to 280 °C and holding for 20 min. The injector and FID detector temperatures were 250 and 300 °C, respectively.
3. RESULTS and DISCUSSION
3.1. Synthesis of bifunctional catalysts 3.1.1. Physical properties of the supports and
bifunctional catalysts
Table 1 presents the physical properties of the catalysts used in this study. The specific surface areas of NiFe/zeolite Y, NiFe/HBeta, and NiFe/ZSM-5 were 532.2, 545.1 and 316.5 m
2/g, while the pores volumes were 0.3, 0.3 and 0.2 cm
3/g, respectively. These values were lower than the supports themselves, which might be due to the metal loading (about 5 wt.%). As shown in Fig. 1, zeolite supports were mono-layer support with micro-pores (Lippens 1965). Isothermal type of the supports presented that the zeolite supports have tubular with short necks, wide sloping bodies or various widths and the shape of pores remained after the metal impregnation. However, CoMo/Al
2O
3and NiMo/Al
2O
3were not clearly defined their pore type, since they
presented type Ⅲ physisorption isotherm, which meant
Sample SiO2/Al2O3
Mole Ratioa
SBETb
(m2/g)
Vtc
(cm3/g)
Vmicd
(cm3/g)
Vmeso
(cm3/g)
Dave
(Å)
Zeolite Y 5.2 697.4 0.4 0.3 0.1 2.1
HBeta 38 572.1 0.3 0.2 0.1 2.2
ZSM-5 23 354.9 0.2 0.1 0.1 2.1
NiFe/zeolite Y 5.2 532.2 0.3 0.2 0.1 2.3
NiFe/HBeta 38 545.1 0.3 0.2 0.1 2.4
NiFe/ZSM-5 23 316.5 0.2 0.1 0.1 2.4
a: Offered from the zeolyst company
b: Calculated by the BET method
c: The total pore volume was obtained at a relative pressure of 0.99
d: Calculated using the t-plot method
Table 1. Characterization of supports and bifunctional catalysts
0 50 100 150 200 250 300 350 400
0.0 0.1 0.2 0.3 0.4 0.5 0.6 0.7 0.8 0.9 1.0
Specific Volume (cm3/g)
Relative pressure (P/P0)
CoMo/Al2O3 NiMo/Al2O3 Zeolite β NiFe/Zeolite β Zeolite Y
Fig. 1. Chemisorption features of the catalysts and supports.
weak adsorption interaction, and didn’t match the hysteresis loops. Therefore, Zeolite supported bifunc- tional catalysts (NiFe/zeolite Y, NiFe/HBeta, and NiFe/
ZSM-5), with a high specific surface area and large pore, was expected to be effective for good dispersionof the reactant during the reaction. Compared with the zeolites and metal doped bifunctional catalysts, the pore diameter showed increase. It might be due to the crack of the pore during impregnation step (Munniket al., 2015).
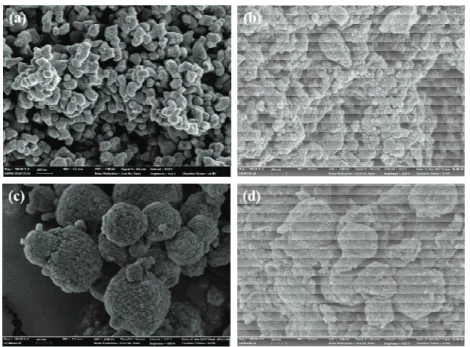
3.1.2. The morphologies of the supports and Ni catalysts
The morphologies of the catalysts were investigated
by SEM (Fig. 2). Commercial CoMo/Al
2O
3and
NiMo/Al
2O
3showed smaller particles than prepared
NiFe-based catalysts. Moreover, according to Fig. 2
(c)-(e), zeolite supports presented different particle
shapes, despite their pore type (shape) and size were
similar (Fig. 1 and Table 1). NiFe/ZSM-5, which has
lower specific surface area (316.5 m
2/g) than other
Fig. 2. SEM images of the prepared catalysts: (a) NiMo/Al
2O
3; (b) CoMo/Al
2O
3; (c) NiFe/HBeta;
(d) NiFe/Zeolite Y; (e) NiFe/ZSM-5.
Fig. 3. Surface morphology of fresh and used catalysts: (a) fresh NiMo/Al
2O
3; (b) used NiMo/Al
2O
3; (c) fresh NiFe/HBeta; (d) used NiFe/HBeta.
zeolite supported bifunctional catalysts (ranged between 532.2 to 545.1 m
2/g) has rectangular large particles.
While in Fig. 3, the catalysts were lost its original
shape after the reaction. Some reactant and produced
coke were deposited on the catalyst surface. It might
deactivate the catalyst activity.
3.1.3. XRD patterns of the Ni catalysts The impregnation of NiFe over the zeolite supports led to the formation of bifunctional catalysts (NiFe/
zeolite Y, NiFe/HBeta, and NiFe/ZSM-5) as well as led to the formation of metal oxide on the surface contained slight amount of crystalline aggregation as evidenced from the phase formation in the high angle XRD.
Fig. 4 presents the XRD peaks of CoMo/Al
2O
3, NiMo/Al
2O
3, NiFe/zeolite Y, NiFe/HBeta, and NiFe/
ZSM-5. CoMo/Al
2O
3and NiMo/Al
2O
3presented three typical metal oxide peaks at 2θ = 26° and 53°, with Al
2O
3support peaks at 2θ = 41° and 68°. Compared to Al
2O
3supports, zeolites peaks detected in lower angle, such as 2θ =6-8° and 16° (Zhang et al., 2012; Hunter
et al., 2016). Moreover, differed zeolite resulted indifferent metal oxide forms; mainly consist of NiFe
2O
4in NiFe/zeolite Y while NiAl
2O
4and Fe
2O
3in NiFe/
ZSM-5.
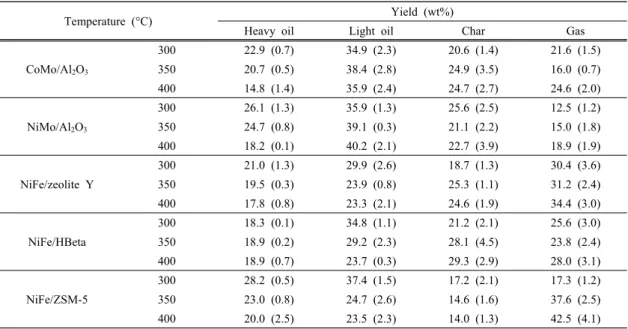
3.2. Catalytic activity
To test and compare the HDO activity of catalysts,
HDO of waste wood bio-oil was conducted with those
catalysts. The bio-oil was converted and produced heavy
oil, light oil, char and gas. The yields of the HDO
products obtained with different temperature and solvent
concentration are shown in Tables 2-3 based on the
weight of the bio-oil. The yield of each product revealed
that the composition of the HDO products was
considerably affected by the zeolite supports. Compared
the data from three different supports (NiFe/HBeta,
NiFe/zeolite Y and NiFe/ZSM-5), HBeta support
showed thermally stable features according to the heavy
oil yield from 300 to 400 °C (18.3-18.9 wt%). However,
the char and gas strikingly increased with temperature,
which meant both further decomposition by temperature
and catalyst deactivation by coke deposition on surface
are accelerated. Both NiFe/zeolite Y and NiFe/ZSM-5
showed the tendency of decrease heavy oil and light
Fig. 4. XRD peaks of the catalysts.
Temperature (°C) Yield (wt%)
Heavy oil Light oil Char Gas
CoMo/Al2O3
300 22.9 (0.7) 34.9 (2.3) 20.6 (1.4) 21.6 (1.5)
350 20.7 (0.5) 38.4 (2.8) 24.9 (3.5) 16.0 (0.7)
400 14.8 (1.4) 35.9 (2.4) 24.7 (2.7) 24.6 (2.0)
NiMo/Al2O3
300 26.1 (1.3) 35.9 (1.3) 25.6 (2.5) 12.5 (1.2)
350 24.7 (0.8) 39.1 (0.3) 21.1 (2.2) 15.0 (1.8)
400 18.2 (0.1) 40.2 (2.1) 22.7 (3.9) 18.9 (1.9)
NiFe/zeolite Y
300 21.0 (1.3) 29.9 (2.6) 18.7 (1.3) 30.4 (3.6)
350 19.5 (0.3) 23.9 (0.8) 25.3 (1.1) 31.2 (2.4)
400 17.8 (0.8) 23.3 (2.1) 24.6 (1.9) 34.4 (3.0)
NiFe/HBeta
300 18.3 (0.1) 34.8 (1.1) 21.2 (2.1) 25.6 (3.0)
350 18.9 (0.2) 29.2 (2.3) 28.1 (4.5) 23.8 (2.4)
400 18.9 (0.7) 23.7 (0.3) 29.3 (2.9) 28.0 (3.1)
NiFe/ZSM-5
300 28.2 (0.5) 37.4 (1.5) 17.2 (2.1) 17.3 (1.2)
350 23.0 (0.8) 24.7 (2.6) 14.6 (1.6) 37.6 (2.5)
400 20.0 (2.5) 23.5 (2.3) 14.0 (1.3) 42.5 (4.1)
Table 2. Mass balance of main products with different HDO temperature (25 wt% of ethanol)
Temperature (°C) Yield (wt%)
Heavy oil Light oil Char Gas
CoMo/Al2O3
25 20.7 (0.2) 28.4 (2.1) 24.9 (1.1) 26.0 (2.7)
10 17.5 (1.6) 25.8 (1.3) 28.7 (1.4) 28.0 (2.5)
5 18.4 (1.1) 20.9 (2.7) 37.1 (0.4) 23.6 (1.8)
NiMo/Al2O3
25 24.7 (0.4) 29.1 (2.8) 21.9 (1.6) 24.2 (1.7)
10 22.3 (1.9) 26.7 (3.6) 30.5 (1.3) 20.5 (1.3)
5 20.8 (0.6) 21.2 (1.7) 30.8 (2.9) 27.2 (2.6)
NiFe/zeolite Y
25 19.5 (0.7) 23.9 (1.7) 25.3 (2.1) 31.2 (1.7)
10 17.5 (0.9) 29.0 (2.1) 28.6 (1.0) 25.0 (2.2)
5 19.9 (1.3) 22.8 (0.8) 30.9 (1.3) 26.4 (3.6)
NiFe/HBeta
25 18.9 (1.0) 29.2 (0.4) 28.1 (0.9) 23.8 (2.1)
10 18.3 (0.8) 30.5 (1.0) 30.4 (1.6) 20.8 (2.5)
5 18.3 (0.1) 30.0 (1.9) 31.5 (2.1) 20.2 (2.4)
NiFe/ZSM-5
25 23.0 (1.5) 24.7 (1.5) 14.6 (2.1) 37.6 (2.0)
10 19.3 (2.2) 25.3 (1.7) 15.8 (0.2) 39.5 (1.1)
5 14.3 (1.9) 27.4 (2.1) 23.6 (1.8) 34.7 (1.4)
Table 3. Mass balance of main products with different ethanol concentration (under 350 °C)
oil and strikingly increase in gas, while the char decrease in NiFe/ZSM-5 and increase in NiFe/zeolite Y. While the NiFe/HBeta, which has high specific surface area with high Si/Al ratio (Table 1), showed
similar products yield with varied reaction conditions
(Tables 2-3). According to the results, it is suggested
that the catalyst high Si/Al ratio could inhibit the
catalyst deactivation.
In case of commercial CoMo/Al
2O
3and NiMo/Al
2O
3, the gas yield (12.5-21.6 wt%) is lower than that from zeolite supported bifunctional catalysts (17.3-42.5 wt%) with similar yield of heavy oil. It is suggested that these CoMo/Al
2O
3and NiMo/Al
2O
3catalysts deacti- vated less than NiFe/zeolite Y, NiFe/HBeta, and NiFe/
ZSM-5, which prevented that the further decomposition by the temperature.
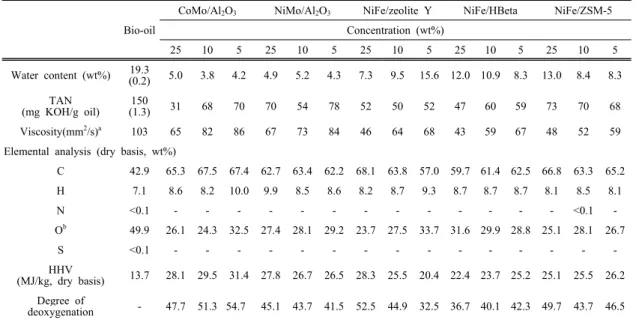
As shown in Table 3, the heavy oil yielded less in lower concentration of ethanol. Since the waste wood bio-oil itself was too sticky (103 mm
2/s, Tables 4-5), it produced huge amount of sticky tar-like char (14.6- 37.1 wt%). Also, these were affected by the particle size and specific surface area (Table 1). Small particle size with large specific surface area led frequent efficient collision, but in the batch type reactor, sticky feature of the bio-oil might not let the catalysts regenerated.
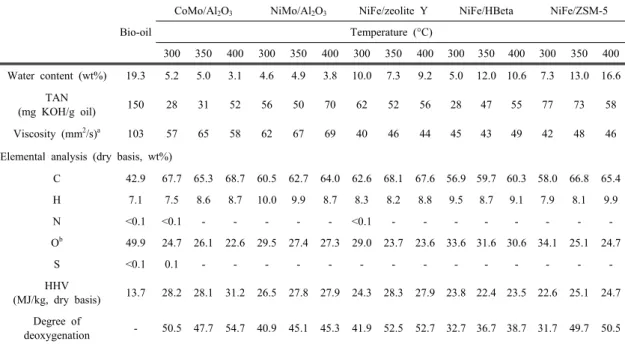
3.3. Fuel properties of heavy oil
3.3.1. Physicochemical features of heavy oil Typical fuel properties, such as acidity, heating value, and thermal stability, are improved in heavy oil after HDO via hydrocracking, hydrogenolysis, dehydration, hydrogenation and deoxygenation (Furimsky et al., 1986). Therefore, several improved physicochemical properties of heavy oil were measured and are displayed in Tables 4-5. The water content, which is major feature related to the heating value and combustion properties in the engine, is 19.3% in the waste wood bio-oil and decreased to 3.1-16.6 wt% in the heavy oils, via dehydration of the organic phase. Since the metal site of commercial catalysts, involved in dehydration well remained H
2-reduced state, CoMo/ Al
2O
3and NiMo/
Al
2O
3worked better than prepared bifunctional catalysts (even though the zeolites are known as good at dehydration). The zeolites with high acidity (also
Bio-oil
CoMo/Al2O3 NiMo/Al2O3 NiFe/zeolite Y NiFe/HBeta NiFe/ZSM-5 Temperature (°C)
300 350 400 300 350 400 300 350 400 300 350 400 300 350 400 Water content (wt%) 19.3 5.2 5.0 3.1 4.6 4.9 3.8 10.0 7.3 9.2 5.0 12.0 10.6 7.3 13.0 16.6
TAN
(mg KOH/g oil) 150 28 31 52 56 50 70 62 52 56 28 47 55 77 73 58
Viscosity (mm2/s)a 103 57 65 58 62 67 69 40 46 44 45 43 49 42 48 46
Elemental analysis (dry basis, wt%)
C 42.9 67.7 65.3 68.7 60.5 62.7 64.0 62.6 68.1 67.6 56.9 59.7 60.3 58.0 66.8 65.4
H 7.1 7.5 8.6 8.7 10.0 9.9 8.7 8.3 8.2 8.8 9.5 8.7 9.1 7.9 8.1 9.9
N <0.1 <0.1 - - - <0.1 - - - -
Ob 49.9 24.7 26.1 22.6 29.5 27.4 27.3 29.0 23.7 23.6 33.6 31.6 30.6 34.1 25.1 24.7
S <0.1 0.1 - - - -
HHV
(MJ/kg, dry basis) 13.7 28.2 28.1 31.2 26.5 27.8 27.9 24.3 28.3 27.9 23.8 22.4 23.5 22.6 25.1 24.7 Degree of
deoxygenation - 50.5 47.7 54.7 40.9 45.1 45.3 41.9 52.5 52.7 32.7 36.7 38.7 31.7 49.7 50.5
a: Measured at 20°C
b: Calculated by difference
Table 4. Physicochemical properties of the heavy oils with 25 wt% of ethanol
concerned with dehydration reaction) also worked for reducing water content. But the zeolite framework structure tends to collapse under high temperature (Blakeman et al., 2014), the water content of heavy oil increased again in 400 °C. Moreover, the mesoporous alumina-silica support (e.g. MCM-41, SBA-15 etc.) presented higher dehydration than microporous catalysts (Shemfe et al., 2017). However, the zeolites used in this study had similar pore size and pore volume, the acidity (Si/Al ratio) would be highly affected to dehydration. While the solvent concentration presented not that notable effect on the variation of water content (Table 5).
The TAN of the heavy oil was significantly reduced (28-77 mg KOH/g oil) in comparison to that of waste woo bio-oil (150mg KOH/g oil). Despite acid removal, phenolic compounds should be measured as a weak acid by KOH. Therefore, the heavy oils still showed certain level of acidity. Viscosity is also the important factor when the fuel injected into an engine (Ochoa-
Hernández et al., 2013). In this experiment, the viscosity of waste wood bio-oil decreased from 103 mm
2/s to 43-86 mm
2/s in heavy oils. This assumed that the catalysts could effectively convert the macromolecular compounds consisted of bio-oil into monomeric or low molecular compounds in the heavy oils.
3.3.2. Calorific value and Van Krevelen diagram of the heavy oil
The elemental compositions of the waste wood bio-oil and heavy oil were determined and are presented in Tables 4-5. Compared to the carbon (42.9 wt%), hydrogen (7.1 wt%), and oxygen (49.9 wt%) contents of the waste wood bio-oil, the carbon and hydrogen levels increased (57.0-68.7 wt%, and 7.5-10.0 wt%, respectively), while the oxygen level decreased (22.6-34.1 wt%) in heavy oils. Nitrogen and sulfur was not detected in almost of all the heavy oils, while some heavy oil contains less than 0.1 wt%. High carbon content and hydrogen content with low oxygen content resulted in high higher
Bio-oilCoMo/Al2O3 NiMo/Al2O3 NiFe/zeolite Y NiFe/HBeta NiFe/ZSM-5 Concentration (wt%)
25 10 5 25 10 5 25 10 5 25 10 5 25 10 5
Water content (wt%) 19.3
(0.2) 5.0 3.8 4.2 4.9 5.2 4.3 7.3 9.5 15.6 12.0 10.9 8.3 13.0 8.4 8.3 TAN
(mg KOH/g oil) 150
(1.3) 31 68 70 70 54 78 52 50 52 47 60 59 73 70 68
Viscosity(mm2/s)a 103 65 82 86 67 73 84 46 64 68 43 59 67 48 52 59
Elemental analysis (dry basis, wt%)
C 42.9 65.3 67.5 67.4 62.7 63.4 62.2 68.1 63.8 57.0 59.7 61.4 62.5 66.8 63.3 65.2
H 7.1 8.6 8.2 10.0 9.9 8.5 8.6 8.2 8.7 9.3 8.7 8.7 8.7 8.1 8.5 8.1
N <0.1 - - - <0.1 -
Ob 49.9 26.1 24.3 32.5 27.4 28.1 29.2 23.7 27.5 33.7 31.6 29.9 28.8 25.1 28.1 26.7
S <0.1 - - - -
HHV
(MJ/kg, dry basis) 13.7 28.1 29.5 31.4 27.8 26.7 26.5 28.3 25.5 20.4 22.4 23.7 25.2 25.1 25.5 26.2 Degree of
deoxygenation - 47.7 51.3 54.7 45.1 43.7 41.5 52.5 44.9 32.5 36.7 40.1 42.3 49.7 43.7 46.5
a: Measured at 20°C
b: Calculated by difference
Table 5. Physicochemical properties of the heavy oils under 350 °C
heating value (HHV). The HHV was calculated with the equation from previous study (Friedl et al., 2005) using dry basis C, H, and N contents. As a result, HHV of 13.7 MJ/kg (waste wood bio-oil) enhanced 22.6-31.2 MJ/kg in heavy oils.
The heavy oil obtained from 400 °C with CoMo/
Al
2O
3presented the highest carbon content and the lowest oxygen level among those heavy oils, resulting in the highest HHV. However, despite the high carbon content in the heavy oils obtained from lower solvent concentration, the oxygen level also high due to the catalyst deactivation, resulted in lower HHV than the 25 wt% solvent mixture as a raw material.
In Fig. 5, the Van Krevelen diagram, consisted of atomic O/C and H/C ratio to easily compare the deoxy- genation and hydrogenation after the HDO reaction, of the bio-oil, and heavy oils was described. The atomic ratio of waste wood bio-oil (0.6) decreased ranged from 0.1-0.4. The lowest O/C ratio (0.1) was investigated in the heavy oil obtained from 400 °C with NiFe/ZSM-5.
Zeolite supported bifunctional catalysts showed the tendency of decreasing the atomic O/C ratio with temperature, while CoMo/ Al
2O
3and NiMo/ Al
2O
3didn’t presented the trend with temperature. While some conditions reduce even the H/C ratio of waste wood bio-oil (1.4) to 1.2-1.4. NiFe/HBeta under 300 °C HDO presented H/C ratio of 1.9. When the bio-oil hydro- deoxygenated with this NiFe/HBeta, both hydrogenation and deoxygenation performed well (0.3-0.4 of O/C ratio and 1.5-1.9 of H/C ratio, respectively). Also NiMo/Al
2O
3presented well hydrogenation (higher H/C ratio than that of waste wood bio-oil; 1.5-1.9).
3.4. Degree of deoxygenation (DOD)
As mentioned in previous section, high oxygen levels result in high acidity, viscosity, and low heating values, deoxygenation is the most important to the value-added utilization of bio-oil. During HDO process, deoxy- genation, such as demethoxylation, dehydroxylation, or dehydration simultaneously occurred and led to decrease oxygen levels in bio-oil. The DOD was calculated based on the atomic O/C ratio. After the HDO, the O/C ratio of the bio-oil (0.6) decreased to 0.1-0.4 due to deoxygenation. There were no significant differences among the HDO temperature, except for
Fig. 5. Van Krevelen diagram of the heavy oil.
using the NiFe/ZSM-5 catalyst. This catalyst has the smaller pore diameter, and when the temperature increased, some part of framework collapsed, but might retain its features to maintain metal active sites involved in deoxygenation. When the solvent concentration varied, NiFe/ zeolite Y and NiFe/HBeta showed opposite trend. It seemed to be due to coke deposition on the surface pore. High specific surface area of NiFe/HBeta was deactivated by coke and the NiFe/HBeta catalyst became aggregated. So it might not have change to collapse the zeolite framework (Chen et al., 1997). The
trend is same in the water content, so it is clear that the acid sites of these catalysts related to the dehydration.
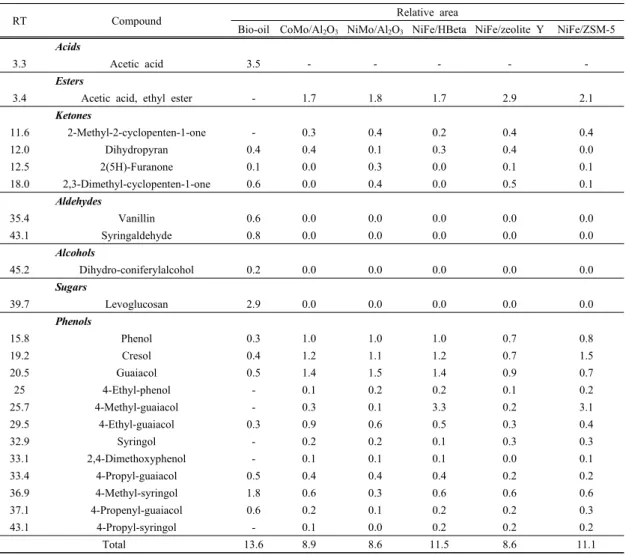
3.5. Structural modification of low-molecular weight compounds during HDO
Typical compounds in bio-oil and heavy oils were identified from the GC/MS analysis and classified based on chemical structure and functional groups. Their relative amounts are presented in Table 6.
The generated compounds in heavy oil mainly con- sisted as phenolic compounds, such as phenol, cresol
RT Compound Relative area
Bio-oil CoMo/Al2O3 NiMo/Al2O3 NiFe/HBeta NiFe/zeolite Y NiFe/ZSM-5 Acids
3.3 Acetic acid 3.5 - - - - -
Esters
3.4 Acetic acid, ethyl ester - 1.7 1.8 1.7 2.9 2.1
Ketones
11.6 2-Methyl-2-cyclopenten-1-one - 0.3 0.4 0.2 0.4 0.4
12.0 Dihydropyran 0.4 0.4 0.1 0.3 0.4 0.0
12.5 2(5H)-Furanone 0.1 0.0 0.3 0.0 0.1 0.1
18.0 2,3-Dimethyl-cyclopenten-1-one 0.6 0.0 0.4 0.0 0.5 0.1
Aldehydes
35.4 Vanillin 0.6 0.0 0.0 0.0 0.0 0.0
43.1 Syringaldehyde 0.8 0.0 0.0 0.0 0.0 0.0
Alcohols
45.2 Dihydro-coniferylalcohol 0.2 0.0 0.0 0.0 0.0 0.0
Sugars
39.7 Levoglucosan 2.9 0.0 0.0 0.0 0.0 0.0
Phenols
15.8 Phenol 0.3 1.0 1.0 1.0 0.7 0.8
19.2 Cresol 0.4 1.2 1.1 1.2 0.7 1.5
20.5 Guaiacol 0.5 1.4 1.5 1.4 0.9 0.7
25 4-Ethyl-phenol - 0.1 0.2 0.2 0.1 0.2
25.7 4-Methyl-guaiacol - 0.3 0.1 3.3 0.2 3.1
29.5 4-Ethyl-guaiacol 0.3 0.9 0.6 0.5 0.3 0.4
32.9 Syringol - 0.2 0.2 0.1 0.3 0.3
33.1 2,4-Dimethoxyphenol - 0.1 0.1 0.1 0.0 0.1
33.4 4-Propyl-guaiacol 0.5 0.4 0.4 0.4 0.2 0.2
36.9 4-Methyl-syringol 1.8 0.6 0.3 0.6 0.6 0.6
37.1 4-Propenyl-guaiacol 0.6 0.2 0.1 0.2 0.2 0.3
43.1 4-Propyl-syringol - 0.1 0.0 0.2 0.2 0.2
Total 13.6 8.9 8.6 11.5 8.6 11.1