Vol. 20, No. 10 (2010)
535
†
Corresponding author
E-Mail : [email protected] (W. -C. Oh)
TiO 2 Combining Spherical Activated Carbon Photocatalysts and Their Physicochemical and Photocatalytic Activity
Won-Chun Oh † *, Jong-Gyu Kim***, Hyuk Kim***, Ming-Liang Chen*, Feng-Jun Zhang* , **, Kan Zhang*, Jong-Geun Choi* and Ze-Da Meng*
*Department of Advanced Materials & Science Engineering, Hanseo University, Seosan-si, Chungnam-do 356-706, Korea
**Anhui Key Laboratory of Advanced Building Materials, Anhui University of Architecture, Anhui Hefei, P. R. 230022, China
***Hanil Green Tech Co, Ltd, Buyeo-gun, Chungnam-do 323-82, Korea
(Received August 14, 2010 : Received in revised form Septembe 22, 2010 : Accepted October 6, 2010)
Abstract
In this study, we used coal-based activated carbons and charcoal as startingmaterials, phenolic resin (PR) as a binder, and TOS as a titanium source to prepare TiO2 combining spherical shaped activated carbon photocatalysts. The textural properties of the activated carbon photocatalysts (SACP) were characterized by specific surface area (BET), energy dispersive X-ray spectroscopy (XRD), scanning electron microscopy (SEM), iodine adsorption, strength intensity, and pressure drop. The photocatalytic activities of the SACPs were characterized by degradation of the organic dyes Methylene Blue (MB), Methylene Orange (MO), and Rhodamine B (Rh. B) and a chemical oxygen demand (COD) experiment. The surface properties are shown by SEM. The XRD patterns of the composites showed that the SACP composite contained a typical single, clear anatase phase.The EDX spectro for the elemental indentification showed the presence of C and O with Ti peaks. According to the results, the spherical activated carbon photocatalysts sample of AOP prepared with activated carbon formed the best spherical shape, a high BET surface area, iodine adsorption capability and strength value, and the lowest pressure drop, and the photocatalytic activity was better than samples prepared with charcoal. We compared the degradation effects among three kinds of dyes. MB solution degraded with the SACP is better than any other dye solutions.
Key words
spherical activated carbon photocatalysts, TiO2, organic dye, iodine adsorption, COD.1. Introduction
Titania is a very versatile material with attractive applica- tions as pigment in paintings, in the production of electro- chemistry electrodes, capacitors, solar cells, catalysis and photocatalysis.
1-3)Current progress in the area of TiO
2applications refer to the photocatalytic air purification, the sterilization and the cancer therapy. But one of the disadvantage in using TiO
2as a photocatalyst is its diffi- culty for sedimentation after photocatalytic process. Therefore many researchers have been undertaken some attempts to improve decant ability of fine powder TiO
2, mounting of TiO
2particles on some supports have been widely reported, such as mounting TiO
2on SiO
2, activated carbon, glass, pumice, zeolites, aluminum, polymers, etc.
4-8)The use of activated carbon for adsorption treatment was first recorded more than two hundred years ago.
Activated carbon adsorbers are now widely employed for product purification (such as sugar refining, food processing
and the production of water) and pollution control (such as water and wastewater treatment and the removal of volatile organics from industrial process gases). In wastewater treatment, activated carbon is a powerful adsorbent because it has a large surface area and pore volume, which allows the removal of liquid-phase contaminants, including organic compounds, heavy metal ions and colors. The criteria for determining whether to use carbon treatment is often the cost of the adsorption process relative to alternative treat- ment processes.
9)An important cost factor in applying the adsorption treatment is the adsorption capacities of carbons for the compounds to be removed.
10)The capacities of carbon for contaminant compounds are significantly affected by the pore structures of activated carbon as well as the size of the adsorbate. Therefore, selecting a suitable carbon adsorber to remove specified compounds is an important issue for the treatment process.
The most widely used activated carbon materials are
two kinds of activated carbon fibers (ACFs) and granular
activated carbons (GACs). However, spherical activated
carbons (SACs) have recently received considerable atten-
tion for their various potential advantages over ACFs and
GACs. The spherical activated carbons (SACs), in com- parison to the commonly used cylindrical activated carbon granules, ensure better column packing which implies higher efficiency of the removal of impurities from water.
Moreover, an adsorbent of spherical shape is more resistant to abrasion. And spherical shape of the activated carbon granules reduces the resistance of flow of liquids and endows the activated carbon with better mechanical prop- erties. Moreover, an adsorbent of spherical shape is more resistant to abrasion.
Pitch,
11)oil agglomerated bituminous coals,
12)phenolic resin,
13)ion exchange resin,
14,15)styrene-divinylbenzene co- polymers,
16)and acrylonitrile-divinylbenzene copolymer
17)have been used to prepared SACs by physical activation or catalytic activation.
Chemical oxygen demand (COD) is most widely used in the characterization of polluting aqueous effluents, and refers to the oxygen required for complete oxidation of a waste- water sample, and is a widely used parameter in controlling the degree of pollution in water and managing effluent quality.
18)COD, which represents the total pollution load of most wastewater discharges,
19)is a main index to assess the organic pollution in aqueous systems.
20)Typically, for a COD determination, the organic compounds presented in the water sample are oxidized completely by the added strong oxidant, usually K
2Cr
2O
7or KMnO
4,
21)then the result is cal- culated by determining the quantity of the consumed oxidant
and expressed in the terms of its oxygen equivalence.
In this paper the activated carbon of spherical shape from powdered coal with a binder additive is prepared and added titanium oxide in the processes to make the TiO
2combining spherical activated carbon photocatalysts (SACP). The prep- aration conditions affecting the yield and textural properties were investigated. The textural properties of SACs were characterized by BET surface area, XRD, SEM, iodine adsorption, strength intensity and pressure drop. We used different carbon materials to produce SACP, and compare their photocatalytic activity by the degradation of dyes (MB, MO and RhB) and COD experiment.
2. Experiment Procedure 2.1 Materials
The main material was coal based activated carbon with size of 100~400 mesh and charcoal was provided by Hanil Green Tech (Korea). Phenolic rosin (PR) was used as a bonding agent, and was purchased from Kangnam Chemical Co., Ltd (Korea). Alcohol (95%) was used as a dispersing agent, and was purchased from Samchun Pure Chemical Co., Ltd (Korea). Titanium oxysulfate (TOS) was purchased from Duksan Pure Chemical Co., Ltd (Korea).
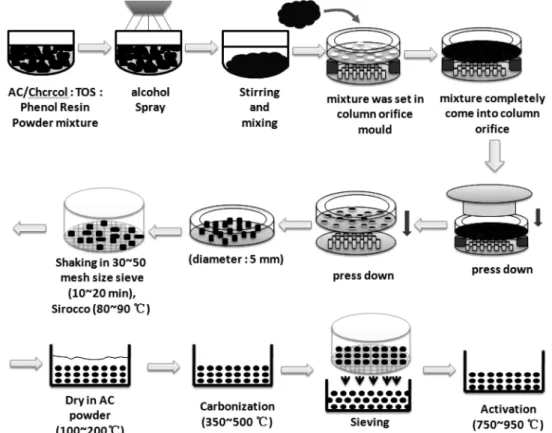
In order to preparation and formation of the spherical activated carbons, shaped mould, shaker sieve and shaker were also used, which made by ourselves. The appearances
Fig. 1. Manufacturing procedure of TiO
2combining spherical activated carbon photocatalytics.
of these machines are shown in Fig. 1.
2.2 Preparation of spherical activated carbon (SACPs) The method of SACPs production includes three stages, i.e., formation, carbonization and activation.
2.2.1. Formation of SACPs
First, activated carbons/charcoal, PR and TOS were mixed with 20~30% alcohol. The mixture was then put into the shaped mould to form agglomerates. To make spheres of these agglomerates, a shaker and a sieve with size of 30~50 mesh was used with a shaking rate of 50 round/min and sirocco at 80~90
oC. After shaking for 10~15 min, the agglomerates formed spheres and dried in the activated carbon powder at 100~200
oC.
2.2.2. Carbonization and activation
In the first part of this experimental work, the agglom- erates were formed in spherical shapes. These spherical agglomerates were heat-treated in activated carbon powder at 350~500
oC for 1 h with a heating rate of 6
oC/min to form SACs. Then, the sample of heat-treated SACs was heated in an inert atmosphere with N
2at a flowing rate of 150 mL/min at 700
oC for 2 h. Then, the carbonized agglom- erate was heated with CO
2at a flowing rate of 150 mL/min at about 950
oC for 2 h with a heating rate of 10
oC/min. For comparison, we prepared four kinds of samples with dif- ferent amounts of activated carbons and PR. The manufac- turing procedure of the SACPs and the preparation con- ditions with the sample codes are shown in Fig. 1 and Table 1, respectively.
2.3 Characterization
The surface morphology and structure of the SACPs was examined in an SEM (JSM-5200, JEOL, Japan). XRD was used for crystal phase identification of the SACs. XRD patternswere obtained at room temperature with a Shimata XD-D1 (Japan) using CuK α radiation. The BET surface area of the SACPs was measured using a Quantachrome surface area analyzer (Monosorb, USA).
2.4 Iodine number determination
The iodine number was determined based on ASTM D
4607-8626) by using the sodium thiosulfate volumetric method. The SACPs were passed through a 325 mesh screen.
Standard iodine solution was added to SACPs (0.5 g) and after equilibration time of 30 s, the residual iodine concen- tration was determined by titration with standard sodium thiosulfate with starch as an indicator. The iodine number was defined as the quantity of iodine adsorbed (in mg/g of carbon) at a residual iodine concentration.
2.5 Strength measurement
Strength measurement was determined based on JIS R 721227) by using one-point bending (Instron 4201) with support distance of 30 mm/min and cross head speed of 0.5 mm/min. The diameter size of sample was about 5 mm, and the strength density was calculated by the following equation:
σF = 3PL/2BD
2(1)
Where σF is strength density (kg/m
2), P is is breaking load (kg), L is support distance (cm), B is width of sample (cm) and D is thickness of sample (cm).
2.6 Pressure drop measurement
Pressure drop of sample was measured by a circulating pipe with an inside diameter of 27 mm and a length of 12 m. The samples in the tank were introduced into the pipe by a pump (2NE-20A) with the capacity of 3.5 m
3/h.
The pressure drop was determined by changing the velocity in the range of 0.25~1.7 m/sec in the pipe. The Hazen- Williams equation for calculating the pressure drop due to frication for a given pipe diameter and flow rate is as follows.
22)∆P = 6.174 × Q
1.85× 10
5/ (C
1.85× d
4.87) (2) Where, P = frictional pressure drop, kg/cm
2Q = flow rate, L/min
D = pipe inside diameter, mm
C = Hanzen-Williams C factor, dimensionaless (120) 2.7 Photodegradation of organic dyes
The photochemical data presented as behaviors of organic dyes (MB, Rh.B and MO) degraded by SACP samples in a 100 mL glass container and UV irradiation system. The two spherical agglomerates with average mass at around 0.09 g was suspended in the 50 ml of organic dye (MB, Rh.B and MO) solution with a concentration of 1.0 × 10
−6M. The reactor was placed for 2 hours in the darkness box, in order to make the SACP composites particles adsorbed the organic dye (MB, Rh.B and MO) molecule maximum, which was hereafter considered as the initial concentration (c
0) after dark adsorption. After the adsorption state, the UV light irradiation was restarted to make the degradation reaction proceed. In the process of degradation of organic Table 1. Nomenclatures of samples prepared with SACP composites.
Preparation method Nomenclatures
AC : TOS : PR = 66 : 4 : 30 AOP1
AC : TOS : PR = 64 : 6 : 30 AOP2
AC : TOS : PR = 62 : 8 : 30 AOP3
Charcoal : TOS : PR = 71 : 4 : 25 COP1
Charcoal : TOS : PR = 69 : 6 : 25 COP2
Charcoal : TOS : PR = 67 : 8 : 25 COP3
dye (MB, Rh.B and MO), a glass reactor (bottom area = 20 cm
2) was used. Samples were then withdrawn regularly from the reactor and removal of dispersed powders through a centrifuge. The concentration of MB in the solution was determined as a function of irradiation time. Solution was then withdrawn regularly from the reactor by an order of 60 min, 120 min, 180 min, and 240 min. The clean transparent solution was analyzed by using a UV-vis spectrophotometer.
The extent of dye degradation was estimated by spectro- photometrically at the absorption maximum ( λmax) of the concerned dye.
2.8 COD test
The photocatalytic activities was also tested by measuring the degradation of piggery waste in aqueous media in a 100 mL glass container and then irradiation system with 20W UV light at 365 nm in darkness box. The suspended sample (0.5 g) was kept at 0.01 g/ml. Then, the suspended solution was placed in the dark for at least 2 h, in order to establish an adsorption-desorption equilibrium, which was hereafter considered as the initial concentration (c
0) after dark adsorption. Experiments were then carried out under UV light irradiation, the reactor was placed on the magnetic churn dasher, which was measured at 300 min. The samples were withdrawn regularly from the reaction and dispersed powders were removed through a centrifuge. The clean transparent
solutions were tested with a COD cell test photometer.
3. Results and Discussion
3.1 Textural characterization of SACPs
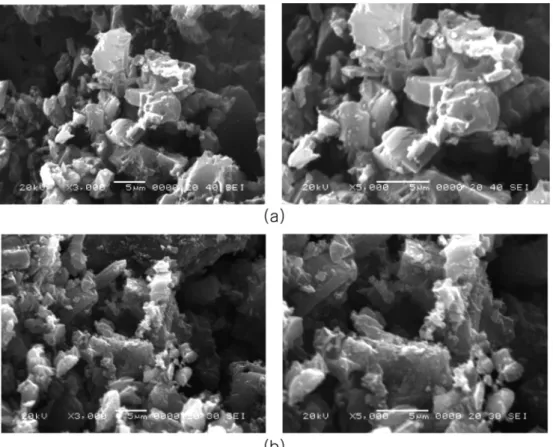
The SEM image of the SACPs is shown in Fig. 2. After carbonization and activation at high temperature it can be clearly seen that the TiO
2particles prepared at a source temperature of 973 K showed a great distribution of dimen- sion. The size of TiO
2particles is about 0.5 µm, and the distribution was uniform. In the report of Zhang,
23)a good dispersion of small particles could provide more reactive sites for the reactants than aggregated particles. From SEM image there have not much different between AOP and COP compounds.
Fig. 3 shows the XRD pattern of the SACPs. XRD
result shows the crystal phase of this SACPs. The results
indicate that the phase transition of AOP is almost pure
anatase phase and COP has rutile and anatase phase. In-
crease the content of anatase phase can enhance the photo-
catalytic activity of photocatalysts. The peaks corresponding
to the anatase TiO
2phase appeared at 25.3, 37.5, 48.0,
54.9, and 62.5 were diffractions of (101), (004), (200),
(211), and (204) planes of anatase which indicating that
the prepared TiO
2existed in an anatase phase. With 2 θ
values of 27.52
o, 36.20
o, 41.44
oand 54.48
o, corresponding
Fig. 2. SEM images of TiO
2combining spherical activated carbon photocatalysts, (a) AOP and (b) COP.
to (110), (101), (111) and (211) crystal planes of rutile TiO
2. From Fig. 3 we can see TiO
2with different doping make the different crystal class after 500
oC heat treated.
Mix with activated carbon can make the phase transition from rutile to the anatase phase.
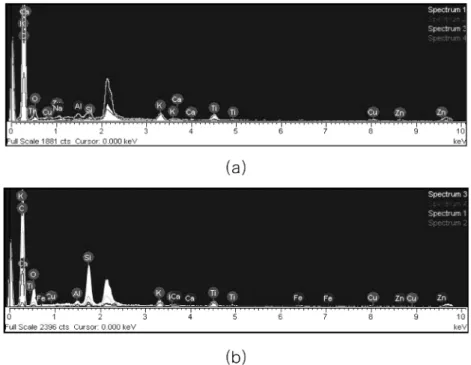
24)The quantitative microanalysis of C, O and Ti as major elements for these photocatalyst composites were performed by EDX which were shown in Fig. 4. The EDX results of photocatalyst composite shows the peaks corresponding to the C, O and Ti elements. The spectra show the presence of C, O, and Ti, as major elements. There are some small impurities, which were considered to introduce into the composites using the carbon or charcoal without purification.
In the case of the spherical activated carbon photocatalysts
samples, carbon and titanium were present as major elements with small quantities of oxygen in the composite.
Fig. 5 shows the changes of BET surface area of the SACPs before and after activation. It is clearly seen that this surface area of AOP is decreased with an increasing amount of TiO
2before activation, and that the same is true after activation. It can be considered that the TiO
2was introduced into the pores of the carbon, and thus decreased the BET surface area. But the surface area of COP is increased with an increasing amount of TiO
2. This is maybe the presence of TiO
2can exchange the pore type and the pore volume of COP composites. Moreover, comparing with the surface area before activation, the BET surface area of SACPs is much more improved after Fig. 5. BET surface area of s TiO
2combining spherical activated carbon photocatalysts before and after activation.
Fig. 3. XRD patterns of TiO
2combining spherical activated carbon photocatalysts.
Fig. 4. EDX patterns of TiO
2combining spherical activated carbon photocatalysts, (a) AOP and (b) COP.
activation, about 2~3 times improved. It can be considered that the TiO
2and PR were little by little clogged in the pores in the activated carbon when the amount of TiO
2increased. After activation, the BET surface area decreased slowly due to the PR was pyrolyzed and the pores were re- formed, thus the BET surface area of the SACPs increasing relative.
25-28)Comparing samples AOP with samples COP, the BET surface of AOP is much bigger than that of COP before activation. Because activated carbon has a large sur- face area and pore volume than charcoal. Activated carbon is actually oxidized charcoal. The pores give activated carbon a massive surface area that allows it to absorb organic chemicals and some other stuff. Charcoal will also absorb organics, but it has way less surface area to do so.
3.2 Iodine adsorption capability of SACPs
In generally, the iodine adsorption capability of the granular activated carbons and powder activated carbons
is about 900~1200 mg/g.
29)However, the iodine adsorption capability is markedly decreased when carbons are treated with metal or formed in different shapes.
30,31)Via the results we can see the iodine adsorption capability of AOP is better than COP, and the iodine adsorption capability is decreased with the content of TiO
2increasing. Because the TiO
2particles decreased the pour volume and BET surface areas of AOP, we can find from Fig. 5. But the BET surface area of COP was increased during the iodine adsorption capability is decreased, it is well established that certain types of solids may contain micropores with dimensions no more than a few molecular diameters, and the presence of these micropores can dramatically affect the surface behavior of the solid. From Fig. 6, we can see the changes of iodine adsorption capability of SACs before and after activation. The samples after activation have much more iodine adsorption capability. Because PR was pyrolyzed and the pores were reformed, high iodine adsorp- tion capability resulted. The iodine adsorption capability of the SACs decreased with an increasing amount of TiO
2.
3.3 Strength and pressure drop of SACs
Fig. 7 shows the strength values of SACs before and after activation. From the results, it is clearly seen that the strength values of the SACs are increased with an increasing amount of PR. This indicates that the bonding agent has a significant influence on the strength of the SACs, and that if the spherical shapes formed well, the strength value is also high. From Fig. 7 we can see either before or after activation the strength value of AOP is strong than that of COP due to the content of PR is decreased from 30% to 25%.
Fig. 8 shows the pressure drop of the SACs before and after activation. We can clearly see that the pressure drop of the SACs is decreased with an increasing amount of TiO
2Fig. 7. Strength intensity of TiO
2combining spherical activated carbon photocatalysts before and after activation.
Fig. 6. Iodine adsorption capacity of TiO
2combining spherical activated carbon photocatalysts before and after activation.
Fig. 8. Pressure drops of TiO
2combining spherical activated carbon
photocatalysts before and after activation.
before activation. However, when after activation the pre- ssure drop of the SACs is increased with an increasing amount of TiO
2. The pressure drop of SACs is decreased after activation, about 10%~3% decreased. When the content of TiO
2increased the change of the pressure drop is a little.
3.4 Photocatalytic decomposition of dyes
To study the photocatalytic effect of the prepared sam- ples, we investigated the decomposition reaction of MB, MO and Rh.B in water. The experimental results of the dye removal by the photocatalysts are presented in Fig. 6.
The photocatalytic degradation of dyes solution under UV light was used for evaluating the photocatalytic activities of spherical activated carbons photocatalysts.
The plots of −ln(C /C
0) versus time in Fig. 6 represent straight lines, which show the slope of the linear variations corresponding to the apparent first-order rate constant, k
app. In our case, the changes by color shade are presented on a logarithm scale of relative concentration ( −ln (c/c
0)) of dye degraded in the aqueous solution as a function of UV irradiation time.
In Fig. 6, the photocatalytic activity of SACPs are clearly shown, we can find the SACPs have good photocatalytic activity for different dye. Either in MB or Rh.B solutions, the SACPs can remove the color effectively. The effect of degradation of dye increased with an increase of the content of TOS. And the effect of degradation of MB solution is shown the best.
The values corresponding to different initial concentra- tions, along with the regression coefficients are listed in Table 2. And compare the photocatalytic activity between AOP and COP samples, the photocatalytic activity of AOP is better than that of COP due to AOP has bigger BET surface area and batter iodine adsorption capacity, which can directly support this point from Fig. 5 and Fig. 6.
32,33)Fig. 9. Photocatalytic degradation of dyes for TiO
2combining spherical activated carbons photocatalysts under UV light, (a) degradation of MB solution, (b) degradation of MO solution and (c) degradation of RB solution.
Table 2. The apparent kinetic constant (K
app) of samples prepared with SACP composites.
Sample name K
appof MB K
appof MO K
appof Rh.B AOP1 1.79 × 10
−31.33 × 10
−31.02 × 10
−3AOP2 1.85 × 10
−31.57 × 10
−31.22 × 10
−3AOP3 2.15 × 10
−31.97 × 10
−31.48 × 10
−3COP1 1.07 × 10
−30.85 × 10
−30.64 × 10
−3COP2 1.42 × 10
−31.11 × 10
−31.18 × 10
−3COP3 1.49 × 10
−31.18 × 10
−31.25 × 10
−3Fig. 10. The COD removal efficiency for TiO
2combining spherical
activated carbons photocatalysts.
3.5 COD effect of SACPs
Chemical oxygen demand refers to the oxygen required for complete oxidation of a wastewater sample. Note that the direct photolysis of infectants accompanies the reduction of COD, implying the oxidation ability. Evidently, the COD reduction can only be proceeded via the photocatalytic oxidation so that more active sites of the SACPs are advan- tageous to the oxidation reaction.
34)As for different SACP in Fig 8, the removal percentage of COD is relatively lower for COP samples due to the greater competition of the inter- mediates for the oxidative species. From Fig. 8 the removal percentage of COD is increased with the amount of TOS, and the total removal percentage of AOPs is bigger than that of COPs, this means that the reactor which containing the AOP samples have a relatively strong oxidation ability.
4. Conclusions
In this work, we have successfully prepared TiO
2com- bining spherical shaped activated carbon photocatalysts.
Among the prepared SACPs, the AOP samples have the best formation of spherical shapes and photocatalytic acticity. SEM shows that the SACP composites were synthesized by immobilizing TiO
2particles on the surface of coal based. The XRD data shows that the AOP samples contained pure anatase phase. C and O with Ti peaks were found from the EDX results. AOP samples have high BET surface area, iodine adsorption capability and strength value, and lowest pressure drop. And after the activation for SACP composites the BET surface area and Iodine adsorption capability of SACPs were increased, the Strength and pres- sure drop of SACs were decreased. The organic dyes (MB, MO and Rh.B) decomposition processed shows that the effect of degradation of MB solution is the best, and AOP3 have the best photocatalytic activity, the results of COD test directly support this point.
References
1. A. Fujishima, K. Hashimoto and T. Watanabe, TiO2 photo- catalysis : Photocatalysis Fundamentals and Applications, BKC, Tokyo (1999).
2. E. Piera, M. I. Tejedor, M. E. Zorn and M. A. Anderson, Appl. Catal. B Environ., 47, 219 (2004).
3. I. K. Konstantinou and T. A. Albanis, Appl. Catal. B Environ., 42, 319 (2003).
4. D. Dumitriu, A. R. Bally, C. Ballif, P. Hones, P. E.
Schmid, R. Sanjines, F. Levy and V. I. Parvulescu, Appl.
Catal. B Environ., 25, 83 (2000).
5. T. Yuranova, R. Mosteco, J. Bandara, D. Laub and J. Kiwi, J. Mol. Catal. Chem., 244, 160 (2006).
6. X. Zhang, M. Zhou and L. Lei, Carbon, 44, 325 (2006).
7. X. -Y. Chuan, M. Hirano and M. Inagaki, Appl. Catal. B
Environ., 51, 255 (2004).
8. B. Sanchez, J. M. Coronado, R. Candal, R. Portela, I.
Tejedor, M. A. Anderson, D. Tompkins and T. Lee, Appl.
Catal. B Environ., 66, 295 (2006).
9. W. C. Ying, in Proceedings of the 44th Purdue Industrial Waste Conference (Chelsea MI, 1989) p. 313-324.
10. W. C. Ying, E. A. Dietz and G. C. Woehr, Environ. Progr., 9, 1 (1990).
11. J. B. Yang, L. C. Ling, L. Liu, F. Y. Kang, Z. H. Huang and H. Wu, Carbon, 40, 911 (2002).
12. Z. Liu, L. Ling, W. Qiao and L. Liu, Carbon, 37, 663 (1999).
13. G. Gryglewicz, K. Grabas and E. Lorenc-Grabowska, Carbon, 40, 2403(2002).
14. H. Nakagawa, K. Watanabe, Y. Harada and K. Miura, Carbon, 37, 1455 (1999).
15. V. M. Gun’ko, R. Leboda, J. Skubiszewska-Zieba, B.
Charmas and P. Oleszczuk, Carbon, 43, 1143 (2005).
16. E. M. Zippi and G. W. Kabalka, Carbon, 34, 1539 (1996).
17. M. Koˇ ciˇ rík, J. Brych and J. Hradil, Carbon, 39, 1919 (2001).
18. K. Zhang, Z. D. Meng and W. C. Oh, Kor. J. Mater. Res., 20(3), 117 (2010).
19. S. H. Song, O. S. Kwon, H. K. Jeong, and Y. G. Kang, Kor. J. Mater. Res., 20(2), 104 (2010).
20. J. W. Jin, Y. D. Park, D. G. Nam, S. B. Lee, S. L. Kim, N. H. Kang and M. K. Cho, Kor. J. Mater. Res., 19(6), 293 (2009).
21. Y. H. Jiang, Y. K. Park and O. Y. Lee, Kor. J. Mater. Res., 17(12), 634 (2007).
22. T. Tsumura, N. Kojitani, H. Toyoda and M. Inagaki, Appl.
Surf. Sci., 15, 429 (2002).
23. N. S. Roh, K. H. Kim, and D. C. Kim, Hwahak Konghak, 33, 282 (1995).
24. S. H. Joo, S. J. Choi, I. Oh, J. Wak, Z. Liu, O. Terasaki, and R. Ryoo, Nature, 412, 169 (2001).
25. W. Lu and D. D. L. Chung, Carbon, 35, 427 (1997).
26. W. C. Oh, M. L. Chen, F. J. Zhang and H. T. Jang, J. Kor.
Ceram. Soc., 45, 324 (2008).
27. S. H. Kim, Kor. J. Mater. Res., 16(1), 25 (2006).
28. W. C. Oh, A. R. Jung, and W. B. Ko, Mater. Sci. Eng. C, 29, 1338 (2009).
29. J. W. Kim, M. H. Sohn, D. S. Kim, S. M. Sohn, and Y.
S. Kwon, J. Hazard. Mater., 85, 301 (2001).
30. S. C. Kim, I. K. Hong, and K. A. Park, J. Ind. Eng.
Chem., 3, 218 (1997) .
31. I. Bedja, S. Hotchandani, P. V. Kamat, J. Phys. Chem., 98, 4133 (1994).
32. E. Frackowiak, Phys. Chem. Chem. Phys., 9, 1774 (2007).
33. M. A. de la Casa-Lillo, F. Lamari-Darkrim, D. Cazorla- Amoros, and A. Linares-Solano, J. Phys. Chem. B, 106, 10930 (2002).
34. R. Devi and R.P. Dahiya, Water Air Soil Pollut., 174, 33 (2006).