Mineral N, Macro Elements Uptake and Physiological Parameters in Tomato Plants Affected by Different Nitrate Levels
Jwakyung Sung, Suyoun Lee, Seongsoo Kang, Yejin Lee, Rogyoung Kim, Juyoung Lee, Byoungchoon Jang, Sangkeun Ha, and Jongsik Lee*
Division of Soil and Fertilizer Management, NAAS, RDA, Suin-ro 150
th, Seodun-dong, Gwonseon-gu, Suwon, 441-707, Korea
The aim of this study was to know whether leaf nitrate can be a substitute of total leaf N to justify plant N status and how nitrate influences macro elements uptake and physiological parameters of tomato plants under different nitrogen levels. Leaf nitrate content decreased in low N, while showed similar value with the control in high N, ranging from 55 to 70 mg g
-1. Differences in nitrate supply led to nitrate-dependent increases in macro elements, particularly cations, while gradual decrease in P. Physiological parameters, photosynthesis rates and antioxidants, greatly responded in N deficient conditions rather than high N, which didn’t show any significant differences compared the control. Considering nitrogen forms and physiological parameters, total-N in tomato plants represented positive relation with growth (shoot dry weight), nitrate and CO
2assimilation, whereas negative relation with lipid peroxidation.
Key words: Tomato, N deficiency, Nitrate, Macro elements, Antioxidants
Received : June 10. 2011 Accepted : July 6. 2011
*Corresponding author : Phone: +82312900314 E-mail: [email protected]
Introduction
Tomato is one of the most popular vegetable crops grown commercially around the world, and its cultivation scale was the fifth among green houses-grown vegetable crops in Korea (KREI, 2009). The huge amounts of composts derived from live stock manure, organic fertilizers, etc.
have been applied to green house soils since 1990 as the alternatives of chemical fertilizers, and this activity has successively accumulated mineral nutrients capable of resulting in an adverse soil environment. Green houses are easy to meet unexpected weather conditions during crop cultivation, therefore, unfavorable status of mineral nutrients and weather often makes it difficult that crops meet their-own requirements of light, carbon dioxide, and mineral nutrients, and finally leads to the retarded growth and lower yields. Nutrient disorders of green houses-growing crops have been frequently occurred year by year and, in particular, nitrogen-associated events occupy in high extent of the problem.
Nitrogen (N) is the essential mineral element required
in the greatest amount in plants, comprising 1.5 to 4% of plant dry matter and approximately 16% of total plant protein (Frink et al., 1999). Thus, N availability is a major limiting factor for plant growth and crop production. Plant can utilize a wide range of N species including volatile ammonia (NH
3), nitrogen oxides (NO
x), mineral N (NO
3-and NH
4+), and organic N (amino acid, peptides, etc.; von Wiren et al., 1997). However, in most agricultural soils, nitrate (NO
3-) is the most important source of N (Crawford and Glass, 1998; Hirsch and Sussman, 1999). A large number of studies in relation with nitrogen status have been broadly carried out since 20
thcentury, and there are useful tools to determine crop N status such as visual symptom, dry matter-based nitrogen, nitrogen in xylem sap, chlorophyll, SPAD value, GIS-based remote sensing, biochemical analysis, and etc. The dry matter-based nitrogen analysis is the most time-consuming tool although it highly reflects crop N status and growth, and the chlorophyll contents and SPAD value despite the close relation with total-N and nitrate contents have a limit to correctively measure due to being changeable by leaf thickness, leaf age, and species (Peng et al., 1993; Piekielek et al., 1995;
Shaobing et al., 1995; Westcott et al., 1995; Chapman et
al., 1997; Scott and Barreto, 1997). In addition, nitrogen
content in xylem sap seems to be greatly relied by sampling time because of difference in transpiration rates by light intensity and soil moisture.
Production of reactive oxygen species (ROS) is inevitable even under not only adverse growth conditions such as biotic- and abiotic-stresses, but also optimum growth conditions. In particular, under stress conditions, enhanced generation of ROS disturbs the normal redox environment of cells (Grant and Loake, 2000; Cuypers et al., 2001;
Foyer and Noctor, 2003; Apel and Hirt, 2004). Plants produce their own-protective mechanisms such as enzymatic, SOD, POD, CAT and GPX, and non-enzymatic, ascorbate, α-tocopherol, carotenoids, flavonoids and glutathione, processes (Noctor and Foyer, 1998; Foyer and Noctor, 2003; Apel and Hirt, 2004).
Researches on the roles of nitrogen in plants have been continuously studied since the beginning of plant science.
Useful tools have been developed to understand plant N status around world and being widely applied. However, nitrogen determination is time-consuming work for destructive methods, total-N and xylem sap analysis, or can lead to variable results for non-destructive method, chlorophyll meter (SPAD) and soil N. Therefore, the objectives of this work were to know whether leaf nitrate can be a substitute of total leaf N to justify plant N status and how nitrate influences macro elements uptake and physiological parameters (photosynthesis rates and antioxidants).
Materials and Methods
Plant materials, growth and treatment This study was conducted in a green house at NAAS, RDA in 2010.
Seeds of tomato (Lycopersicon esculentum cv. Seonmyoung) were germinated in pearlite tray supplied with distilled- deionized water. Seedlings were transplanted into aerated containers with 1/3 strength of Hoagland nutrient solution.
The Nitrate was separately supplied in media as follows;
10, 30, 100 (2.5 Mm NO
3, Control), 200 and 400% of 1/2 strength of Hoagland nutrient N. Four-weeks-old tomato plants were subjected to 12 holes - aerated 20 L capacity containers with different N levels. Plants were constantly exposed for 2 weeks with average day temperature between 28 ± 2℃ and night temperature between 18 ± 2℃. Mid- day photosynthetic photon flux density was 900-1,000 μ mol m
-2s
-1. The nutrient solution was replaced every 3 days. Plants were harvested between 10:00 and 14:00 at 7 and 14 days after treatment, immediately separated into
leaves, stem and roots, and used for further analysis.
Dry weight determinations and chemical analysis The extraction and measurement of macro-nutrients were determined according to Walinga method (1989). Three randomly selected-plants per treatment were divided into leaves, stem and roots, and dried in an oven at 70℃ for 2 days to determine dry weights and elemental concentrations.
Chemical analyses, leaves and roots, were carried out on dry weight basis with three repeats. The absorbance of N and P was measured at 660 and 880 nm, respectively, using UV-spectrophotometer, and K, Ca and Mg were measured with ICP-OES (INTEGRA XMP, GBC, Australia).
Water soluble mineral N was extracted from the fresh materials with deionized-distilled water (1:5, w/v) at room temperature. Nitrate was reduced to nitrite by hydrazine in alkaline solution with a copper catalyst, after which it is reacted with sulphanilamide and NEDD (N-1-Naphthy- lethylenediamine di-HCl) to form a pink compound and absorbance was measured at 550 nm. Ammonium was added with salicylate and dichloroisocyanuric acid to produce a blue compound and measured at 660 nm. Nitroprusside was used as a catalyst. Water soluble nitrate and ammonium were analyzed by an Auto-analyzer 3 (BRAN LUBBE, Germany).
Measurements of rates of photosynthesis Rates of photosynthesis in response to nitrate levels were measured with a CO
2analyzer (ADC LCpro
+, ADC BioScientific Ltd, UK) operating in a differential mode. Mid-fully expanded tomato leaves from each treatment were enclosed in the square (6.25 cm
2) chamber to monitor CO
2assimilation (A), transpiration rate (E) and stomatal conductance (g
s), and photosynthesis measurement with PPFD (900-1,000 μmol m
-2s
-1) and atmosphere CO
2(380 ± 10 μmol m
-2) was performed between 10:00 and 14:00 under.
Physiological parameters determination Membrane permeability, electrolyte leakage, of leaf discs was determined according to Lutts method (1996b). Leaf discs (1 g FW) removed surface-adhered electrolytes were placed in closed vials with 10 ml of dH
2O, incubated at RT on a rotary shaker for 24 hrs, and measured electrical conductivity of the solution (L
t). The solution was autoclaved at 120℃
for 20 min, cooled down at 25℃, and measured the last
electrical conductivity (L
o). Membrane permeability was
determined as follows; Electrolyte leakage (%) = (L
t/L
o) ×
100. Lipid peroxidation (expressed by MDA, malondialdehyde)
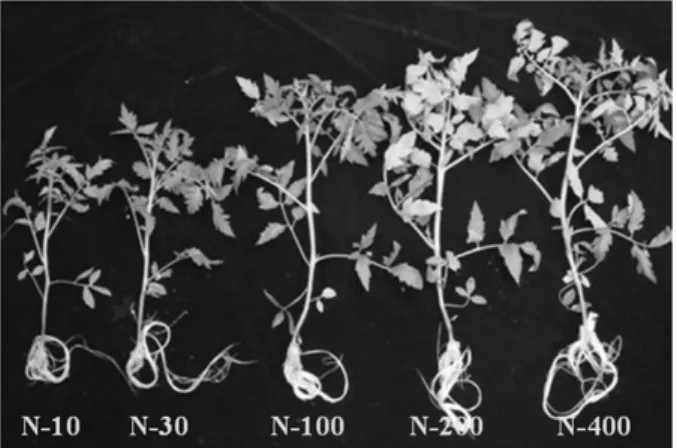
Photo. 1. Growth of tomato plants subject to different nitrogen levels for 14 days.
Fig. 1. Timely changes in tomato shoot weight subject to different nitrate levels. The nitrate was separately supplied with 10, 30, 100 (2.5 mM NO
3), 200 and 400 % based on the Hoagland nutrient N. Data represents means of six plants sampled during light period (10 AM-14 PM).
was determined by the thiobarbituric acid (TBA) reaction as described by Heath & Packer (1968). Fresh leaf samples (0.5 g) in LN
2were homogenized in 5 ml of 20% (w/v) TCA. The homogenate was centrifuged at 3,500 g for 20 min. To 1 ml of the aliquot of the supernatant, 2 ml of 20%
TCA containing 0.5% (w/v) TBA and 100 μl 1% (w/v) buthylated-hydroxytoluene (BHT) in EtOH were added.
The mixture was heated at 95℃ for 30 min, and then quickly cooled on ice. The reactants were centrifuged at 5,000 g for 15 min and the absorbance was measured at 532 nm. The value for non-specific absorption at 600 nm was subtracted. The concentration of thiobarbituric acid reactive substances (TBARS) was calculated using as extinction coefficient of 155 mM cm
-1. For ascorbate estimation (Mukherjee and Choudhari, 1983), fresh leaf samples (0.5 g) in LN
2were extracted with 10 ml of 6%
TCA. The 4 ml of extract was mixed with 2 ml of 2%
dinitrophenylhydrazine (in acidic medium) followed by the addition of 1 drop of 10% thiourea (in 70% EtOH). The mixture was boiled for 15 min and cooled to RT. The 5 ml of 80% (v/v) H
2SO
4was added to the mixture in an ice bath. The absorbance was recorded at 530 nm. The concentration was estimated from a standard curve plotted with known concentration of ascorbate. The reduced ascrobate was calculated by subtracting the DHA content from the total ascorbate. Fresh leaf samples (0.5 g) in LN
2were homogenized in 100 mM Na-phosphate buffer (pH 7.8) containing 0.1 mM EDTA and 1% (w/v) PVP at 4℃.
Soluble protein was assayed by the method of Bradford (1976) using BSA as a standard. Catalase (E.C. 1.11.1.6) activity was determined by monitoring the decomposition of H
2O
2(extinction coefficient 39.4 mM cm
-1) at 240 nm following the method of Aebi (1974). The reaction mixture contained 50 mM K-phosphate buffer (pH 7.0) and a proper amount of plant extract in a 3 ml. The reaction was initiated by adding 10 mM H
2O
2.
Data analysis All data obtained was subject to ANOVA test to determine the significance of the difference between the means of treatments (SAS 9.1), and Pearson’s correlation coefficient analysis was performed to know the relationship between nitrogen and physiological parameters.
Results
The influence of the level of NO
3supply on dry matter yield production at 7 and 14 days after NO
3exposure is
shown in Photo 1 and Fig. 1. As expected, increasing the level of NO
3nutrition from N deficiency levels to high levels of N supply exerted a very marked influence. Shoot yields in N-400 at 14 days were 2.45 times greater than in the lowest treatment (N-10). Plants supplied with 30%
NO
3or less showed N deficiency symptoms.
Nitrate and ammonium uptake into tomato leaves
appeared significantly different (Fig. 2) by NO
3nutrition
levels. Nitrate contents were entirely parallel with nitrate
supply rates whereas ammonium represented a reversed
pattern. Also, their uptake showed different responses by
treatment period; a constant increase in nitrate and a
gradual decrease in ammonium. Uptake of nitrate of fresh
leaves in N deficiency just ranged from 0.4 (N-10) to 2.6 μ
g g
-1(N-30) in 7 days and from 1.2 to 6.5 μg g
-1in 14 days
and these results were only 12% or less compared with
Fig. 2. Timely changes in nitrate and ammonium contents of mid-fully expanded tomato leaves subject to different nitrate levels. Nitrate separately supplied with 10, 30, 100 (2.5 mM NO
3), 200 and 400 % based on the Hoagland nutrient N. Data represents means of six plants measured during light period (10 AM-14 PM).
Fig. 3. Influence of photosynthetic characteristics, CO
2assimilation (μmol CO
2m
-2s
-1), transpiration (mmol H
2O m
-2s
-1) and stomatal conductance (mmol H
2O m
-2s
-1), of mid-fully expanded tomato leaves by different nitrate supply.
Nitrate separately supplied with 10, 30, 100 (2.5 mM NO
3), 200 and 400 % based on the Hoagland nutrient N. Data represents means of six plants measured during light period (10 AM-14 PM) after 14days of treatments.
N-100 (25.4 μg g
-1in 7 days and 55.0 μg g
-1in 14 days). As for more than 200% of nitrate supply, its contents varied from 35.8 to 69.0 μg g
-1, which indicated 5 to 40% higher compared the N-100. Ammonium uptake was the highest in N-10 (23.8 μg g
-1in 7 days and 5.4 μg g
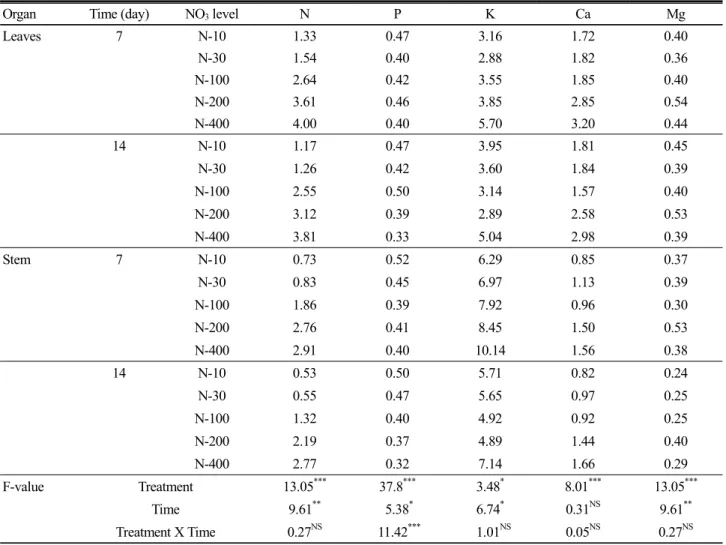
-1in 14 days) however it was traceable in more than 30% of nitrate supply although there was a slight difference between treatments. The effects of nitrate on N, P, K, Ca and Mg uptake in tomato leaves are shown in Table 1. Mineral uptake was significantly increased with an increment in nitrate however P uptake was considerably decreased. N, Ca and Mg contents were greater in leaves than stem whereas K seemed to be higher in stem. Also, an increase in treatment period resulted in the slight dilution of mineral in leaves and stem. Mineral contents in leaves for two weeks treatment varied from 1.17 ~ 4.00% (N), 0.33 ~ 0.50% (P), 2.88 ~ 570% (K), 1.57 ~ 3.20% (Ca) and 0.36
~ 0.54% (Mg) and, in stem, 0.53 ~ 2.91% (N), 0.31 ~ 0.52% (P), 4.89 ~ 10.14% (K), 0.82 ~ 1.66% (Ca) and 0.24
~ 0.53% (Mg).
Fig. 3 also shows the influence of the level of NO
3nutrition on photosynthesis rates. Deficient nitrate (less
than 30% of nitrate supply) showed a marked decrease
in CO
2assimilation (A), transpiration (E) and stomatal
conductance (G
s), which indicated the rates of 60 (5.94 -
6.78 μmol m
-2s
-1), 46 (3.46 - 4.56 mmol m
-2s
-1) and 54
(0.11 - 0.20 mmol m
-2s
-1)% compared with 100% (2.5
mM Nitrate), respectively. Whereas higher nitrate supply,
Table 1. Macro elements composition (%, DW) in leaves and stem of tomato plants (n= 6) subject to different nitrate levels for 7 and 14 days.
Organ Time (day) NO
3level N P K Ca Mg
Leaves 7 N-10 1.33 0.47 3.16 1.72 0.40
N-30 1.54 0.40 2.88 1.82 0.36
N-100 2.64 0.42 3.55 1.85 0.40
N-200 3.61 0.46 3.85 2.85 0.54
N-400 4.00 0.40 5.70 3.20 0.44
14 N-10 1.17 0.47 3.95 1.81 0.45
N-30 1.26 0.42 3.60 1.84 0.39
N-100 2.55 0.50 3.14 1.57 0.40
N-200 3.12 0.39 2.89 2.58 0.53
N-400 3.81 0.33 5.04 2.98 0.39
Stem 7 N-10 0.73 0.52 6.29 0.85 0.37
N-30 0.83 0.45 6.97 1.13 0.39
N-100 1.86 0.39 7.92 0.96 0.30
N-200 2.76 0.41 8.45 1.50 0.53
N-400 2.91 0.40 10.14 1.56 0.38
14 N-10 0.53 0.50 5.71 0.82 0.24
N-30 0.55 0.47 5.65 0.97 0.25
N-100 1.32 0.40 4.92 0.92 0.25
N-200 2.19 0.37 4.89 1.44 0.40
N-400 2.77 0.32 7.14 1.66 0.29
F-value Treatment 13.05
***37.8
***3.48
*8.01
***13.05
***Time 9.61
**5.38
*6.74
*0.31
NS9.61
**Treatment X Time 0.27
NS11.42
***1.01
NS0.05
NS0.27
NS*
P<0.05,
**P<0.01,
***P<0.001 and NS (non-significant).
which shows CO
2assimilation (A, 13.37 - 16.68 μmol m
-2s
-1), 46 (T, 6.24 - 6.96 mmol m
-2s
-1) and 54 (G
s, 0.21 - 0.24 mmol m
-2s
-1), seemed not to favorably affect photosynthesis rates compared with the control in spite of a slight increase in CO
2assimilation of N-400.
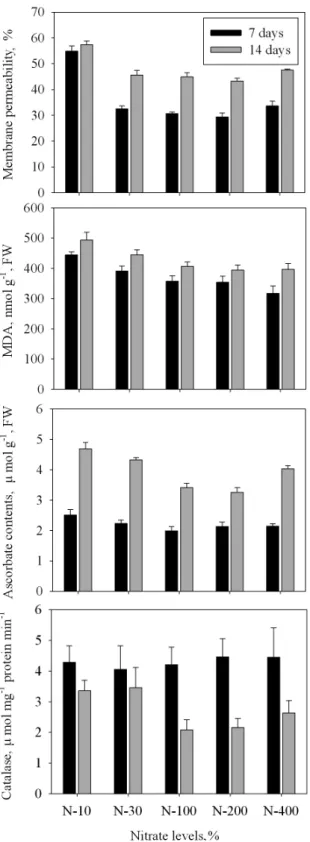
Some physiological parameters were measured to know an influence by nitrate at 7 and 14 days after supplying different nitrate rates in medium (Fig. 4). Changes in physiological parameters were remarkable in N deficient conditions whereas the influence was insignificant in moderate high and toxic levels of nitrate supply. Membrane permeability, which indicates an electrolyte leakage of cell membrane due to cell integrity destruction, was the greatest in the most deficient NO
3supply (N-10). Compared with N-100, an electrolyte was leaked 1.8 and 1.3 times greater at 7 and 14 days, respectively, however any changes weren’t found in more than N-30. The lipid peroxidation (expressed as changes in content of MDA) showed the significance, which indicated 20 to 25% (445 to 493 nmol
g
-1, FW) increase more than N-100 (358 to 407 nmol g
-1, FW), in N deficient conditions. Ascorbate kept a similar level regardless of nitrate levels at 7 days, however, at 14 days, it showed marked increase in N-10, -30 and 400, which represented 4.69, 4.33 and 4.04 μmol g
-1, respectively, compared with N-100 (3.41 μmol
-1, FW). The activity of catalase, one of enzymatic anti-oxidants scavengers, was ranged from 4.05 to 4.46 μmol mg
-1protein min
-1without significant differences among treatments at 7 days. However, the activity was greatly reduced (1/2 level of first results) in more than N-100 at 14 days, whereas remained unchanged in N deficient conditions.
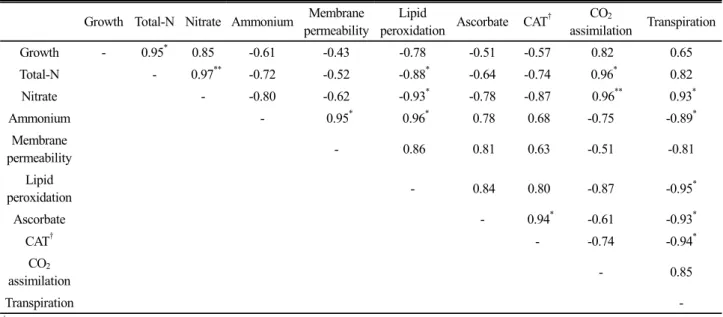
We also evaluated the relation between parameters
measured (Table 2) and found ideal indicators to predict
plant nitrogen status. Total nitrogen content used widely
to understand plant N status showed the positive relation
with growth (0.95
*), nitrate (0.97
**) and CO
2assimilation
rates (0.96
*), whereas the negative relation with lipid
peroxidation (-0.88
**). Nitrate also represented positive
Fig. 4. Timely changes in physiological indicators, membranes permeability, lipid peroxidation (MDA), ascorbate and catalase, in mid-fully expanded tomato leaves subject to different nitrate levels. Nitrate separately supplied with 10, 30, 100 (2.5 mM NO
3), 200 and 400 % based on the Hoagland nutrient N. Data represents means of six plants measured during light period (10 AM-14 PM).
(CO
2assimilation, 0.96
**; transpiration, 0.93
*) and negative (lipid peroxidation, -0.93
*) relations.
Discussion
The effectiveness of nitrate in the present experiment was reflected in the shoot growth (Fig. 1). Generally, it was well described that N deficiency entirely lead to reduced growth, small leaf development and yellowing, and high N, particularly high nitrate, resulted in nitrite production which was converted into nitric oxide (NO) and finally inhibited plant growth due to toxic effect (He et al., 2007, Nathawat et al., 2007; Tabatabaei et al., 2008, Chen et al., 2009). Under low nitrate, the growth of plants was strongly depressed compared with the control, especially 14 days, while tomato plants didn’t represent severe toxic symptoms under high nitrate. Nitrate accumulation in leaves was highly affected by nitrate supply rates (Fig. 2).
This is in agreement with the results of Cho et al (1996) who reported that nitrate in shoots and roots of radish was accumulated with an increase in nitrate supply. Petiole sap-based mineral concentrations (P, Ca and Mg) were strongly influenced by sampling time (Jang and Chung, 1997), while we confirmed that nitrate in leaves showed markedly stable value through different experiment.
Nitrate contents reached 50 mg g
-1in the control, and the
difference between the control and high nitrate supply was
not remarkable. This means that plant not only doesn’t
accumulate nitrate as a toxic form in organelles but also
regulates nitrate uptake from roots. Therefore, an optimal
level of nitrate in tomato leaves could be determined from
55 to 70 mg g
-1of fresh weight. In contrast, ammonium
was highly accumulated in the leaves under deficient N
conditions (Fig. 2). In general, nitrate absorbed under
deficient N condition is assimilated high proportion of
nitrate in roots, and this is well known as the plant-own
metabolism to minimize the energy consumption required
to translocate nitrate. Uptake of mineral elements is influenced
by the synergism or antagonism between ions. The results
presented in this work provide information about changes
in the mineral composition of young plants (Table 1). The
nitrate resulted in a decrease in P accumulation in leaves as
a result of antagonistic competence between NO
3-and
H
2PO
4-whereas led to an increase in K, Ca and Mg
accumulation through a synergism. Similar results were
obtained in a previous study (Aires et al., 2007) where
young broccoli contained macro elements, K, Ca and Mg,
in proportion with nitrate rates, while P contents remained
statistically unchanged. Significant changes in physiological
parameters measured in our work appeared in N deficient
Table 2. Correlation analysis between physiological parameters.
Growth Total-N Nitrate Ammonium Membrane permeability
Lipid
peroxidation Ascorbate CAT
†CO
2assimilation Transpiration
Growth - 0.95
*0.85 -0.61 -0.43 -0.78 -0.51 -0.57 0.82 0.65
Total-N - 0.97
**-0.72 -0.52 -0.88
*-0.64 -0.74 0.96
*0.82
Nitrate - -0.80 -0.62 -0.93
*-0.78 -0.87 0.96
**0.93
*Ammonium - 0.95
*0.96
*0.78 0.68 -0.75 -0.89
*Membrane
permeability - 0.86 0.81 0.63 -0.51 -0.81
Lipid
peroxidation - 0.84 0.80 -0.87 -0.95
*Ascorbate - 0.94
*-0.61 -0.93
*CAT
†- -0.74 -0.94
*CO
2assimilation - 0.85
Transpiration -
†