• 검색 결과가 없습니다.

Microstructure and Soft Magnetic Properties of Fe-6.5 wt.%Si Sheets Fabricated by Powder Hot Rolling

N/A
N/A
Protected

Academic year: 2021

Share "Microstructure and Soft Magnetic Properties of Fe-6.5 wt.%Si Sheets Fabricated by Powder Hot Rolling"

Copied!
6
0
0

로드 중.... (전체 텍스트 보기)

전체 글

(1)

ISSN 1225-7591(Print) / ISSN 2287-8173(Online)

Microstructure and Soft Magnetic Properties of Fe-6.5 wt.%Si Sheets Fabricated by Powder Hot Rolling

Myung Shin Kim, Do Hun Kwon, Won Sik Hong

a

, and Hwi Jun Kim *

Liquid Processing & Casting Technology R&D Department, Korea Institute of Industrial Technology, Incheon 21999, Republic of Korea

a

Electronic Convergence Materials & Device Research Center, Korea Electronics Technology Institute (KETI), Seongnam 13509, Republic of Korea

(Received April 4, 2017; Revised April 18, 2017; Accepted April 20, 2017)

···

Abstract Fe-6.5 wt.% Si alloys are widely known to have excellent soft magnetic properties such as high magnetic flux density, low coercivity, and low core loss at high frequency. In this work, disc-shaped preforms are prepared by spark plasma sintering at 1223 K after inert gas atomization of Fe-6.5 wt.% Si powders. Fe-6.5 wt.% Si sheets are rolled by a powder hot-rolling process without cracking, and their microstructure and soft magnetic properties are investigated.

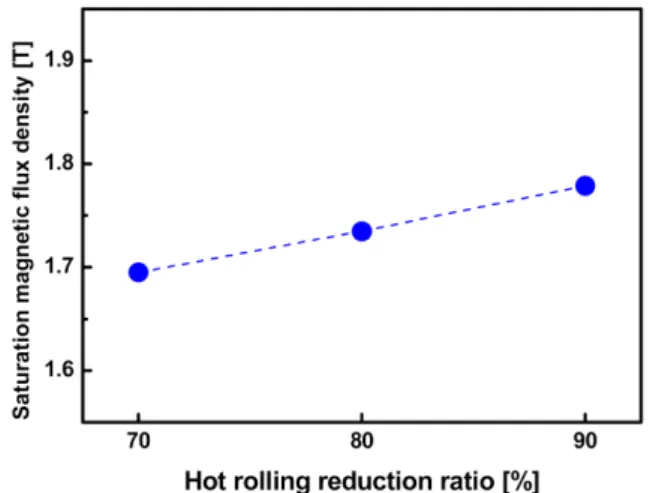
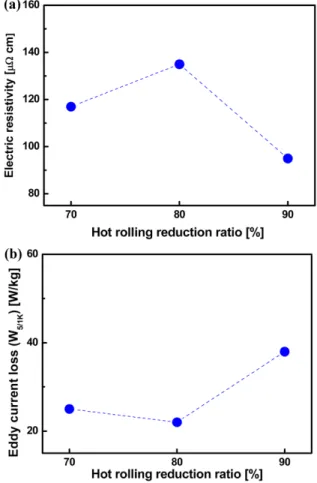
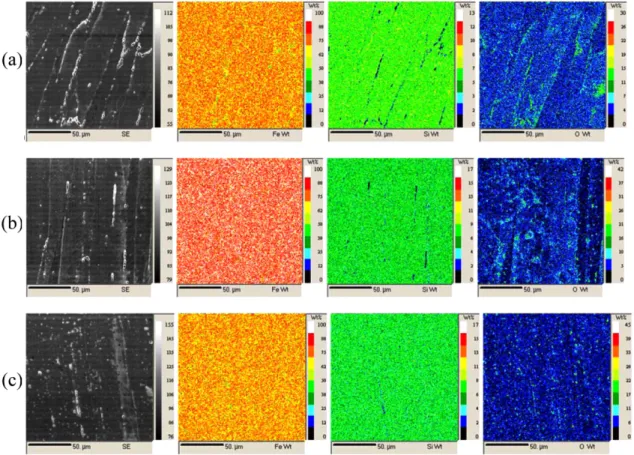
The microstructure and magnetic properties (saturation magnetization and core loss) of the hot-rolled Fe-6.5 wt.% Si sheets are examined by scanning electron microscopy, electron backscatter diffraction, vibration sample magnetometry, and AC B–H analysis. The Fe-6.5 wt.% Si sheet rolled at a total reduction ratio of 80% exhibits good soft magnetic properties such as a saturation magnetization of 1.74 T and core loss ( W

5/1000

) of 30.7 W/kg. This result is caused by an increase in the electrical resistivity resulting from an increased particle boundary density and the oxide layers between the primary particle boundaries.

Keywords: Fe-6.5 wt.%Si alloy, Atomized powder, Soft magnet property, Powder hot rolling, Core loss

···

1. Introduction

Fe-Si alloys are widely used as soft magnetic materials in motors, transformers and power generators. When the Si content reaches 6.5 wt.%, Fe-Si alloy has the best magnetic properties due to its high electrical resistivity, high permeability, low magnetocrystalline anisotropy and near zero magnetostriction, which result in low core losses and low noises [1, 2].

When the Si content increases, the material becomes too brittle to be rolled without cracking [3]. The main cause for brittleness is two kinds of ordered phases: B2 and DO3 [4], because antiphase boundaries prevent the cross slips of dislocations. Many researchers have attempted to suppress the ordered phases and fabricate Fe-6.5 wt.%Si thin sheet by various methods. Liang et al. [5] reported that hot, warm and cold rolling was successfully done to final thickness of 0.03-0.05 mm by proper rolling and

heat treatment process. The sheet was not fractured and exhibited good ductility between hot and cold rolling process. Researchers also investigated surface diffusion techniques in order to produce high Si steel sheet. The techniques are alternative routes to obtain high Si steel sheets without rolling problem. Yamaji et al. [6] pro- duced Fe-6.5 wt.%Si sheets by CVD technique in the NKK Corporation. This technique used a chemical reac- tion, SiCl

4

+ 5Fe = Fe

3

Si + 2FeCl

2

, on the basic material of cold rolled 3 wt.% Si steel.

Powder metallurgy is also applicable to fabricate high Si steel sheets. Li et al. [7] reported that Fe-6.5 wt.%Si alloy strip was fabricated by the direct powder rolling of the admixture containing 93.5 wt.%Fe powder and 6.5 wt.%Si powder. The strip exhibited excellent magnetic properties in high frequencies of 1-10 kHz. However the Fe-6.5 wt.%Si sheet fabricated by Fe-6.5 wt.%Si powder rolling have been little studied.

*Corresponding Author: Hwi Jun Kim, TEL: +82-32-850-0406, FAX: +82-32-850-0390, E-mail: [email protected]

(2)

In this work hot-rolled Fe-6.5 wt.%Si sheets were fab- ricated from SPSed preforms which were consolidated by spark plasma sintering process after gas atomizing Fe- 6.5 wt.%Si alloy into powders. Their microstructure and soft magnetic properties were investigated to study the effect of powder hot-rolling reduction and heat treatment on magnetic properties.

2. Experimental

Fe-6.5 wt.%Si powder was produced by a high pressure Ar gas atomization in a clean closed system. The atom- ized powders with the size range from 90 to 150 mm were consolidated to disc shaped preforms with a diameter of 50 mm and height of 10 mm by spark plasma sintering (SPS).

The SPSed preforms were canned by copper container with thickness of 3 mm and were hot rolled at 1173 K with total reduction ratio of 70, 80 and 90% for 4, 5 and 8 passes, respectively. The hot rolled sheets were annealed at 1273 K for 1h in flowing Ar atmosphere and were subse- quently quenched in water or liquid nitrogen to suppress the formation of ordered phases.

Magnetic properties were examined by vibration sam- ple magnetometer (VSM) and AC B-H analyzer. The specimens with a dimension of 1 ×2×4 mm were pre- pared to measure saturation magnetization in the field strength of 10 kA/m using VSM. The toroidal specimens with a dimension of Φ 18 mm outer diameter, Φ 8 mm inner diameter and 1 mm thickness were used to mea- sure the core losses in a frequency range of 50, 100, 400 and 1000 Hz and magnetic induction of 0.5 T by AC B- H analyzer. Microstructure observations were carried out by using scanning electron microscopy (SEM). Orienta- tions and boundaries of grains and particles were ana- lyzed by electron back-scattered diffraction (EBSD). The elements mappings of Fe, Si and O were carried out by an electron probe micro-analyzer (EPMA).

3. Results & discussion

3.1. Saturation magnetic flux density and core loss of Fe-6.5 wt.%Si sheets

Fig. 1 shows the variation of the saturation magnetic flux density with the total reduction ratio of hot rolled

sheets. Saturation magnetization is the intrinsic property of the material. Therefore all of the samples had almost the same saturation magnetization values of 188-191 emu/g, whereas saturation magnetic flux density gradually increased with total reduction ratio of hot rolling as shown in Fig. 1.

This result was caused by increase of relative density in Fe-6.5 wt.%Si sheets, which increased from 95.5% to 99.7% with total reduction range of 70-90%.

Fig. 2 shows the variation of core loss in magnetic induction of 0.5 T with frequency range of 50-1000 Hz in hot rolled Fe-6.5 wt.%Si sheets. When the total reduc- Fig. 1. Variation of saturation magnetic flux density in Fe- 6.5 wt.%Si sheets with total reduction ratio during hot rolling process.

Fig. 2. Variation of core loss of Fe-6.5 wt.%Si sheets in

magnetic induction of 0.5 T with total reduction during hot

rolling process ratio in the frequency range of 50, 100, 400

and 1000 Hz.

(3)

tion ratio increased from 70 to 80%, core loss (W

5/1000

) decreased about 10%, whereas when hot rolling reduc- tion increased from 80 to 90% core loss (W

5/1000

) increased by about 1.5 times. In order to investigate these changes, we needed to see more detailed changes in the core loss by dividing the total core loss to the hysteresis loss and the eddy current loss. The hysteresis loss is given by [8]

(1)

Where, W

h

is a B-H hysteresis loop area and f is the frequency. It is known that the hysteresis loss increases with existence of defects, impurities, grain boundaries, etc. because they prevent the magnetic domain wall movement [2].

As shown in Fig. 2, the hysteresis losses had almost same values at a specific frequency regardless of total reduction ratio of hot rolling. Therefore the differences of the total core losses were determined by the differences of the eddy current losses.

The eddy current loss is given by [8]

(2)

Where, B is amplitude of magnetic flux density, t is a sample thickness, ρ is the resistivity of the material and c is a constant. In this case f, B and t have fixed, so ρ is dominant factor to determine the eddy current loss. The electrical resistance is caused by the scattering of elec- trons due to disturbance in the crystal structure such as solute elements, impurities, grain boundaries, disloca- tions, etc [9]. Fig. 3 shows the variation of electrical resis- tivity with total reduction ratio in Fe-6.5 wt.%Si sheets.

The changes of electrical resistivity exhibited inverse ten- dency with the changes of eddy current loss, whereas they were similar to the changes of hysteresis loss. Because the factors increased the resistivity resulting from giving rise to electron scattering and also hindered movement of magnetic domain wall. However, especially in the high frequency range, the contribution of the eddy current loss to total core loss was higher than that of the hysteresis loss. It was because the latter was proportional to the fre- quency while the former was proportional to the square of frequency. Therefore the increase of electrical resistiv-

ity leading to the decrease of the eddy current loss is dominant factor to obtain low core loss at high fre- quency and we needed to know the causes that increased the electrical resistivity.

3.2. Microstructure of Fe-6.5 wt.%Si sheets

Fig. 4 shows EBSD grain boundary maps and IPF maps of hot rolled Fe-6.5 wt.%Si sheets at the total reduction ratio of 70, 80 and 90%, respectively. In Fig. 4(a)-(c), the black and red lines indicated high angle boundaries (HABs) that having misorientation angle θ > 15

o

and low angle boundaries (LABs) that having misorientation angle 2 ≤ θ ≤ 15

o

, respectively.

The increase of HAB density in the reduction range of 70-80% occurred due to the thickness reductions of not only particles but also particle boundaries during hot roll- ing process. In Fig. 4(a), each of primary particles hav- ing single orientation represented the fact that the grains P

h

= f W ×

h

[ W m ⁄

3

]

P

e

π

2

f

2

B

2

t

2

--- cρ

= [ W m ⁄

3

]

Fig. 3. Variation of (a) electrical resistivity and (b) eddy

current loss of Fe-6.5 wt.%Si sheets with total reduction

ratio during hot rolling process.

(4)

in the particle had grown as the size of one particle but it could not grow beyond the particle boundary. It was due to the particle boundaries were still imperfect and too thick to easily diffuse the atoms from the one particle to the other particle at the total hot rolling reduction of 70%. Fig. 4(b) shows the particle boundaries were com- pacted and LABs were created at the total reduction ratio of 80%. Additional hot rolling to 80% made the particle boundaries compact and crystallographic orientation sim- ilar. These tendencies were definitely displayed at total reduction ratio of 90%. In Fig. 4(c), the particle boundar- ies disappeared due to the merging of the particles and as a result the HAB density decreased. The particle bound-

ary disappearing was caused by high strain and develop- ment of rolling texture. The true strains with reductions of 70, 80 and 90% were 1.2, 1.6 and 2.3. When the reduction ratio increased from 80 to 90%, the increase of the true strain had much higher value than that of from 70 to 80%. So particle boundary disappearing was able to be clearly observed at total reduction ratio of 90%. The creations of LABs could be understood as traces of the disappeared particle boundaries.

It was known that the crystallographic orientations in

ferritic steels were assembled along <110>//RD orienta-

tions after rolling process. Therefore, with increasing hot

rolling reduction, the <110>//RD rolling texture was

Fig. 4. EBSD grain boundary maps of Fe-6.5 wt.%Si sheets from the direction of ND and EBSD IPF maps of Fe-6.5 wt.%Si

sheets from the direction of ND((d), (e), (f)) and RD((g), (h), (f)): sample A, B, C were rolled with total reduction ratio of 70%,

80% and 90%, respectively.

(5)

developed and each grains had similar orientations. It could be observed in EBSD IPF maps of Fig. 4(d)-(i).

Each of the colors in the maps represent εd the crystallo- graphic direction in the view of specific sample axis as ND, RD or TD. Fig. 4(d)-(f) were IPF ND maps and Fig.

4(g)-(i) were IPF RD maps. With increasing the total reduction ratio of hot rolling, the orientations were concen- trated around {112}<110> or {113}<110>. These orienta- tions were typical orientations in the <110>//RD rolling texture and the volume fractions of these orientations gradually increased with hot rolling reduction. The rolling texture development increased inter-particle coherency, it made merging of particles into one grain. Moreover, inner atoms of the primary powder were pushed out to the parti- cle boundary region because the area of the particle sur- face increased with particle aspect ratio during hot rolling. The calculated aspect ratios in reduction of 70, 80 and 90% were 11, 25 and 100, respectively. But the measured aspect ratio was less than the calculated value since the particle merging. Therefore, by increase of hot rolling reduction to 90%, many particles were merged

and particle boundaries tended to disappear. It was the main cause of electrical resistivity decreasing in the hot rolling reduction range of 80-90%.

Oxide layers on the particle boundaries also affect elec- trical resistivity because they can perform as the insula- tion layer [10]. Fig. 5 shows SEM micrographs and EDS dot mapping images of Fe, Si and O in the hot rolled Fe- 6.5 wt.%Si sheets with the total reduction ratio of 70, 80 and 90%, respectively. The initial atomized powder had thin oxide layer on the particle surface. As shown in Fig.

5(a)-(c), the oxide layers had broken and widely dis- persed with increasing hot rolling reduction in hot rolled Fe-6.5 wt.%Si sheets. The oxides distributed along parti- cle boundaries until the total reduction ratio of 80%. So they could perform as insulating layer and contributed to the increase of electrical resistivity. But when total reduc- tion increased to 90%, the oxides were homogeneously dispersed all over the material. It was related to disap- pearing of particle boundaries and less helpful to increase electrical resistivity than oxide distribution of 80% reduc- tion.

Fig. 5. SEM micrographs and EDS dot mapping images of Fe, Si and O in the hot rolled Fe-6.5 wt.%Si sheets with the total

reduction ratio of (a) 70, (b) 80 and (c) 90%, respectively.

(6)

4. Conclusions

Soft magnetic properties of Fe-6.5 wt.%Si alloy sheets fabricated by powder hot rolling process were investi- gated to study the effect of powder hot-rolling reduction and heat treatment on magnetic properties. To identify the differences of magnetic properties in Fe-6.5 wt.%Si sheets, electrical resistivity, microstructure, crystallo- graphic orientation and elements distribution were mea- sured and the following conclusions can be drawn.

(1) The saturation magnetic flux density increased with total reduction ratio of hot rolling due to the increase of density of the material. The particle boundaries in Fe-6.5 wt.%Si sheets were greatly compacted with increasing of hot rolling reduction.

(2) Core loss decreased with increasing of hot rolling reduction except the case of hot rolling reduction range from 80 to 90%. The decrease of core loss were caused by the increase of electrical resistivity that made the eddy current loss lower. The increase of HAB density with hot rolling reduction was main cause of the increase of the electrical resistivity.

(3) When total reduction ratio of hot rolling increased from 80 to 90%, core loss increased with showing the inverse tendency with others. It was the result of particle boundary disappearing. The development of rolling tex- ture and high strain made the particle boundary disap- peared and particles merged. Therefore electrical resistivity decreased with HAB density that made core loss higher.

(4) The oxides made some contribution to increase electrical resistivity. The oxide layer on the initial pow-

der surface was broken and dispersed during hot rolling process.

Acknowledgements

This work was supported by the Energy Technology Development Program (Project No. 20145020300900) funded from the Ministry of Trade, Industry and Energy (MOTIE) through the Korea Institute of Energy Technol- ogy Evaluation and Planning (KETEP).

References

[1] R. M. Bozorth: Ferromagnetism, Van Nostrand, New York, 1951.

[2] B. D. Cullity and C. D. Graham: Introduction to Magnetic Materials, 2nd ed., John Wiley & Sons, Inc., New Jersey, 2009.

[3] Y. Sato, T. Sato and Y. Okazaki: Mater. Sci. Eng., A, 99 (1988) 73.

[4] B. Viala, J. Degauque, M. Baricco, E. Ferrara, M.

Pasquale and F. Fiorillo: J. Magn. Magn. Mater., 160 (1996) 315.

[5] Y. F. Liang, F. Ye, J. P. Lin, Y. L. Wang and G. L. Chen: J.

Alloys. Compd., 491 (2010) 268.

[6] T. Yamaji, M. Abe, Y. Takada, K. Okada and T. Hiratani:

J. Magn. Magn. Mater., 133 (1994) 187.

[7] R. Li, Q. Shen, L. Zhang and T. Zhang: J. Magn. Magn.

Mater., 281 (2004) 135.

[8] Jiten Das, K. Chandra, P. S. Misra and B. Sarma: J.

Magn. Magn. Mater., 320 (2008) 906.

[9] S. Nagarjuna, K. Balasubramanian and D. S. Sarma: Mater.

Sci. Eng. A, 225 (1997) 118.

[10] P. Jang and B. Lee: IEEE Trans. Magn., 45 (2009) 2781.

수치

Fig. 1 shows the variation of the saturation magnetic flux density with the total reduction ratio of hot rolled
Fig. 4 shows EBSD grain boundary maps and IPF maps of hot rolled Fe-6.5 wt.%Si sheets at the total reduction ratio of 70, 80 and 90%, respectively
Fig. 5. SEM micrographs and EDS dot mapping images of Fe, Si and O in the hot rolled Fe-6.5 wt.%Si sheets with the total reduction ratio of (a) 70, (b) 80 and (c) 90%, respectively.

참조

관련 문서

Si 마이크로머시닝(mi cromachi ni ng)은 마이크로 열센서(thermalmi crosensor)나 가스 센서의 발달에 영향을 주고 있다 1-3) .현재까지 pol y Si 4) ,Si C 5) ,Ni Fe Al l oy 6) ,Ni

In this study, sequential solvent fractions of hot water extract and 70% ethanol extract were prepared from domestic (Imsil region) and foreign (Chile

 Polymers containing amide, ester, or urethane may be attacked by hot acids or alkalies, and hydrolyzed.. 

The fabrication of transparent spinel using LiF as a sintering aid by hot pressing process was investigated in this study.. Spinel is widely regarded as one of the

5.16 Overall heat transfer coefficient and convective heat transfer coefficient of hot side according to mass flow rate and inlet temperature (High temperature condition)

That is, the dry powder of the sludge wastes, generated during the decommissioning of nuclear power plants, were compacted, and a study, focused on

Mean Value and Skin Improvement Effect that Prepare of 50 year-old Korean by Black Soybean Powder E xtract Applied to the Human Skin ……… 32 Fig.. Correlation

Fig.11 Temperature histories of the hot side and cold side heat exchangers according to time with speaker power(10W).. Fig.12 Temperature histories of the hot