Original Article
Assessment of the Cerebrospinal Fluid Effect on the Chemical Exchange Saturation Transfer Map Obtained from the Full Z-Spectrum in the Elderly Human Brain
Soonchan Park1 , Joon Jang2 , Jang-Hoon Oh2 , Chang-Woo Ryu1 , Geon-Ho Jahng1
1Department of Radiology, Kyung Hee University Hospital at Gangdong, College of Medicine, Kyung Hee University, Seoul, 2Department of Biomedical Engineering, Kyung Hee University, Yongin, Korea
Received 2 October 2019 Revised 3 November 2019 Accepted 4 November 2019
Corresponding author Geon-Ho Jahng ([email protected]) Tel: 82-2-440-6187 Fax: 82-2-440-6932
Soonchan Park and Joon Jang contributed equally to this work.
Purpose: With neurodegeneration, the signal intensity of the cerebrospinal fluid (CSF) in the brain increases. The objective of this study was to evaluate chemical exchange saturation transfer (CEST) signals with and without the contribution of CSF signals in elderly human brains using two different 3T magnetic resonance imaging (MRI) sequences
Methods: Full CEST signals were acquired in ten subjects (Group I) with a three-dimensional (3D)-segmented gradient-echo echo-planar imaging (EPI) sequence and in ten other subjects (Group II) with a 3D gradient and spin-echo (GRASE) sequence using two different 3T MRI systems. The segmented tissue compartments of gray and white matter were used to mask the CSF signals in the full CEST images. Two sets of magnetization transfer ratio asymmetry (MTRasym) maps were obtained for each offset frequency in each subject with and without masking the CSF signals (masked and unmasked conditions, respectively) and later compared using paired t-tests.
Results: The region-of-interest (ROI)-based analyses showed that the MTRasym values for both the 3D-segmented gradient-echo EPI and 3D GRASE sequences were altered under the masked condition compared with the unmasked condition at several ROIs and offset frequencies.
Conclusions: Depending on the imaging sequence, the MTRasym values can be overestimated for some areas of the elderly human brain when CSF signals are unmasked. Therefore, it is necessary to develop a method to minimize this overestimation in the case of elderly patients.
Keywords: CEST, Cerebrospinal fluid signal, MTR asymmetry, Sequence type, Brain-tissue degeneration
Copyright © 2019 Korean Society of Medical Physics
CCThis is an Open-Access article distributed under the terms of the Creative Commons Attribution Non-Commercial License (http://creativecommons.org/licenses/by- nc/4.0) which permits unrestricted non-commercial use, distribution, and reproduction in any medium, provided the original work is properly cited.
Introduction
Chemical exchange saturation transfer (CEST) imaging is, which is a recently developed MRI contrast approach for imaging molecules and proteins in the body.1) The technique helps indirectly detect low-concentration com- pounds with exchangeable protons via the varying bulk- water proton signal from saturation transfer.2-4) The basic principle of CEST MRI involves selectively saturating an
exchangeable solute proton that resonates at a frequency different from that of the bulk-water proton by applying a radiofrequency (RF) pulse.5) This saturated solute proton is subsequently exchanged with a bulk-water proton, and the solute proton is replaced by a non-saturated water proton, since the number of bulk-water protons is much greater than that of solute protons. This phenomenon slightly re- duces the water signal intensity. If the saturation time is sufficiently long, the RF pulse enhances this signal attenu-
Progress in Medical Physics 30(4), December 2019 https://doi.org/10.14316/pmp.2019.30.4.139 eISSN 2508-4453
ation from the saturation effect, which eventually becomes quantifiable by measuring the decreased water signal, thereby allowing indirect imaging of low-concentration solutes. The frequency-dependent saturation effects are visualized as a signal loss at a specific frequency, known as a Z-spectrum6) or CEST spectrum. The saturation ef- fects are asymmetric with respect to the water resonance frequency and can be quantified by performing an asym- metry analysis, wherein the water signals from either side of the Z-spectrum are subtracted from each other. A CEST asymmetry map called the magnetization transfer ratio asymmetry (MTRasym) map is generally used to evaluate the CEST effects.
Targeted, endogenously exchangeable, solute protons already exist in molecules within the human body, includ- ing amide (–NH), amine (–NH2), guanidine ([NH2]2), and hydroxyl (–OH) groups, with optimal exchange properties under physiological conditions.7) Unlike exogenous CEST sources, endogenous CEST sources do not lead to prob- lems associated with injection or toxicity. Moreover, if the properties of certain endogenous CEST sources change in a specific disease state, they can serve as useful imag- ing biomarkers for the early diagnosis of diseases. For example, amino acids contain amide, amine, guanidine, and/or hydroxyl protons that are constituents of amyloid- beta proteins, which accumulate in the brains of patients with Alzheimer’s disease.8,9) Furthermore, the levels of myo-inositol, which is a metabolite in the brain containing hydroxyl protons, have been reported to be greater in the brains of patients with Alzheimer’s than in the brains of healthy control subjects.10) Thus, CEST MRI can play a key role in investigating brain changes in patients with neuro- degenerative diseases. However, brain degeneration results in tissue loss,11) leading to perivascular spaces, which are usually replaced by cerebrospinal fluid (CSF). Owing to the contribution of the CSF signal, the CEST asymmetry value is usually high near the ventricular area or the perivascular space, because the CSF effects tend to give higher signals particularly near the direct water saturation frequency.4) Therefore, obtaining accurate CEST effects on the gray and white matter is difficult because of the contribution of CSF in the elderly human brain.12) No study has investigated the contribution of CSF to CEST signals in the brain of an
elderly subject.
The objective of this study, therefore, was to evaluate the CEST asymmetry with and without the contribution of CSF signals in the elderly human brain using two different 3T MRI sequences. We hypothesized that the CEST asymme- try value without masking the CSF signals (unmasked con- dition) would be greater than that with masking (masked condition).
Materials and Methods
1. Subjects
This study was approved by the ethical committee of the Institutional Review Board of Kyung Hee University Hospi- tal at Gangdong (No. 2015-02-006-001). Written informed consent was obtained by all participants enrolled. Twenty subjects were studied using two different sequences. Ten subjects (Group I) were scanned with a three-dimensional (3D)-segmented gradient-echo echo-planar imaging (EPI) sequence to obtain full Z-spectrum signals using a 3T MRI system (Achieva 3.0T; Philips, Amsterdam, Netherlands).
All the subjects were woman. Ten other subjects (Group II) were scanned with a 3D gradient and spin-echo (GRASE) sequence to obtain full Z-spectrum signals using another 3T MRI system (Ingenia 3.0T; Philips). In this group, eight were women and two were men. The subjects were recruit- ed for optimizing the CEST MRI techniques employed in Kyung Hee University Hospital at Gangdong to ultimately apply this technique for imaging the brain of patients with Alzheimer’s disease. Table 1 lists the characteristics of the subjects and the CEST signal acquisitions.
2. MRI acquisition
The first full Z-spectrum data were acquired with the 3D- segmented gradient-echo EPI sequence13) using an eight- channel sensitivity-encoding (SENSE) coil. To induce CEST saturation exchange, we set the B1 amplitude of the saturation pulse as 1 μT; the saturation pulse duration per pulse as 70 ms; and the total number of shots to the center of the k-space as 126. Therefore, the total saturation length was 8.8 seconds. We obtained the full Z-spectrum via 29
dynamics at offset frequencies ranging from –6.00 ppm to 6.00 ppm with a continuously increasing frequency in- terval of 0.43 ppm. The first acquired image was the refer- ence image S0 obtained at an offset frequency of –40. The imaging parameters were as follows: repetition time (TR)/
echo time (TE)=150/7.1 ms; acquisition matrix=112×112;
acquisition voxel size=2×2×6.40 mm3; reconstruction voxel size=0.76×0.76×3.20 mm3; EPI factor=9; flip angle (FA)=7°; field of view (FOV)=220×220×06 mm3; SENSE factor=2 for the anterior-posterior direction and 1 for the right-left direction; number of slices=33; and imaging orientation=transverse. The scan time was 567 seconds.
The second full Z-spectrum data were acquired with the 3D GRASE sequence14) by using a 32-channel SENSE coil.
To induce CEST saturation exchange, we set the B1 ampli- tude as 2 μT; the saturation pulse duration as 200 ms with a 10-ms interval between the pulses; and the number of saturation pulses as 4. Therefore, the total saturation length was 0.83 seconds. We obtained the full Z-spectrum via 37 dynamics at offset frequencies ranging from –5.00 ppm to 5.00 ppm with an alternatively increased frequency interval of 0.25 ppm at offset frequencies ranging from ±0.25 ppm to ±4.00 ppm and thereafter acquired the images at offset frequencies of ±4.5 ppm and ±5.0 ppm. The first acquired
image was the reference image S0 at –40 ppm, and the sec- ond acquired image was taken at an offset of 0 ppm with respect to the direct saturation of water. The imaging pa- rameters were as follows: TR/TE=2200/16 ms; acquisition matrix=104×92; acquisition voxel size=2×2×8 mm3; recon- struction matrix size=1×1×4 mm3; FA=90°; SENSE factor=2 for the anterior-posterior direction and 1 for the right-left direction; turbo spin-echo (TSE) factor=23; EPI factor=7;
number of slices=23; and imaging orientation=transverse.
The scan time was 509 seconds.
Finally, for image registration and brain-tissue segmen- tation, sagittal structural 3D T1-weighted (T1W) images were acquired with the magnetization-prepared rapid ac- quisition of the gradient echo sequence with the following parameters: TR=8.1 ms; TE=3.7 ms; FA=8°; FOV=236×236 mm2; and voxel size=1×1×1 mm3. In addition, T2-weighted TSE and fluid-attenuated inversion recovery images were acquired to examine any brain malformations.
3. Pre-processing of the full Z-spectrum for CSF signals analysis
The MRI data were analyzed using MATLAB (http://
www.mathworks.com) (MathWorks, Natick, MA, USA) and Statistical Parametric Mapping Version 12 (SPM12) (http://
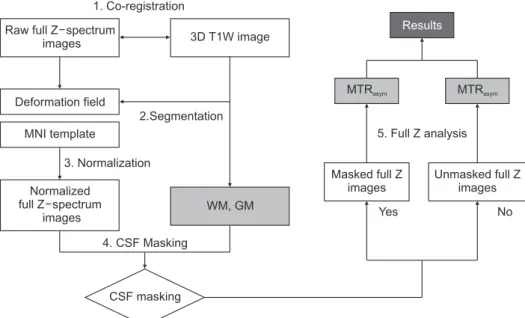
www.fil.ion.ucl.ac.uk/spm/) (Wellcome Trust Centre for Neuroimaging, London, UK). Fig. 1 shows the pre-process- ing steps of the 3D T1W and full Z-spectrum images. First, the 3D T1W and full Z-spectrum images were co-registered.
Second, the 3D T1W images were segmented into gray and white matter using the CAT12 toolbox (http://www.neuro.
uni-jena.de/cat/) (Structural Brain Mapping Group, Jena, Germany) to obtain brain-tissue compartments. Third, the co-registered full Z-spectrum images for each subject were spatially normalized into a Montreal Neurological Institute (MNI) brain template using the subject’s deformation field information obtained from the brain-tissue-segmentation step of the 3D T1W image. Finally, the CSF signal in the full Z-spectrum images was masked using information from the segmented gray- and white-matter tissue com- partments to evaluate the full Z-spectrum images while minimizing the contributions of the CSF signals. We only included voxels that had more than 50% gray and white Table 1. Characteristics of subjects and the chemical exchange sa-
turation transfer signal acquisitions
Variables Group I Group II
Subjects (n) 10 10
Mean age (y) 72.3±9.82 73.3±7.36
Age range (y) 55–83 59–87
Magnetic field (T) 3.0 3.0
Model of MRI system Achieva Ingenia
Sequence name 3D-segmented GE EPI 3D GRASE Saturation B1
amplitude (µT)
1 2
Saturation pulse duration (ms)
70 200
Total saturation duration (s)
8.8 0.84
Saturation method Continuous Alternative
Full Z-scans (n) 29 37
Scan time (s) 567 509
T, Tesla; MRI, magnetic resonance imaging; 3D, three-dimen- sional; GE, gradient-echo; EPI, echo-planar imaging; GRASE, gradient and spin-echo.
matter because voxels with more than 50% CSF are usually of no interest in some clinical evaluations. After this pre- processing step, we obtained the MTRasym map, which is the CEST asymmetry map.
4. Mapping of MTRasym from full Z-spectrum data
We created two sets of MTRasym maps for each offset fre- quency for each subject using the pre-processed full Z- spectrum data in the masked and unmasked conditions by employing the following steps. The spatially normalized full Z-spectrum images in the masked and unmasked con- ditions were divided by the reference image S0 obtained at an offset frequency of –40 ppm. To determine the offset frequency for the minimum signal, the B0 inhomogeneity correction step was performed using the 10th degree poly- nomial fitting,15) assuming that the actual water resonance was at the frequency with the lowest signal intensity and excluding the fat-dominate voxels. The water resonance frequency was estimated as the frequency with the lowest signal intensity from the fitted curve and shifted along the direction of the offset axis to 0 ppm at its lowest intensity
on a voxel-by-voxel basis. The MTRasym maps with respect to the water frequency under the masked and unmasked conditions were obtained using the following equation:3,16)
ω ω
MTRasym (1)
Here, Δω is the frequency difference with respect to wa- ter, Ssat is the signal with the saturation pulse, and S0 is the signal observed without any saturation pulse. Usually, the CEST effect from the solute protons is detected at a fre- quency lower than 6 ppm with respect to water. We used the MTRasym maps obtained at 0.86, 2.14, 3.00, and 3.43 ppm for the 3D-segmented gradient-echo EPI data and those obtained at 1, 2, 3.0, and 3.5 ppm for the 3D GRASE data.
5. Statistical analyses of MTRasym maps
The MTRasym maps obtained in the masked and un- masked conditions for each subject were smoothed using a Gaussian smoothing kernel at a full-width half maximum
1. Co-registration Raw full Z spectrum
images 3D T1W image
Results
MTRasym
5. Full Z analysis
Masked full Z images
Unmasked full Z images
Yes No
MTRasym Deformation field
MNI template
3. Normalization
2.Segmentation
4. CSF Masking
CSF masking
WM, GM Normalized
full Z spectrum images
Fig. 1. Processing steps of the full Z-spectrum data to map magnetization transfer ratio asymmetry (MTRasym). For pre-processing, we included co-registration between the three-dimensional (3D) T1-weighted (T1W) and full Z-spectrum images, brain-tissue segmentation of the 3D T1W image, and spatial normalization of the co-registered full Z-spectrum images. In the normalized full Z-spectrum images, the cerebrospinal fluid (CSF) signals were masked. The MTRasym maps were calculated after B0 correction. Finally, statistical analyses were performed to compare the MTRasym maps obtained with and without masking the CSF signals. MNI, Montreal Neurological Institute;
WM, white matter; GM, gray matter.
of 8×8×8 mm3. We compared the MTRasym maps obtained in the masked and unmasked conditions using voxel- based and region-of-interest (ROI)-based methods. For the voxel-based analysis, the MTRasym value in each voxel was compared between the masked and unmasked conditions using paired t-tests for each offset frequency and for each sequence, separately. A significance level of P=0.001 was applied without correcting for multiple comparisons in clusters with at least 30 contiguous voxels. This voxel-wise analysis was performed to define the ROIs in the brain.
The ROIs were defined at Brodmann area (BA) 10, BA21, cerebellar tonsil, declive, precuneus, and thalamus based on the results of the voxel-based analysis using the WFU
PickAtlas toolbox (http://fmri.wfubmc.edu/software/
pickatlas) (Radiology Informatics and Imaging Laboratory, Winston-Salem, NC, USA). BA10 is the anterior portion of the prefrontal cortex in the human brain, which includes the frontopolar, rostrolateral, and anterior prefrontal cor- texes. BA21 is the part of the middle temporal gyrus. The ventricles were not selected as ROIs because many of the CSF signals in the ventricles were masked; hence, the dif- ferences in the ventricles were natural. The MTRasym values for each ROI and at the four offset frequencies were ob- tained using the MarsBaR toolbox (http://marsbar.source- forge.net/). The normal distribution of the MTRasym values for each ROI was tested using the Kolmogorov-Smirnov
Magnitude 0.86 ppm 2.14 ppm 3.00 ppm 3.43 ppm
a
b
83%
67%
Magnitude 0.86 ppm 2.14 ppm 3.00 ppm 3.43 ppm
55%
%
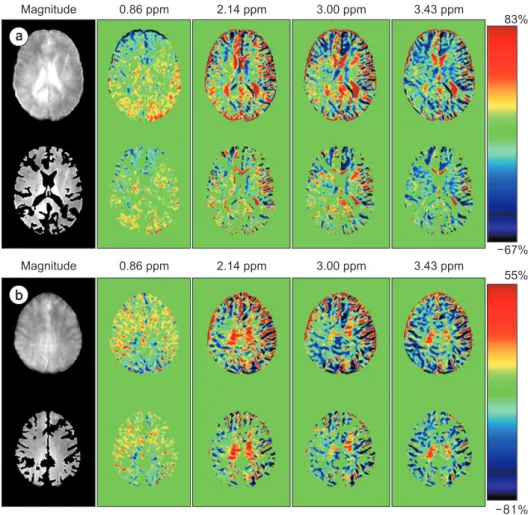
Fig. 2. Representative magnetization transfer ratio asymmetry (MTRasym) maps acquired at four different offset frequencies and the corresponding reference image obtained without (top) and with (bottom) masking the cerebrospinal fluid (CSF) signals of the ventricle (a) and cortex levels (b) with the three-dimentional-segmented gradient-echo echo-planar imaging sequence. The MTRasym maps were obtained at the offset frequencies 0.86, 2.14, 3.00, and 3.43 ppm. In the MTRasym map, the color bar indicates the MTRasym value in percentage. The MTRasym values for the ventricle and perivascular space area were higher under the unmasked condition than that under masked condition. The MTRasym values for the ventricles and around the ventricles were higher under the unmasked condition than that under the masked CSF signals.
method. Paired t-tests were used to compare the MTRasym
values between the masked and unmasked conditions for each ROI and each offset frequency. The results were regarded as significant if the two-tailed probability of the results was lower than 0.05. MedCalc (MedCalc Software, Ostend, Belgium) was used for the statistical analysis.
Results
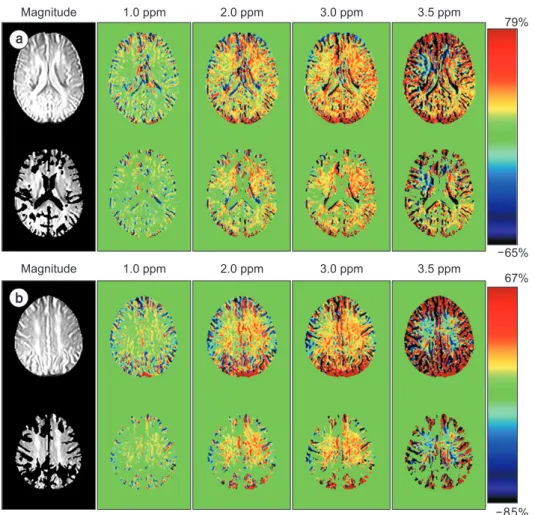
Fig. 2 shows the representative MTRasym maps acquired at four offset frequencies with the 3D-segmented gradient- echo EPI sequence. Fig. 3 shows the ones with the 3D GRASE sequence from the levels of the ventricle and cortex in the brain. Overall, the MTRasym values were higher in the unmasked condition than in the masked condition,
particularly for the periventricular white matter, areas near the perivascular space, and the ventricle. In addition, the MTRasym map obtained with the 3D GRASE sequence seems to be overestimated compared with that obtained with the 3D-segmented gradient-echo EPI sequence.
1. Voxel-based analysis
In the 3D-segmented gradient-echo EPI sequence, the MTRasym values in the unmasked condition were higher than those in the masked condition at offset frequencies of 0.86 ppm and 2.14 ppm (Supplementary Fig.1). However, the MTRasym values in the unmasked condition were higher or lower than those in the masked condition at 3 ppm and 3.43 ppm frequencies as listed in Supplementary Table 1,
Magnitude 1.0 ppm 2.0ppm 3.0 ppm 3.5 ppm
a
b
79%
65%
Magnitude 1.0ppm 2.0ppm 3.0 ppm 3.5 ppm
67%
%
Fig. 3. Representative magnetization transfer ratio asymmetry (MTRasym) maps at acquired at four different offset frequencies and the corresponding reference image obtained without (top) and with (bottom) masking the cerebrospinal fluid (CSF) signals at the ventricle (a) and cortex levels (b) with the three-dimentional gradient and spin-echo sequence. The MTRasym maps were obtained at offset frequencies of 1.0, 2.0, 3.0, and 3.5 ppm. In the MTRasym map, the color bar indicates the MTRasym value in percentage. In general, the MTRasym values for the areas of the brain were higher without masking the CSF signals (unmasked condition) than that with masking (masked condition).
which summarizes the result of the voxel-based compari- sons of the MTRasym maps between the masked and un- masked conditions in the 3D-segmented gradient-echo EPI sequence.
For the 3D GRASE sequence, only a few areas showed significant differences in the MTRasym values between the two conditions. The MTRasym values were greater in the unmasked condition than in the masked condi- tion for the right inferior semi-lunar lobule (Talairach coordinates=1.13, –58.93, and –36.42; cluster size=66;
Z-score=3.29) at an offset frequency of 2.14 ppm offset frequency and for the left precuneus (Talairach coor- dinates=0.32, –64.94, and 25.16; cluster size=434; Z- score=3.89) at an offset frequency of 3.00 ppm. No sig- nificant differences were observed in the MTRasym values between the two conditions at other offset frequencies. Fi- nally, all areas showed lower MTRasym values in the masked
condition than in the unmasked condition.
2. ROI-based analysis
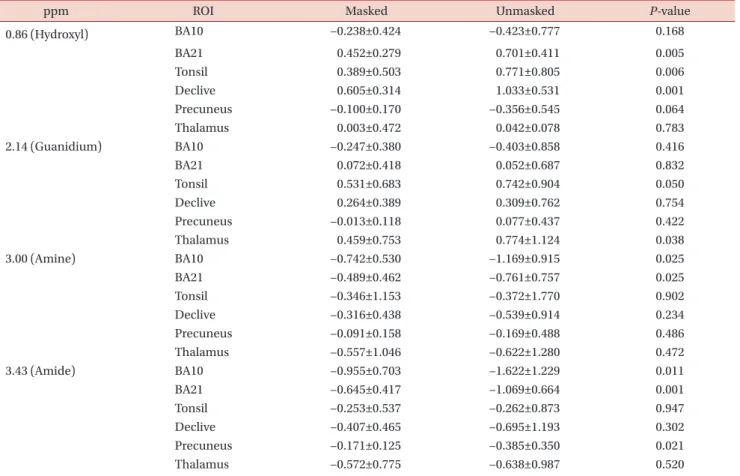
Table 2 summarizes the results of the ROI-based com- parisons of the MTRasym values between the masked and unmasked conditions for each ROI and for each offset frequency obtained with the 3D-segmented gradient-echo EPI sequence. The MTRasym values were higher in the un- masked condition than in the masked condition at offset frequencies of 0.86, 2.14, 3.00, and 3.43 ppm. The MTRasym
values were significantly different between the masked and unmasked conditions for the following brain regions:
BA21, tonsil, and declive at 0.86 ppm; tonsil and thalamus at 2.14 ppm, indicating the presence of guanidium protons;
BA10 and BA21 at 3.00 ppm, indicating the presence of amines; and BA10, BA21, and precuneus at 3.43 ppm.
Table 2. Results of ROI-based analyses of MTRasym values (percent) obtained from a 3D-segmented gradient-echo EPI sequence
ppm ROI Masked Unmasked P-value
0.86 (Hydroxyl) BA10 −0.238±0.424 −0.423±0.777 0.168
BA21 0.452±0.279 0.701±0.411 0.005
Tonsil 0.389±0.503 0.771±0.805 0.006
Declive 0.605±0.314 1.033±0.531 0.001
Precuneus −0.100±0.170 −0.356±0.545 0.064
Thalamus 0.003±0.472 0.042±0.078 0.783
2.14 (Guanidium) BA10 −0.247±0.380 −0.403±0.858 0.416
BA21 0.072±0.418 0.052±0.687 0.832
Tonsil 0.531±0.683 0.742±0.904 0.050
Declive 0.264±0.389 0.309±0.762 0.754
Precuneus −0.013±0.118 0.077±0.437 0.422
Thalamus 0.459±0.753 0.774±1.124 0.038
3.00 (Amine) BA10 −0.742±0.530 −1.169±0.915 0.025
BA21 −0.489±0.462 −0.761±0.757 0.025
Tonsil −0.346±1.153 −0.372±1.770 0.902
Declive −0.316±0.438 −0.539±0.914 0.234
Precuneus −0.091±0.158 −0.169±0.488 0.486
Thalamus −0.557±1.046 −0.622±1.280 0.472
3.43 (Amide) BA10 −0.955±0.703 −1.622±1.229 0.011
BA21 −0.645±0.417 −1.069±0.664 0.001
Tonsil −0.253±0.537 −0.262±0.873 0.947
Declive −0.407±0.465 −0.695±1.193 0.302
Precuneus −0.171±0.125 −0.385±0.350 0.021
Thalamus −0.572±0.775 −0.638±0.987 0.520
Negative numbers indicate higher signals at the negative offset frequency. Data are presented as mean±standard deviation.
ROI, region-of-interest; MTRasym, magnetization transfer ratio asymmetry; 3D, three-dimentional; EPI, echo-planar imaging; BA, Brodmann area.
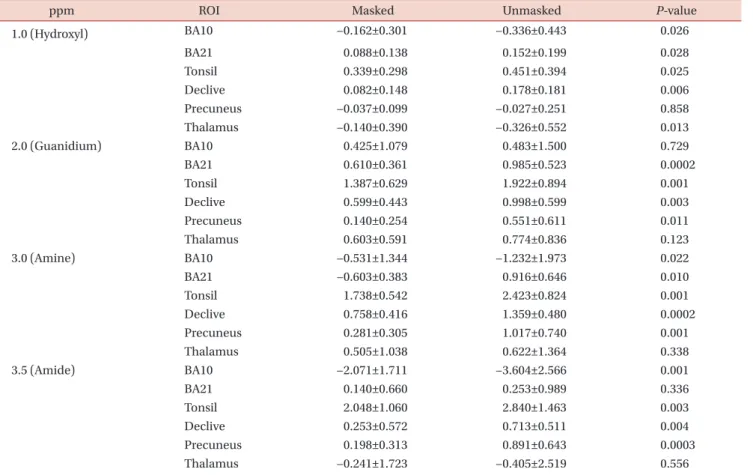
Table 3 summarizes the results of the ROI-based com- parisons of the MTRasym values between the masked and unmasked conditions for each ROI and for each offset fre- quency obtained with the 3D GRASE sequence. Significant differences in the MTRasym values between the two condi- tions were observed for the following brain areas: all ROIs except the precuneus at 1.0 ppm, indicating the presence of hydroxyl protons; all ROIs except BA10 and thalamus at 2.0 ppm; all ROIs except thalamus at 3.0 ppm; and all ROIs except BA21 and thalamus at 3.5 ppm, indicating the pres- ence of amides.
Discussion
The perivascular space widens with the loss of brain-tis- sue. We investigated the MTRasym values in elderly subjects after masking the CSF signals in the brain. The MTRasym
values for certain brain areas were significantly different between the masked and unmasked conditions at the am- ide and amine offset frequencies. The difference depended on the sequence type used.
1. CSF signals affect MTRasym values
We found significant contributions of the CSF signals to the MTRasym map, which overestimated the MTRasym val- ues in the elderly human brain. The MTRasym values were altered with the masking of the CSF signals, irrespective of the saturation offset frequency with respect to water. In elderly subjects, the overestimation of the MTRasym values due to the changes in the CSF signals could be attributed to brain atrophy, which results in widening of the perivascu- lar spaces, which are basically CSF spaces. To obtain accu- rate CEST effects in the elderly brain, the CSF signal should Table 3. Results of ROI-based analyses of MTRasym values (percent) obtained from a 3D GRASE sequence
ppm ROI Masked Unmasked P-value
1.0 (Hydroxyl) BA10 −0.162±0.301 −0.336±0.443 0.026
BA21 0.088±0.138 0.152±0.199 0.028
Tonsil 0.339±0.298 0.451±0.394 0.025
Declive 0.082±0.148 0.178±0.181 0.006
Precuneus −0.037±0.099 −0.027±0.251 0.858
Thalamus −0.140±0.390 −0.326±0.552 0.013
2.0 (Guanidium) BA10 0.425±1.079 0.483±1.500 0.729
BA21 0.610±0.361 0.985±0.523 0.0002
Tonsil 1.387±0.629 1.922±0.894 0.001
Declive 0.599±0.443 0.998±0.599 0.003
Precuneus 0.140±0.254 0.551±0.611 0.011
Thalamus 0.603±0.591 0.774±0.836 0.123
3.0 (Amine) BA10 −0.531±1.344 −1.232±1.973 0.022
BA21 −0.603±0.383 0.916±0.646 0.010
Tonsil 1.738±0.542 2.423±0.824 0.001
Declive 0.758±0.416 1.359±0.480 0.0002
Precuneus 0.281±0.305 1.017±0.740 0.001
Thalamus 0.505±1.038 0.622±1.364 0.338
3.5 (Amide) BA10 −2.071±1.711 −3.604±2.566 0.001
BA21 0.140±0.660 0.253±0.989 0.336
Tonsil 2.048±1.060 2.840±1.463 0.003
Declive 0.253±0.572 0.713±0.511 0.004
Precuneus 0.198±0.313 0.891±0.643 0.0003
Thalamus −0.241±1.723 −0.405±2.519 0.556
Negative numbers indicate higher signals at the negative offset frequency. Data are presented as mean±standard deviation.
ROI, region-of-interest; MTRasym, magnetization transfer ratio asymmetry; 3D, three-dimentional; GRASE, gradient and spin-echo; BA, Brodmann Area.
be masked either using some post-processing technique or using some data acquisition method, e.g., an inversion-re- covery preparation. This corrected MTRasym value might be valuable for evaluating brain metabolites in patients with neurodegenerative diseases.17,18) For the amide and amine protons, the results of the ROI-based analyses showed that the MTRasym values for the thalamus were not significantly different between the two conditions for both the sequenc- es, whereas the values were significantly different for the precuneus. Several previous studies have reported brain atrophy at the precuneus in elderly subjects, but not at the thalamus.11) Our result, therefore, showed that the differ- ence in the MTRasym values between the two conditions could be related to CSF contributions in the CEST signals rather than to an artifact. Some regions showed a differ- ence in the MTRasym values between the unmasked and masked conditions only at the hydroxyl offset frequency.
This indicates that it is difficult to accurately measure the MTRasym value at this offset frequency using a 3T MRI sys- tem because of the proximity to water.
2. CSF contribution to MTRasym value depends on the acquired sequence type
The MTRasym values acquired using the two sequences were sensitive to the contribution of the CSF signals. For the 3D-segmented gradient-echo EPI sequence, we used a relatively lower power saturation pulse than that used for the 3D GRASE sequence. At the amide offset frequency, the MTRasym values were significantly different between the two conditions for BA10, BA21, and precuneus in the case of the EPI sequence, but for BA10, tonsil, declive, and precuneus in the case of the GRASE sequence. At the amine offset frequency, the MTRasym values were signifi- cantly different between the two conditions only for BA10 and BA21 with the EPI sequence, but at all the ROIs except the thalamus with the GRASE sequence. These differences could be attributed to the fact that the 3D GRASE sequence more strongly reflects the effect of the CSF signal than the 3D EPI sequence. The GRASE sequence is used in multiple spin-echo pulses. Another probable reason more ROIs showed significant differences between the masked and unmasked conditions in the GRASE sequence than they
did in the segmented EPI sequence would be the quality of the full Z-spectrum. The full Z-spectrum with the 3D GRASE sequence was much broader than that with the 3D EPI sequence. It may be necessary to evaluate the MTRasym
value using a relatively low B1 power of the saturation pulse for the 3D GRASE sequence, which may slightly increase the sharpness of the full Z-spectrum; however, a previous study showed that the full Z-spectrum with a B1 amplitude of 1 μT was still broad.19) When using a low B1 power, the ef- fect of the contribution of CSF signals to the MTRasym value may therefore be similar to that in this study. Neverthe- less, further studies with different types of pulse sequences should be performed to validate these findings.
3. Study limitations
First, we only evaluated the full Z-spectrum data ac- quired using a pulsed-saturation RF preparation.20,21) Be- cause saturation with a continuous-wave RF pulse is more effective than that with the pulse-wave RF, the effect of CSF signals on the full Z-spectrum data needs to be evaluated.
However, a continuous-wave RF pulse for saturation can- not be generated on most clinical scanners owing to hard- ware limitations. Second, in this study, the B1 amplitude was not optimized for amide protons or amine because we did not target one specific proton. The saturation prepara- tion depends only on the B1 amplitude and saturation du- ration. A low power is recommended for the saturation of amide protons, but a relatively high power is recommend- ed for the saturation of amine protons. For the 3D GRASE sequence, the B1 power for the saturation transfer may have been too high because the full Z-spectrum obtained was broad. Third, the B0 correction method using the 10th degree polynomial fitting may not be optimal. Each voxel has a small difference in precession frequency due to struc- tural susceptibility, which is particularly significant at high magnetic fields.5) B0 inhomogeneity leads to a shift in the water resonance frequency, resulting in direct asymmetric water saturation effects, and thus, artificial CEST effects in an asymmetry analysis. A better method may have to be applied for correcting the B0 inhomogeneity.4,15) Fourth, we used the MTRasym maps obtained at 0.86, 2.14, 3.00, and 3.43 ppm for the 3D-segmented gradient-echo EPI data and
those obtained at 1, 2, 3.0, and 3.5 ppm for the 3D GRASE data. The slight differences in the offset frequencies in the two sequences may not represent the same exchangeable protons for both measurements. In this study, we did not focus on evaluating the interpretation method after field inhomogeneity correction. Finally, we included a relatively small population in this study. Further large-scale studies should be conducted to validate our observations.
Conclusions
Depending on the sequence type, the MTRasym values can be overestimated for some areas of the elderly human brain if CSF signals are unmasked. Therefore, to obtain accurate MTRasym values in elderly subjects, it is necessary to apply method to minimize the contribution of CSF signals on the full Z-spectrum. In other words, the increased MTRasym val- ues in the case of Alzheimer’s disease due to increased CSF signal intensity can be used as an imaging biomarker.
Acknowledgements
This study was supported by the National Research Foundation of Korea (NRF) grant funded by the Korea government (MSIP) (2014R1A2A2A01002728), the Basic Science Research Program through the National Research Foundation of Korea (NRF) funded by the Ministry of Edu- cation (2016R1D1A1B03930720), and the Convergence of Conventional Medicine and Traditional Korean Medicine R&D program funded by the Ministry of Health & Welfare through the Korea Health Industry Development Institute (KHIDI) (HI16C2352).
Conflicts of Interest
The authors have nothing to disclose.
Availability of Data and Materials
All relevant data are within the paper and its Supporting Information files.
Ethics Approval and Consent to Participate
The study was approved by the Institutional Review Board of Kyung Hee University Hospital at Gangdong (IRB approval number; 2015-02-006-001).
References
1. Oh JH, Kim HG, Woo DC, Jeong HK, Lee SY, Jahng GH.
Chemical-exchange-saturation-transfer magnetic reso- nance imaging to map gamma-aminobutyric acid, glu- tamate, myoinositol, glycine, and asparagine: phantom experiments. J Korean Phys Soc. 2017;70:545-553.
2. Dagher AP, Aletras A, Choyke P, Balaban RS. Imaging of urea using chemical exchange-dependent saturation transfer at 1.5T. J Magn Reson Imaging. 2000;12:745-748.
3. Guivel-Scharen V, Sinnwell T, Wolff SD, Balaban RS. De- tection of proton chemical exchange between metabolites and water in biological tissues. J Magn Reson. 1998;133:36- 45.
4. Zhou J, Lal B, Wilson DA, Laterra J, van Zijl PC. Amide pro- ton transfer (APT) contrast for imaging of brain tumors.
Magn Reson Med. 2003;50:1120-1126.
5. van Zijl PC, Yadav NN. Chemical exchange saturation transfer (CEST): what is in a name and what isn’t? Magn Reson Med. 2011;65:927-948.
6. Bryant RG. The dynamics of water-protein interactions.
Annu Rev Biophys Biomol Struct. 1996;25:29-53.
7. Ward KM, Aletras AH, Balaban RS. A new class of contrast agents for MRI based on proton chemical exchange de- pendent saturation transfer (CEST). J Magn Reson. 2000;
143:79-87.
8. Xiao Y, Ma B, McElheny D, Parthasarathy S, Long F, Hoshi M, et al. Aβ(1-42) fibril structure illuminates self-recogni- tion and replication of amyloid in Alzheimer’s disease. Nat Struct Mol Biol. 2015;22:499-505.
9. Zhang Y, Man VH, Roland C, Sagui C. Amyloid properties of asparagine and glutamine in prion-like proteins. ACS Chem Neurosci. 2016;7:576-587.
10. Haris M, Cai K, Singh A, Hariharan H, Reddy R. In vivo mapping of brain myo-inositol. Neuroimage. 2011;54:2079- 2085.
11. Jahng GH, Lee DK, Lee JM, Rhee HY, Ryu CW. Double in-
version recovery imaging improves the evaluation of gray matter volume losses in patients with Alzheimer’s disease and mild cognitive impairment. Brain Imaging Behav.
2016;10:1015-1028.
12. Tohka J. Partial volume effect modeling for segmentation and tissue classification of brain magnetic resonance im- ages: a review. World J Radiol. 2014;6:855-864.
13. Sun PZ, Lu J, Wu Y, Xiao G, Wu R. Evaluation of the depen- dence of CEST-EPI measurement on repetition time, RF irradiation duty cycle and imaging flip angle for enhanced pH sensitivity. Phys Med Biol. 2013;58:N229-N240.
14. Zhu H, Jones CK, van Zijl PC, Barker PB, Zhou J. Fast 3D chemical exchange saturation transfer (CEST) imaging of the human brain. Magn Reson Med. 2010;64:638-644.
15. Kim M, Gillen J, Landman BA, Zhou J, van Zijl PC. Water saturation shift referencing (WASSR) for chemical ex- change saturation transfer (CEST) experiments. Magn Reson Med. 2009;61:1441-1450.
16. Zaiss M, Xu J, Goerke S, Khan IS, Singer RJ, Gore JC, et al.
Inverse Z-spectrum analysis for spillover-, MT-, and T1 -corrected steady-state pulsed CEST-MRI — application to pH-weighted MRI of acute stroke. NMR Biomed. 2014;27:
240-252.
17. Tietze A, Blicher J, Mikkelsen IK, Østergaard L, Strother MK, Smith SA, et al. Assessment of ischemic penumbra in patients with hyperacute stroke using amide proton trans- fer (APT) chemical exchange saturation transfer (CEST) MRI. NMR Biomed. 2014;27:163-174.
18. Zhou J, Blakeley JO, Hua J, Kim M, Laterra J, Pomper MG, et al. Practical data acquisition method for human brain tumor amide proton transfer (APT) imaging. Magn Reson Med. 2008;60:842-849.
19. Sun PZ, Farrar CT, Sorensen AG. Correction for artifacts induced by B(0) and B(1) field inhomogeneities in pH- sensitive chemical exchange saturation transfer (CEST) imaging. Magn Reson Med. 2007;58:1207-1215.
20. Zu Z, Li K, Janve VA, Does MD, Gochberg DF. Optimizing pulsed-chemical exchange saturation transfer imaging sequences. Magn Reson Med. 2011;66:1100-1108.
21. Tee YK, Khrapitchev AA, Sibson NR, Payne SJ, Chappell MA. Evaluating the use of a continuous approximation for model-based quantification of pulsed chemical exchange saturation transfer (CEST). J Magn Reson. 2012;222:88-95.