Dose Verification Study of Brachytherapy Plans Using Monte Carlo Methods and CT Images
Kwang-Ho Cheong, Me Yeon Lee, Sei-Kwon Kang, Hoonsik Bae, Soah Park, Kyoung-Joo Kim, Tae-Jin Hwang, Do-Hoon Oh
Department of Radiation Oncology, Hallym University College of Medicine, Anyang, Korea Most brachytherapy treatment planning systems employ a dosimetry formalism based on the AAPM TG-43 report which does not appropriately consider tissue heterogeneity. In this study we aimed to set up a simple Monte Carlo-based intracavitary high-dose-rate brachytherapy (IC-HDRB) plan verification platform, focusing particularly on the robustness of the direct Monte Carlo dose calculation using material and density information derived from CT images. CT images of slab phantoms and a uterine cervical cancer patient were used for brachytherapy plans based on the Plato (Nucletron, Netherlands) brachytherapy planning system. Monte Carlo simulations were implemented using the parameters from the Plato system and compared with the EBT film dosimetry and conventional dose computations. EGSnrc based DOSXYZnrc code was used for Monte Carlo simulations. Each 192Ir source of the afterloader was approximately modeled as a parallel-piped shape inside the converted CT data set whose voxel size was 2×2×2 mm3. Bracytherapy dose calculations based on the TG-43 showed good agreement with the Monte Carlo results in a homogeneous media whose density was close to water, but there were significant errors in high-density materials. For a patient case, A and B point dose differences were less than 3%, while the mean dose discrepancy was as much as 5%. Conventional dose computation methods might underdose the targets by not accounting for the effects of high-density materials.
The proposed platform was shown to be feasible and to have good dose calculation accuracy. One should be careful when confirming the plan using a conventional brachytherapy dose computation method, and moreover, an independent dose verification system as developed in this study might be helpful.
Key Words: Monte Carlo, DOSXYZnrc, AAPM TG-43, Brachytherapy, 192Ir
This work was supported by a Korea Science and Engineering Foundation (KOSEF) grant funded by the Korea government Ministry of education, science and technology (MEST, No. 20100018223).
Submitted July 19, 2010, Accepted September 7, 2010
Corresponding Author: Kwang-Ho Cheong, Department of Radiation Oncology, Hallym University Sacred Heart Hospital, 896, Pyeongchon- dong, Dongan-gu, Anyang 431-070, Korea
Tel: 031)380-3911, Fax: 031)380-3913 E-mail: [email protected]
INTRODUCTION
Brachytherapy was developed more than a century ago and still plays an important role in the radiation therapy field. In particular, the development of remote afterloading devices im- proved radiation protection for the operator and patients and increased the utilization of brachytherapy. In Korea, the most common use of brachytherapy is for the intracavitary treatment of uterine cervical cancer, and 192Ir is the radioactive source
most often used for this purpose. This is an example of intra- cavitary high-dose-rate brachytherapy (IC-HDRB). Many pre- vious papers have reported the source characteristics of 192Ir,1-6) but there has been insufficient verification of this technique for clinical applications, especially for the treatment of a patient.
Most brachytherapy treatment planning systems employ dosim- etry formalism based on the AAPM TG-43 report.6,7) However, the TG-43 protocol relies on a superposition of single-source dose distributions in water, which means that tissue hetero- geneity is not appropriately considered. Tissue heterogeneity correction factors8) or analytical models9-11) have been proposed to solve this problem, but they have not yet been adopted for brachytherapy dose computations in commercialized brachy- therapy planning systems. The Monte Carlo method is a versa- tile tool for use in brachytherapy dosimetry, and it has been used for brachytherapy source characterization, applicator mod- eling, and shielding. However, patient-specific Monte Carlo
Fig. 1. Schematic diagram of the in-house Monte Carlo intracavitary high-dose-rate brachytherapy plan evaluation system which is a hybrid system consisting of DOSXYZnrc Monte Carlo code, the Plato, and the Pinnacle3 radiation treatment planning system.
modeling based on CT images using general purpose Monte Carlo code has not been investigated sufficiently. In this study, we set up a simple Monte Carlo-based IC-HDRB plan ver- ification system, with a particular focus on the robustness of the direct Monte Carlo dose calculation using material and density information derived from CT images.
MATERIALS AND METHODS
1. Simple monte carlo system
A schematic diagram of the in-house Monte Carlo IC-HDRB plan evaluation system is shown in Fig. 1. It is a hybrid system consisting of DOSXYZnrc12) Monte Carlo code, the Plato brachytherapy planning system, and the Pinnacle3 ra- diation treatment planning system. DOSXYZnrc is a part of EGSnrc, which is a general purpose Monte Carlo code for photon and electron transport. DOSXYZnrc is based on Cartesian coordinates, making it possible to handle three-di- mensional dose data intuitively.
Once a phantom or a patient was CT-scanned, the image set was sent to both the Plato and the Pinnacle3. Following IC-HDRB planning with the Plato, the plan data, including doses, source positions, and weights were exported for a Monte Carlo simulation and a dose evaluation. The Pinnacle3 format CT data was converted into EGSPHANT format data by the CTCREATE code, and the source positions and weights from the plan data were used for a Monte Carlo simulation as well.
Default 5 media in the PEGS4 data were used to simulate a pa- tient plan (AIR521ICRU, LUNG521ICRU, ICRUTISSUE521ICRU, ICRPBONE521ICRU, STEEL521ICRU), while PMMA521ICRU was used for a phantom simulation. 3DDOSE data from the
simulation of each single source were integrated with their own weights using the in-house program, which was devel- oped using MATLAB 2009a (Mathworks, USA), and the data were then converted to the Pinnacle3 dose format. Exported dose data from the Plato were converted to the Pinnacle3 dose format for an evaluation.
The microSelectron-HDR 192Ir afterloader (Nucletron, Nether- lands) and catheters were used for a treatment. The 192Ir source of the afterloader was modeled as a 3.6×0.6×0.6 mm3 rec- tangular parallelepiped shape without capsule shielding using source type number 6 (uniform isotropically radiating paral- lelepiped within DOSXYZnrc volume), and it was assumed to be located at the center of the catheters. The spectrum data for the microSelectron-HDR 0.2 mm stainless-steel-encapsulated
192Ir source could be obtained from the EGSnrc code, and number of history was 1×10⁹ for a single source simulation to make the overall statistical error less than 0.5% for a 2×2×2 mm3 voxel size. PCUT and ECUT were set to 0.01 MeV and 0.521 MeV respectively, although the electron transport was not the case.
2. Phantom study
To verify the accuracy of the Monte Carlo dose computa- tion, we implemented a phantom test. The phantom was made of poly-methyl-methacrylate (PMMA) slabs, and it was possi- ble to insert materials of various densities to simulate tissue heterogeneity. The phantom was CT-scanned using a Brilliance Big Bore CT simulator (Philips Medical Systems, Netherlands), followed by the procedure described in previous section. A straight catheter model 084400 (Nucletron, Netherlands) was inserted into the center of the phantom. Because the catheter
Fig. 2. The microSelectron-HDR 192Ir afterloader and the PMMA slab phantom used in this study.
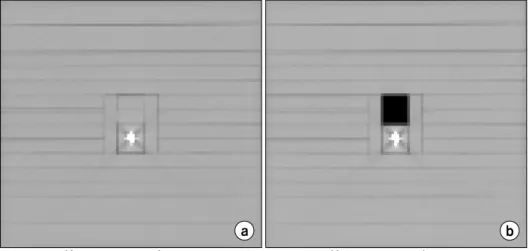
Fig. 3. The EGSPHANT formatted material and density matrices of the (a) homogeneous and (b) hetero- geneous with air region phantoms.
Images were derived from the DOSXYZ_show program. For both phantoms, voxel size was 2×2×2 mm3 and the dimension of the phantom was 20 (width)×20 (length)×
18 (height) cm3. was made of stainless steel, it might create artifacts on the CT
images. However, they were not severe as predicted, nor they were significant for a purpose of the Monte Carlo simulation although they depended on CT image quality. Estimated diam- eter of the catheter on the converted EGSPHANT data was more than twice larger than the actual size (8 mm vs. 3.2 mm); however, this size was thought to be acceptable for the Monte Carlo simulation due to discrete voxel size of the con- verted phantom data. Material density around the catheter was not also affected by these artifacts.
Fig. 2. shows the microSelectron-HDR 192Ir afterloader and the phantom used for the dosimetry. We assumed that 100 cGy had been prescribed for a point 2 cm from the center to- ward the left side. To deliver this dose to the prescription point, it required a 4-cm length of source loading with 2.5 mm intervals, total of 17 dwell positions with appropriate weightings. We calculated the Monte Carlo dose with two
kinds of phantoms in order to test shielding effect of the catheter. One was original phantom CT image; the other was a fully homogeneous phantom without catheter. Then we inves- tigated the tissue heterogeneity effect assuming that air was present over the catheter. Fig. 3 shows the CT-scanned homo- geneous and inhomogeneous phantom images used in this study. Monte Carlo studies of the phantoms were compared with GafChromic EBT film (ISP, USA) dosimetry. EBT film was inserted at the center of the phantom, perpendicular to the catheter. In this procedure, we punched on the film to insert the catheter, but the hole on the scanned image was removed by post-processing before dose converting. The film was cali- brated with a 6 MV external photon beam inside a solid water phantom (RW3; PTW, Germany). Radial dose profile from the EBT film dosimetry were verified using a pinpoint ion cham- ber (PTW31006; PTW, Germany) at distances from the source center of 2 to 8 cm in 1 cm intervals along the x axis on the central plane.
3. Clinical case
To test the Monte Carlo simulation with a clinical case, we used the brachytherapy plan for treatment of a uterine cervical cancer patient. The gross tumor volume (GTV), clinical tumor volume (CTV), rectum, and bladder were delineated and we planned using the Plato. Two ovoids and a tamdem were used for the treatment. Based on ICRU report 38,13) 500 cGy was prescribed at the A points. The resulting parameters, such as the source positions and weightings, were used for a Monte
Fig. 4. The y-directional (anterior-posterior direction) dose profiles that cross the prescription point of the homogeneous phantom, shown with and without the catheter. Due to the metal shield effect, dose calculation with the catheter decreased by up to 5%. Both profiles were derived from the Monte Carlo calculation result.
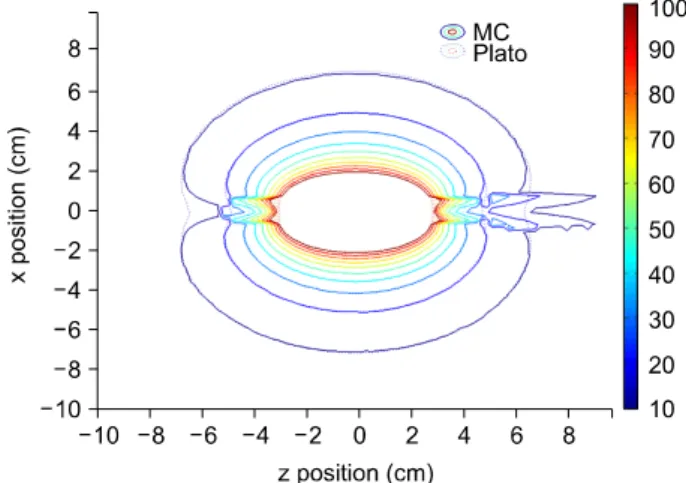
Fig. 5. Axial view of the Monte Carlo isodose distributions in absolute doses computed with (solid line) and without (dotted line) the catheter in a homogeneous phantom.
Fig. 7. Absolute dose fall-off along the radial direction in the center plane of the PMMA phantom (transverse plane) for a 4-cm source loading. Pinpoint ion chamber measurement (diamond), Monte Carlo (thick solid line).
Fig. 6. Axial view of the Monte Carlo (solid line) and the Plato (dotted line) isodose distributions in absolute doses those were computed with the catheter in a homogeneous phantom.
Carlo simulation for each source. Dose values at the A and B points, mean doses for organs, and isodose distribution were compared using Pinnacle3.
RESULTS AND DISCUSSION
1. Effects of the catheter’s metal shield
Fig. 4. shows y-directional (anterior-posterior direction) dose profiles that cross the prescription point of the homogeneous
phantom with and without the catheter. The metal shield effect caused the dose calculation with the catheter to decrease by up to 5%. This indicates that the dose calculated from the Plato plan might be smaller than expected if the catheter shield ef- fect was not properly considered. The shield effect of the cath- eter can be seen clearly in Fig. 5. If there is no metal shield around the seeds, the isodose distribution might resemble the dotted ellipsoidal lines as shown in Fig. 5. However, the metal catheter moved the isodose lines to new positions indicated by the solid lines. The discrepancy was quite large along the
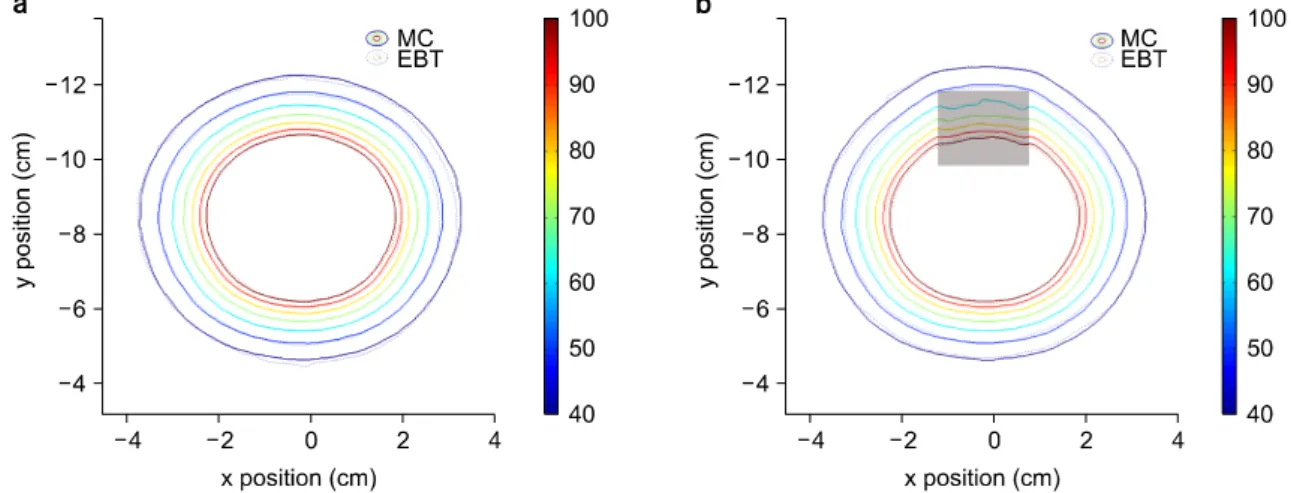
Fig. 8. Isodose distributions in absolute doses around the 192Ir source in (a) a homogeneous phantom and (b) heterogeneous phantoms. Air is present over the catheter (dark area). The Monte Carlo isodose is shown in solid lines and the EBT film dosimetry in dotted lines.
Fig. 9. Isodose distributions in absolute doses around the 192Ir source in (a) a homogeneous phantom and (b) heterogeneous phantoms. Air is present over the catheter (dark area). The Monte Carlo isodose is shown in solid lines and the TG-43 in dotted lines.
catheter line, especially at the ends of the source batch. This phenomenon was also observed in the Plato dose calculation in Fig. 6 even though the shield effect was not properly considered.
2. Effects of tissue heterogeneity
Fig. 7 shows the results of the Monte Carlo simulation com- pared with the measurement using the pinpoint ion chamber by graphing the absolute dose distribution in the PMMA phantom along the radial direction. The Monte Carlo simulation result and the measurement agreed well, and the dose decreased rap- idly along the radial distance. Beyond 8 cm, it decreases to
less than 10% of the prescription dose. Fig. 8 shows the iso- dose distributions compared with EBT film dosimetries in a homogeneous and heterogeneous phantom. In the homogeneous phantom study, we can see good agreement between the Monte Carlo dose computation and the EBT film measurement.
However, a slight discrepancy can be observed in the hetero- geneous phantom study, especially in the air region; it seems to be due to overestimation and increased uncertainty at the low dose range of EBT film dosimetry. Isodose line expansion around the low density material can be observed at the lower dose lines of less than 50% of prescription dose in Fig. 8b.
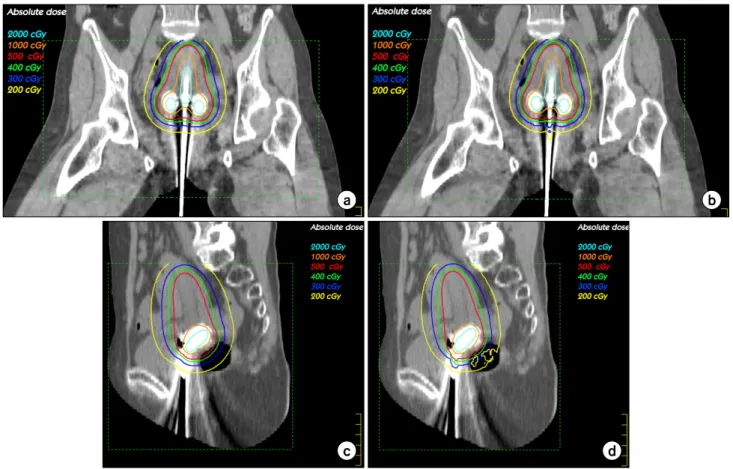
Fig. 10. Isodose distributions on the coronal and sagittal CT images with different dose computation methods, while 500 cGy isodose lines are in red. (a) Coronal, TG-43, (b) coronal, Monte Carlo, (c) sagittal, TG-43, (d) sagittal, Monte Carlo. Overall trends were similar except at the ends of the source loading along the catheter and near the gas in the rectum.
Table 1. Comparisons of point doses at the specific points and mean ROI doses of targets and normal organs.
Point dose (cGy) Mean ROI dose (cGy)
A1 A2 B1 B2 Bladder Rectum CTV
MC 500 506.8 150 147.8 202.7 199.9 1139.2
Plato 499.7 504.4 150.2 150.3 210.0 208.9 1212.1 When we compared the Monte Carlo simulation with the re-
sults of Plato dose computation, we observed quite a good agreement in both the homogeneous and heterogeneous phan- toms (Fig. 9). There was a discrepancy around the air region, but that discrepancy was not significant. In other words, even though the Plato could not consider the heterogeneity effect properly, the dose calculation error due to heterogeneity was negligible. However if there was a high density material around the sources, it might have a larger effect than the low density material because the interactions are quite different within water and within high density materials. A smaller dose discrepancy than expected around the heterogeneous region might be due to the energy range of 192Ir. The mean energy of
192Ir is about 0.38 MeV, and in this energy range the Compton scattering is dominant. At short ranges near a source, it is mainly primary radiation that contributes to the local dose around the source, while multiple scattering with lower energy
increases at longer ranges. Even though multiple scattered radi- ations are more sensitive to tissue heterogeneity than primary photons, the multiple scattering does not contribute much to the total dose in the range of interest.10)
3. Clinical case
Isodose distributions calculated using the Monte Carlo meth- od and the Plato are displayed on coronal and sagittal images in Fig. 10. The overall trends were similar except at the ends of the source loading along the catheter and the gas in rectum.
These discrepancies arise from the effects already described in the phantom study result. Table 1 show point doses at the spe- cific points as well as mean ROI doses of targets and normal organs. Point dose differences were less than 3%, while the mean dose discrepancy was as much as 5%, which is not crit- ical for a clinic.
In this study, we did not model the applicator exactly, but instead used CT data directly by converting to a specific mate- rial and density matrix. Although the metal applicator and shielding material may cause serious artifacts on CT images;
the artifact can be properly handled if a well-tuned CT num- ber-material/density curve is used in converting the procedure to EGSPHANT format. Using CT and MRI compatible appli- cators might help minimize these problems.14) In the future, we plan to investigate the tungsten or lead shield effect of appli- cators used for a treatment even they were not used for CT imaging. For this purpose, comparison with the exact applica- tor modeling might be necessary.
It was not also necessary in this study to use exact model- ing of the source because, from a macroscopic point of view, the source dimension is smaller than the voxel size and the superposition of the dose distributions of a single source re- duces the overall uncertainty in the simplified source model.
Thus we can say that the system described here would be fea- sible for clinical purposes. However, some residual uncertai- nties remain during the procedure, such as coordinate trans- formation, dose data cropping, and mapping to convert to the Plato or Monte Carlo dose computation data to the Pinnacle3 dose data format. The discrete voxel size may cause some er- ror due to imperfect matching of the dataset.
Calculation time is a weak point of the Monte Carlo simu- lation when using general purpose code such as EGSnrc.
However, if we allow statistical uncertainty up to 2% for a single source simulation, then the simulation might be done in less than 1 hour. It is quite a reasonable time for a verification purpose. Some fast Monte Carlo codes that are oriented to bra- chytherapy, such as PTRAN_CT,15,16) MCPI17) or BRACHYDOSE18) might help in reducing the calculation time.
Complex platform using multiple systems can be simplified if appropriate in-house software is developed. Actually, the Pinnacle3 is not necessary at all in the platform except for the dose evaluation purpose. Smoother interface among the sys-
tems and automation with proper in-house software would de- crease burdens during the dose verification procedures of bra- chytherapy plans using independent Monte Carlo simulation systems.
CONCLUSION
Our platform of Monte Carlo dose calculation using DOSXYZnrc code provides a simple and reliable interface among the brachytherapy planning system, the Monte Carlo dose calculation, and the evaluation system, and it showed good feasibility and dose calculation accuracy. Brachytherapy dose computations based on the TG-43 were quite accurate in a homogeneous media whose density was close to water; how- ever, the error was more significant in high-density materials such as catheters than in low-density materials such as gas in the rectum. Conventional dose computation methods might un- derdose the targets by not accounting for the effects of high-density materials. Therefore, when making a plan using a conventional brachytherapy dose computation method, one should be careful when confirming the plan, and moreover, an independent dose verification system as developed in this study might be helpful.
REFERENCES
1. Angelopoulos A, Baras P, Sakelliou L, Karaiskos P, Sandilos P: Monte carlo dosimetry of a new 192Ir high dose rate brachytherapy source. Med Phys 27:2521-2527 (2000) 2. Daskalov GM, Baker RS, Rogers DW, Williamson JF:
Dosimetric modeling of the microselectron high-dose rate 192Ir source by the multigroup discrete ordinates method. Med Phys 27:2307-2319 (2000)
3. Karaiskos P, Angelopoulos A, Sakelliou L, et al: Monte carlo and TLD dosimetry of an 192Ir high dose-rate brachytherapy source. Med Phys 25:1975-1984 (1998)
4. Meigooni AS, Kleiman MT, Johnson JL, Mazloomdoost D, Ibbott GS: Dosimetric characteristics of a new high-in- tensity 192Ir source for remote afterloading. Med Phys 24:
2008-2013 (1997)
5. Melhus CS, Rivard MJ: Approaches to calculating AAPM TG-43 brachytherapy dosimetry parameters for 137Cs, 125I, 192Ir,
103Pd, and 169Yb sources. Med Phys 33:1729-1737 (2006) 6. Rivard MJ, Coursey BM, DeWerd LA, et al: Update of
AAPM task group no. 43 report: A revised AAPM protocol for brachytherapy dose calculations. Med Phys 31:633-674 (2004) 7. Nath R, Anderson LL, Luxton G, Weaver KA, Williamson
CT 영상 및 몬테칼로 계산에 기반한 근접 방사선치료계획의 선량분포 평가 방법 연구
한림대학교 의과대학 방사선종양학교실
정광호ㆍ이미연ㆍ강세권ㆍ배훈식ㆍ박소아ㆍ김경주ㆍ황태진ㆍ오도훈
대다수의 근접치료용 방사선치료계획장치는 AAPM TG-43의 계산식에 기반을 둔 선량계산 알고리듬을 적용하고 있으나 이는 조직의 비균질성을 적절히 고려하지 못한다. 본 연구에서는 몬테칼로 방법을 이용하여 강내고선량근접치료계획을 검증하는 체계를 구축하고자 하였으며, 특히 환자의 CT 영상을 이용하여 물질정보로 변환한 후 직접 몬테칼로 계산을 수행하는 방법의 타당성에 초점을 맞추었다. 판형 팬텀 및 자궁경부암 환자의 CT 영상을 Plato (Nucletron, Netherlands) 치료계획장치를 이용하여 근접치료계획을 수행한 후 여기서 얻어진 인자들을 이용하여 EGSnrc 기반의 DOSXYZnrc 코 드로 몬테칼로 계산을 수행하였으며, EBT 필름측정 결과와 비교하였다. DOSXYZnrc 코드의 선원 모델링 특성 상 후장전 장치의 192Ir 선원들을 직육면체 형태로 근사화하여 모델링하였으며 계산 시 체적소의 크기는 2×2×2 mm3로 하였다. 균질 매질 내에서는 TG-43 기반의 선량계산 결과와 몬테칼로 선량계산 결과가 잘 일치함을 확인할 수 있었으나 고밀도 물질 이 포함된 비균질 매질 내에서는 오차가 커졌다. 환자의 경우 A점 및 B점의 오차는 3% 이내, 평균선량 오차는 5% 정도 였다. 그러나 기존 선량계산 알고리듬의 경우 고밀도 물질의 영향을 적절히 고려하지 못하여 표적의 선량을 과대평가하 여 실제로는 더 적은 선량이 들어갈 우려가 있다. 본 연구에서 제안된 선량계산 검증체계는 타당하며 선량 계산 결과도 실제와 잘 일치함을 확인할 수 있었다. 또한 기존의 선량계산 알고리듬으로 계산된 치료계획결과를 확인할 경우에는 주 의가 필요하며, 몬테칼로 방법과 같은 독립적인 검증 시스템이 유용할 것이다.
중심단어: 몬테칼로, DOSXYZnrc, AAPM TG-43, 근접치료, 192Ir JF, Meigooni AS: Dosimetry of interstitial brachytherapy sour- ces: Recommendations of the AAPM radiation therapy commit- tee task group no. 43. american association of physicists in medicine. Med Phys 22:209-234 (1995)
8. Daskalov GM, Kirov AS, Williamson JF: Analytical ap- proach to heterogeneity correction factor calculation for brachy- therapy. Med Phys 25:722-735 (1998)
9. Anagnostopoulos G, Baltas D, Karaiskos P, Pantelis E, Papagiannis P, Sakelliou L: An analytical dosimetry model as a step towards accounting for inhomogeneities and bounded geometries in 192Ir brachytherapy treatment planning. Phys Med Biol 48:1625-1647 (2003)
10. Poon E, Verhaegen F: A CT-based analytical dose calcu- lation method for HDR 192Ir brachytherapy. Med Phys 36:3982- 3994 (2009)
11. Tedgren AK, Ahnesjo A: Accounting for high Z shields in brachytherapy using collapsed cone superposition for scatter dose calculation. Med Phys 30:2206-2217 (2003)
12. Walters B, Kawrakow I, Rogers DWO: DOSXYZnrc users manual. NRCC Report PIRS-794revB, Ottawa, Canada (2009)
13. ICRU Report 38: Dose and volume specifications for report- ing intracavitary therapy in gynecology. International Commission on Radiation Units and Measurements, Bethesda, MD (1985) 14. Shin KH, Kim TH, Cho JK, et al: CT-guided intracavitary
radiotherapy for cervical cancer: Comparison of conventional point A plan with clinical target volume-based three-dimensional plan using dose-volume parameters. Int J Radiat Oncol Biol Phys 64:197-204 (2006)
15. Li Z, Williamson JF: Volume-based geometric modeling for radiation transport calculations. Med Phys 19:667-677 (1992) 16. Poon E, Williamson JF, Vuong T, Verhaegen F: Patient-
specific monte carlo dose calculations for high-dose-rate en- dorectal brachytherapy with shielded intracavitary applicator. Int J Radiat Oncol Biol Phys 72:1259-1266 (2008)
17. Chibani O, Williamson JF: MCPI: A sub-minute monte car- lo dose calculation engine for prostate implants. Med Phys 32:3688-3698 (2005)
18. Taylor RE, Yegin G, Rogers DW: Benchmarking brachy- dose: Voxel based EGSnrc monte carlo calculations of TG-43 dosimetry parameters. Med Phys 34:445-457 (2007)