Design Characteristics on Electric Drivetrain for Electric Vehicle Based on Driving
Performance
Jiseong Park * , Sang-Yong Jung * ★
Abstract
Design consideration on electric drivetrain(E-D/T), usually referred as electric motor for driving, its compatible reduction gear, and inverter, are performed for developing electric vehicle(EV) with efficient driving performance.
Universal mode of driving cycle has been used to make up the actual vehicle performance, and its results are incorporated to the design of E-D/T.
Key words: EV(Electric Vehicle), E-D/T(Electric Drivetrain), FUDS(Federal Urban Driving Schedule), FCEV(Fuel Cell Electric Vehicle), Hydrogen
* Dept. of Electrical Engineering, Dong-A Univ.
★
Corresponding author(Professor of Dong-A Univ.) E-mail:[email protected]※ Acknowledgment
This research was supported by Basic Science Research Program through the National Research Foundation of Korea(NRF) funded by the Ministry of Education, Science and Technology (KRF-2006-331- D00192) and KESRI(R-2007-2-060), which is funded by MOCIE(Ministry of commerce.
Manuscript received Aug. 9,2009 reviced Sep. 24, 2009
I. Introduction
Driving performance of EV, powered by battery or FC(Fuel Cell), is much dependent on the layout configuration and the running characteristics of E-D/T consisting of an electric motor for driving, a reduction gear, and inverter[1]. Their respective specifications are originally defined by the total vehicle performance characterized with the well-known standard driving cycle such as FUDS(FTP(Federal Test Procedure)-72), FTP-75, ECE(Economic Commission for Europe), EUDC(Extra Urban Driving Cycle), etc[2]. With the driving cycle, we can expect the specified range of vehicle where the E-D/T has the maximum efficiency for better fuel efficiency.
Generally, vehicle target performance can be divided into the two requirements. One is the basic overall vehicle requirements such as the acceleration time from ground to target speed, the maximum climbing angle or the ramp angle, the maximum speed, maximum cruising speed, etc. The other is the actual driving requirements defined by applied driving cycle, which is usually referred as the field range per fuelling (or charging). With the driving cycle, not only the accelerating force but the resistive force can be obtained, which comes together to be the required drag force of E-D/T.
Then, vehicle performance regulated from the driving cycle defines the actual performance profile of E-D/T, such as speed-torque, power and efficiency distribution, from which the fuel efficiency of vehicle is directly computed[3-4].
This paper shows the computing procedures of the performance requirements of E-D/T considering all components of electric vehicle. Not only the basic design requirements but the maximum efficiency range of E-D/T for the specified range of the vehicle from fuel efficiency will be aimed to be satisfied. Proving data of the electric vehicle realizing the improved fuel efficiency by applying the proposed procedure will be shown successively.
II. Electric Vehicle Requirements
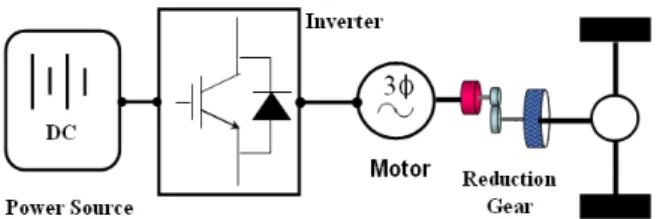
EV powered by battery or fuel cell has been prominent because of its clearance of an emission, and lately being advanced by the well-fitted E-D/T with better running efficiency. Fig. 1 shows the schematic structure of the generally applied EV equipped with E-D/T.
Fig. 1. Schematic block diagram of E-D/T for EV.
Generally, the performance requirements of EV are not so different to those of classical ICE(Internal Combustion Engine) vehicles, except the evaluation standard of fuel efficiency. In case of battery powered EV, SOC(State of Charge)is good indicator showing the consumed power per mileage, whereas FCEV is evaluated with the volume of consumed energy source like hydrogen[m/g].
Generalized basic performance requirements of EV can be summarized as follows.(KPH=km/hour, MPH=mile/hour)
(a) Maximum Vehicle Speed[KPH or MPH]
(b) Maximum Cruising Speed[KPH or MPH]
(c) Accelerating Time(e.g., zero to target speed)[sec]
(d) Maximum Gradeability[Climbing Gradient][%]
(e) Maximum Cruising Gradeblity(@given speed)[%]
(f) Mileage per Fuelling[km or miles]
III. Driving Load of Vehicle
Well-known driving load(resistive force) of vehicle[N], inevitable on road, can be classified into three major parts as follows.
(1) Rolling Resistive Force
This is a disturbing load occurred between tyres and road, usually considerable at low speed.
∙
∙ ∙cos
(1)where
: rolling resistance coefficient,
: GVW(gross vehicle weight) or CVW(curb vehicle weight)[kg], : gravity acceleration[km/s²], : degree of inclination(slope).(2) Climbing Resistive Force
This is only considerable in climbing a hilly road and regardless of the vehicle speed.
∙ ∙sin
(2)(3) Aerodynamic Drag Force
This load always exists at the vehicle frontal area opposing against the aerodynamic flow.
∙∙
∙
∙ (3)where : air density[kg/m³],
: air drag resistance coefficient,
: vehicle frontal area[m²], : vehicle speed[m/sec]. As shown in (3),
is proportional to the square of vehicle speed, and most influential at high speed.The other driving load, the acceleration load, may be included in category, but it is impractical because it is changed so instantaneously.
Accordingly, total driving load of vehicle(
) becomes the sum of (1), (2) and (3), and the equivalent load torque in motor output(reduction gear input) also can be induced as follows.
∙
∙
(4)where
: dynamic radius of tyre[m],
: final gear(reduction gear and differential gear) ratio, : final efficiency of gearsIV. Required Motor Specifications
Basic performance requirements of motor meeting the vehicle performance, (a)-(e), can be defined with the detail information of base car. Detail information of mid-sized SUV is shown in Table 1, and Table 2 is summary of its required performance.
Classification Specification
GVW(CVW) 1890(1650)[kg]
2.47 [m²]
0.42
0.013
0.328Classification Specification
Maximum Speed 150[KPH]+
Maximum Cruising Speed 125[KPH]+
Acceleration Time
(@Zero to 100[KPH]) 15[sec]- Maximum Gradeability 25[%]+
Maximum Cruising
Gradeability(@30[KPH]) 11[%]+
Classification Specification Max./Cont. Power 80/40[kW]
Max./Con. Torque 212/106[Nm]
Base Speed 3600[r/min]
Max. Speed 12000[r/min]
CPSR 2.5 : 1
Classification Specification
Maximum Speed 155[KPH]
Maximum Cruising Speed 128[KPH]
Acceleration Time
(@Zero to 100[KPH]) 13.6[sec]
Maximum Gradeability 32[%]
Maximum Cruising
Gradeability(@30[KPH]) 15[%]
Table 1. Vehicle Specifications(Mid-Sized SUV)
Table 2. Required Performance of Base Car
At first, maximum speed[KPH] is defined by maximum motor speed where driving load eq. (4), does not exceed the maximum motor torque (
). Similarly, maximum cruising speed comes from where driving load does not exceed the continuous motor torque. Acceleration time is computed by dynamic equationas follows.Acceleration time =
∆ (5)where (acceleration[m/s²]) =
,
(drive shaft force) =
∙
∙
,
(dynamic mass) =
∙
∙
,
: rotor inertia[kg·m²].Accelerating time is related to the maximum motor torque(power) and its base speed([r/min]).
Maximum gradeability means the maximum degree of inclination related to the maximum starting torque of motor.
Gradeablity = tan ∙ (6)
Lastly, maximum cruising gradeablitiy at given speed is where driving load at a hilly road is equivalent to the continuous operation of motor.
Meanwhile, determination of final gear ratio which
is mixture of a reduction gear and a differential gear can not be freely done, mainly due to the mechanical limits of gear configuration, cost dependence for modification, and long time consuming for quality assurance. For reduction of motor size, larger gear ratio will be desirable, but it should be determined from combination of the feasible mechanical gear-train and the admissible maximum bearing speed. In this paper, gear-train is selected such that
comes to be 9.5(reduction gear ratio=3.12).Defined motor specification meeting the vehicle requirements in Table 2, and its performance are summarized at Table 3 and 4, respectively.
Table 3. Motor Specifications(
=9.5)(where CPSR: Continuous Power Speed Ratio)
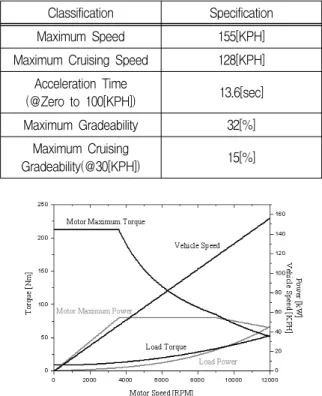
Table 4. Vehicle Performance of Base Car(
=9.5)Fig. 2. Motor performance curve(plane road)
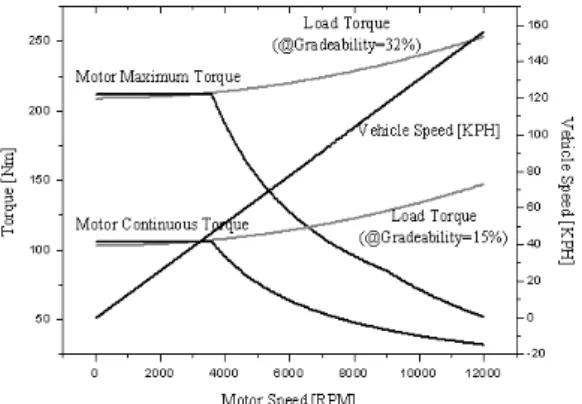
Fig. 3. Motor performance curve(hilly road)
Fig. 2 shows the motor performance at a plane road, where maximum vehicle speed is 155KPH and maximum cruising speed is around 128KPH. In Fig.
3, road gradeability where motor starting torque(212Nm) is larger than load torque can be increased up to 32%, and maximum cruising gradeability can similarly be induced by comparing the motor torque with load torque.
Based on the process to make up the motor specifications meeting the basic vehicle requirements, (a)-(e), the design outline of driving motor can be established. Meanwhile, another critical evaluation criterion of vehicle, fuel efficiency, should also be considered, which is identically approached with maximum mileage per once fuelling as already summarized in (f).
V. Driving Cycle and Efficiency
In classical vehicle, fuel efficiency has usually been expressed as km per litter or mile per gallon, which means the average running coverage per unit volume of fuel. Identically, in case of EV, same kinds of barometer can be applied such that battery powered EV can be expressed with SOC variation and FCEV is usually evaluated with the volume of consumed energy source like hydrogen.
In evaluating the fuel efficiency, officially recognized standard driving cycle, such as FUDS(FTP-72), FTP-75, ECE, EUDC, should be applied. Particularly, this paper will deal with the FC powered EV following evaluation of hydrogen consumption, and FUDS mode has been applied for standard. Fig. 4 shows the speed pattern of FUDS
which reflects the in-city operation of vehicle, consisting of the frequent stop-and-go driving pattern.
Fig. 4. Standard driving cycle of FUDS mode.
Driving cycle of FUDS mode can be converted into the net drag force of a vehicle, which comes to be the required motional requirements of motor by adding the driving load, (1)-(3), also specified with the driving cycle.
(a) Utilizing frequency for Motor Torque in FUDS
(b) Utilizing frequency for Motor Speed in FUDS Fig. 5. Motor and speed utilizing frequency in FUDS
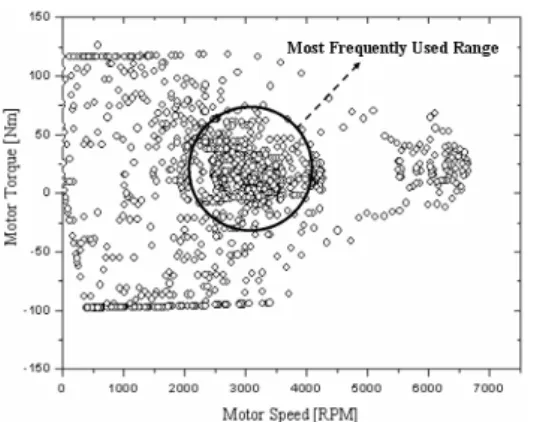
Fig. 6. Motor torque and speed mapping from FUDS
In Fig. 5, the utility frequency of electric motor from FUDS is compared in percentage versus the motor torque and speed. The most frequently utilized torque and speed are 20~40Nm and 2500~4000r/min except results near zero, and take up approximately 40% to overall driving statistics.
Total mapping of torque versus speed of electric motor is visualized in Fig. 6. Accordingly, based on the performance mapping, it is obvious that electric motor should have the maximum efficiency at 20~40Nm and 2500~4000r/min for better fuel efficiency.
VI. Fuel Efficiency
Although operating range where electric motor should have the best efficiency has been defined from driving cycle, it should be reconsidered from viewpoint of fuel efficiency. This means that the defined operating range may be changed if influence of motor efficiency, inverter efficiency, power factor, load characteristics of FC stacks, and exact modelling of subcomponents are considered in estimating the vehicle fuel efficiency[5].
In order to gauge the fuel consumption of FCEV, FC stacks with load characteristics shown in Fig. 7 have been applied, which can supply 80kW continuously and operates at 250~450V. Also, driving motor and compatible inverter meeting the basic requirements summarized in Table 3 and efficiency distribution has been designed properly, and their efficiency maps are shown in Fig. 8 and Fig. 9 respectively.
Fig. 7. Load Characteristics of FC stacks (250~450V, 80kW continuously)
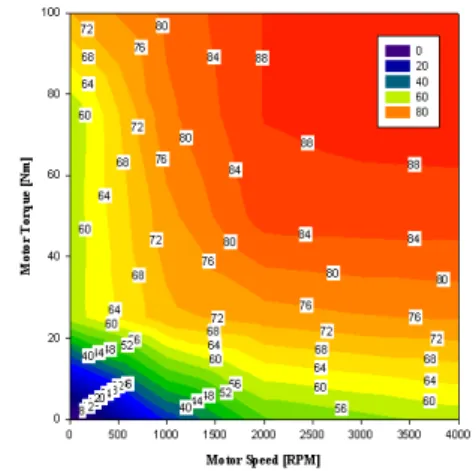
Fig. 8. Efficiency map of designed motor
Fig. 9. Efficiency map of designed inverter (Power Factor considered)
Designed electric motor with reduction gear operates analogously at 250~450V of FC stack operating voltage, and has the maximum power of 80kW. Its base and maximum speed is 3600r/min
and 12000r/min(CPSR=2.5:1), and starting torque is 212Nm. Particularly, the part map of motor efficiency is shown in Fig 8, which is specified within 4000r/min and 100Nm and favorably analogous to the highest efficient range (20~40Nm, 2500~4000r/min), as indicated in Fig. 6. In addition, the part map of inverter efficiency considering power factor is shown in Fig. 8, which manifests the higher efficiency distribution as it goes to the higher power range.
Accordingly, it is clear that the total system efficiency will be better in relatively higher power range. With given system efficiency, consumed volume of hydrogen, natural material of FC, can be estimated, which is shown in Fig. 10. Computation of consumed hydrogen has been done by following formulation.
Hydrogen Consumption[g]
=
∙
∙∆∙
(7)where
: number of stacks,
: Faraday coefficient, ∆: Hydrogen utilizing ratioFig. 10. Fuel(Hydrogen) consumption[g] in FC stacks (
=466,
=96500, ∆=0.97)As it is expected and shown in Fig. 10, Hydrogen consumption is more noticeable at higher power operating range. However, the real consumption of fuel in vehicle is directly coupled with the utilizing frequency ratio, regulated by time record. This is the concept of accumulated energy, and the real
evaluation of fuel efficiency and the establishment of design strategy to locate the highest system efficiency can be realized.
Fig. 11. Fuel consumption in FUDS mode (=consumed Hydrogen[g]×utilized time rating[sec])
Fig. 11 shows the distribution of consumed hydrogen which is extended from Fig. 10 by considering the utilized time rating. Most efficient range is not identical to primitive one(20~40Nm, 2500~4000r/min), but moved to other range(40~80Nm, 500~2500r/min) where not only electric motor and inverter, but all of other components should be designed to make system efficiency optimized for the range specified in Fig. 11.
In Fig. 12, the example of the total efficiency of E-D/T which has been designed to satisfy the requirements of better fuel efficiency favourably is shown.
Fig. 12. Total efficiency map of the designed system As is primitively summarized in Table 3, the
maximum torque and speed of E-D/T is 212Nm and 12000r/min, respectively. In fact, this operating range is much wider than the one where we have to concentrate on the better fuel efficiency, hence it is impossible to match the required system efficiency map exactly but the effort to locate the higher efficiency statistically to the specified range should be done.
Theoretically, location of best efficiency on specified range in design of electric motor leads to the position of base speed and continuous torque(power), where terminal voltage and back EMF is roughly identical. In case of inverter, efficiency gets better as it goes to higher power range, unless the excess loss from high reactive current flow or high switching frequency may happen. Main design variable of inverter can be regarded as the phase current which can regulate the allowable rating of power electronic devices[5]-[6].
Fig. 13. System input and output power (Input : Stack power, Output : Vehicle power)
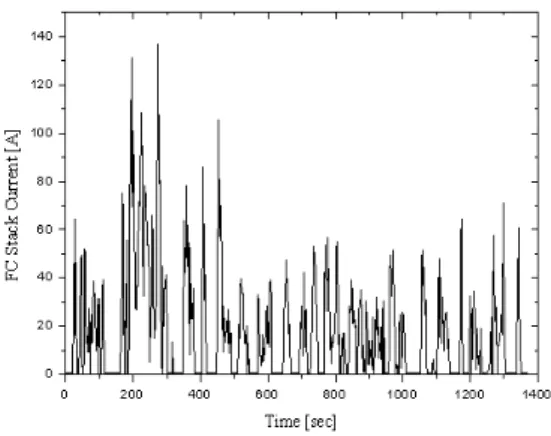
Fig. 14. Stack current in FUDS mode
In Fig. 13, system input and output power in
FCEV are compared. It seems that there is minor difference in power scale, but this difference determines the fuel efficiency remarkably. Fig. 14 shows the consumed real current in FC stack directly related to the consumed Hydrogen. Once cycling of FUDS covers 12km, and 118.1[g] of Hydrogen will be needed, which is computed by stack current and Hydrogen consumption formulation of (7). Accordingly, fuel efficiency comes to be 101.6[m/g], and approximately 335km can be covered per unit storage of Hydrogen tank of 136L/5000psi. Considering the current status of mileage still remains at 250~300km, this can be the better one, only improved by advanced design strategy to adjust the system efficiency distribution optimized for fuel efficiency.
VII. Conclusion
Procedures to define the specification of E-D/T considering the basic requirements of vehicles and fuel efficiency are presented. Classified driving loads of vehicles and officially recognized driving cycle, FUDS, are applied in regulating the performance outline of E-D/T. In addition, design consideration on E-D/T having efficiency characteristics analogous to the requirements specified from fuel efficiency is performed. Furthermore, improved fuel efficiency of vehicle with well-fitted E-D/T is shown to validate the proposed procedures.
References
[1] Mehrdad Ehsani, Khwaja M. Rahman, Hamid A.
Toliyat, “Propulsion System Design of Electric and Hybrid Vehicles,” IEEE Trans. on Industrial Electronics, Vol. 44, NO. 1, February 1997.
[2] C. C Chan, “The State of the Art of Electric and Hybrid Vehicles,” Proc. of the IEEE, Vol. 90, No. 2, February, 2002
[3] K. Rajashekara, "Propusion system strategies for fuel cell vehicle" Fuel Cell technology for Vehicles, PT-84, pp. 179-187, SAE publication, Warrendale, PA, 2001.
[4] K. Rajashekara, "Power electronics applications in electric/hybrid vehicles" in Proc. IEEE IECON 2003, vol. 3, pp. 3029-3030
[5] Yukio Honda, Tomokazu Nakamura, Toshiro Higaki, Yoji Takeda, “Motor Design Consideration and Test Results of an Interior Permanent Magnet Synchronous Motor for Electric Vehicles”, Proc. of IEEE IA annual meeting, pp. 75-82, October, 1997, New Orleans, USA.
[6] Wen L. Soong, Nesimi Ertugrul, “Field-Weakening Performance of Interior Permanent-Magnet Motors”, IEEE Trans. on IA, Vol. 38, No. 5, September 2002.
BIOGRAPHY
Jiseong Park(Student)
2008 : BS degree in Electrical Engineering, Dong-A
University.
2008~ : MS Course in
Electrical Engineering, Dong-A University.
<Research interests> : Optimal Algorithm, Design of Electric Machine
Sang-Yong Jung(Member)
1997 : BS degree in Electrical Engineering, Seoul National University.
1999 : MS degree in Electrical Engineering, Seoul National University.
2003 : PhD degree in Electrical Engineering, Seoul National University.
2003~2006 : R&D Div. of Hyundai Motor Company & Kia Motors Corporation.
2006~ : Professor in Dong-A University
<Research interests> :
Electric Machine Design based on Numerical Analysis