INTRODUCTION
Since the release of the seminal Institute of Medicine (IOM) report,
“To err is human,” improving patient safety through reduction of medical errors has become the focus of many quality improvement efforts [1]. The IOM Committee estimates that as many as 98,000 people die in any given year from medical errors in hospitals [1]. If these statistics are correct, the health care system can be considered a public health menace of epidemic proportions. In South Korea, widespread attention has begun to be paid to public issues related to ensuring patient safety, starting with the evaluation of medical institutions in 2004. Such attention has the potential to improve
patient safety/quality and reduce adverse events [2]. However, in spite of a broad awareness of older patients as a high-risk group, who tend to have greater service use and costs [3], a relatively small number of empirical studies have been conducted on adverse events in this group.
Adverse events refer to injuries caused by medical care rather than by a patient’s underlying disease [4]. Growing evidence suggests that unexpected adverse events account for a significant proportion of hospital patient deaths [5]. Particularly, failure-to-rescue (e.g., mortality), which is central to understanding an adverse event [6], is more likely to occur after a weekend admission for patients with an urgent diagnosis because of reduced staffing and decreased access to specialized services [7-10].
The Impact of Weekend Admission and Patient Safety Indicator on 30-Day Mortality among Korean Long-Term Care Insurance Beneficiaries
Jaeyong Shin
1, Jae-Hyun Kim
2,31
Department of Preventive Medicine and Public Health, Ajou University School of Medicine, Suwon;
2Department of Health Administration, Dankook University College of Health Science;
3Institute of Health Promotion and Policy, Dankook University, Cheonan, Korea
Background: This study investigates the impact of weekend admission with a patient safety indicator (PSI) on 30-day mortality among long-term insurance beneficiaries.
Methods: Data were obtained from the National Health Insurance Service–Senior claim database from 2002 to 2013. To obtain unbiased estimates of odds ratio, we used a nested case-control study design. The cases were individuals who had a 30-day mortality event after their last medical utilization, while controls were selected by incidence density sampling based on age and sex. We examined the interaction between the main independent variables of weekend admission and PSI by categorizing cases into four groups: weekend admission/PSI, weekend admission/non-PSI, weekday admission/PSI, and weekday admission/non-PSI.
Results: Of the 83,400 individuals in the database, there were 20,854 cases (25.0%) and 62,546 controls (75.0%). After adjusting for socioeconomic, health status, seasonality, and hospital-level factors, the odds ratios (ORs) of 30-day mortality for weekend admission/PSI (OR, 1.484; 95% confidence interval [CI], 1.371–1.606) and weekday admission/PSI (OR, 1.357; 95% CI, 1.298–1.419) were greater than for patients with weekday admission/non-PSI.
Conclusion: This study indicated that there is an increased risk of mortality after weekend admission among patients with PSI as compared with patients admitted during the weekday without a PSI. Therefore, our findings suggest that recognizing these different patterns is important to identify at-risk diagnosis to minimize the excess mortality associated with weekend admission in those with PSI.
Keywords: Admission; Ageing; Mortality; Safety
Correspondence to: Jae-Hyun Kim
Department of Health Administration, Dankook University College of Health Science, 119 Dandae-ro, Dongnam-gu, Cheonan 31116, Korea
Tel: +82-41-550-1472, Fax: +82-41-559-4800, E-mail: [email protected]
Received: February 1, 2019 / Revised: March 11, 2019 / Accepted after revision: March 25, 2019
© Korean Academy of Health Policy and Management
◯
㏄This is an open-access article distributed under the terms of the Creative Commons Attribution Non-Commercial License (http://creativecommons.org/licenses/by-nc/4.0) which permits unrestricted non-commercial use,
distribution, and reproduction in any medium, provided the original work is properly cited.
To better evaluate the spectrum of adverse events during inpatient care (i.e., from complications to death) and provide more information on potential in-hospital complications and adverse events, patient safety indicators (PSIs) were developed by the Agency for Healthcare Research and Quality (AHRQ) [11] and Iezzoni et al. [12]. These initial PSIs were developed using the International Classification of Disease, 9th revision (ICD-9) diagnostic codes, but the codes of the most recent iteration (the ICD-10), which is currently in use in developed countries, offer greater specificity [13]. The PSIs were selected by expert panels through an evidence-based process involving a literature review and iterative refinement of the data to limit their comprehensiveness [14]. More recently, the various limitations of existing PSIs led Southern et al. [15] to develop a new set using Canadian administrative hospital data based on a routine large-scale surveillance of hospital and health system performance. In the present analysis, we examine the in-hospital 30-day mortality of patients with a PSI and who were admitted on the weekend, and compared it with the mortality of patients admitted on weekdays and without a PSI. We hypothesized that increased mortality may be explained by both an increased number of patient safety events and a weekend admission.
METHODS
1. Study design and data source
The study data were obtained from the National Health Insurance Service–Senior (NHIS–Senior) claim database, which covers the period from 2002 to 2013. These data were released by the Korean National Health Insurance Service (KNHIS) [16]. The initial NHIS–
Senior cohort data comprised 558,147 participants, or approximately 10% of the population of individuals aged 60 years and above in 2002, who were selected using stratified random sampling. The dataset also includes information on the application of these cohort members to long-term care insurance (LTCI), beginning in 2008.
This study included individuals who were considered particularly vulnerable to an adverse event and who applied for the LTCI program at least once since 2008. We used data from the last medical utilization record before death. For the analysis, we conducted incidence density sampling to identify the effect of weekend admission and PSIs on
30-day mortality. All databases are linked anonymously using unique encrypted patient codes, in accordance with Korean laws on privacy.
Approval from an ethics committee was not required because we were analyzing encrypted claim data [16].
2. Identification of cases and controls
We conducted a nested case-control analysis. The cases for the study were identified as individuals who had a 30-day mortality event after their last medical utilization. The event date for the cases was defined as the date of the last case event. The cases were selected between the study entry date (July 1, 2008) and the study end date (December 31, 2013).
In order to obtain unbiased estimates of relative risk, controls were selected via incidence density sampling from the study base, which involves matching each case to a sample of those who are at risk at the time of case occurrence [17,18]. Potential controls for the study were individuals who remained in the risk set on the date of the 30-day mortality event for the corresponding case during the study period.
Three controls were randomly matched for each case from the pool of all eligible controls based on age and sex.
3. Independent variables
Weekend admission was investigated by determining whether
patients were admitted on a Saturday or a Sunday. PSIs were
determined by indicating the presence of 18 disease categories based
on a study of Southern et al. [15]. Southern et al. [15] queried all
hospitalizations for ICD-10-CA (Canada) diagnosis codes arising
during hospital stay and a modified Delphi panel process then was
undertaking to rate the extent to which each of the identified diagnosis
has a potential link to suboptimal quality of care. The identified
quality/safety-related diagnoses were grouped into relevant clinical
categories. Lastly, he queried Alberta hospital discharge data to assess
the frequency of the newly defined PSI events: (1) hospital-acquired
infections, (2) decubitus ulcers, (3) endocrine and metabolic
complications, (4) venous thromboembolic events, (5) cardiac
complications, (6) respiratory complications, (7) hemorrhagic events,
(8) drug-related adverse events, (9) adverse events related to fluid
management, (10) obstetrical complications affecting mothers, (11)
obstetrical complications affecting fetuses, (12) complications directly
related to surgery, (13) traumatic injury suffered in-hospital, (14) anesthesia-related complications, (15) delirium, (16) central nervous system complications, (17) gastrointestinal complications, and (18) a special category for ‘severe complications’ that are proximally threatening to life or major vital organs. The combined effects represent the difference between the weekend admission and the PSI.
We categorized participants into four groups: weekend admission/PSI, weekend admission/non-PSI, weekday admission/PSI, and weekday admission/non-PSI.
4. Dependent variable
The dependent variable was all-cause mortality over a maximum follow-up period of three days after admission, which was determined by death certificates.
5. Control variables
We selected a range of individual, time, and hospital covariates. The individual covariates included residential region, insurance type, and Charlson Comorbidity Index (CCI). Residential region was categorized as metropolitan (Seoul), urban (Daejeon, Daegu, Busan, Incheon, Kwangju, or Ulsan), and rural (otherwise). Insurance type was categorized as national health insurance or medical and. CCI was grouped as scores of 0, 1, 2, and over 3. Time variables included season and hospitalized year. Season was categorized as spring, summer, fall, and winter, while hospitalized year was categorized as 2008, 2009, 2010, 2011, 2012, and 2013. As hospital variables, we assessed organization type, hospital type, and presence of computed tomography (CT) and magnetic resonance imaging (MRI). The organization type was categorized as public, corporate, and private, while the hospital type was categorized as general hospital, hospital,
Hemorrhagic_event Complications directly related to surgery Drug-related adverse event Adverse events related to fluid management Endocrine and metabolic complications gastrointestinal
Venous thromboembolic events
Traumatic injuries(nonprocedural) arising in hospital Central nervous system complications
Decubitus ulcer Severe events proximally threatening to life or to major vital organs Cardiac complications Respiratory_complications Hospital-acquired_infection 2
8
28
32
94
118
186
497
552
1,122
1,932
2,309
4,303
4,582
Death Alive Total
0 1,000 2,000 3,000 4,000 5,000 6,000 7,000 8,000 9,000 10,000
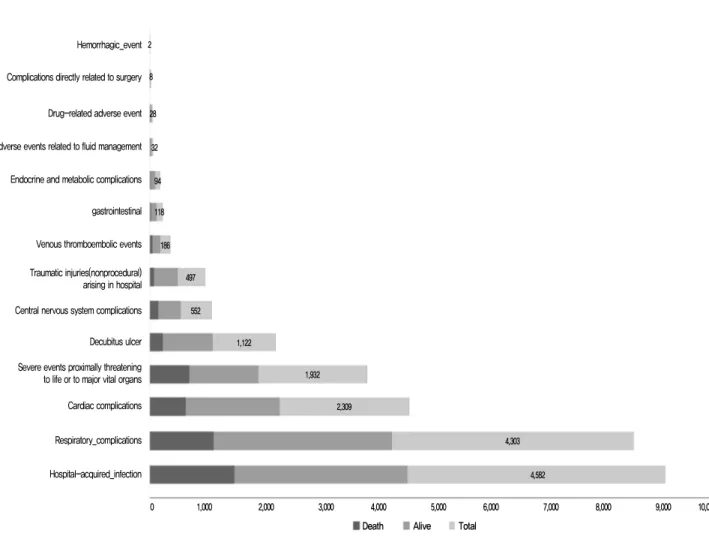
Figure 1. Composition of patient safety indicators.
Characteristic Total Death (yes) Death (no) p -value
Weekend admission & PSI <0.001
Weekend admission–PSI 3,204 (3.8) 962 (30.0) 2,242 (70.0)
Weekend admission–non-PSI 14,854 (17.8) 3,727 (25.1) 11,127 (74.9)
Weekday admission–PSI 12,561 (15.1) 3,577 (28.5) 8,984 (71.5)
Weekday admission–non-PSI 52,781 (63.3) 12,588 (23.9) 40,193 (76.2)
Sex 0.99
Male 30,730 (36.9) 7,685 (25.0) 23,045 (75.0)
Female 52,670 (63.2) 13,169 (25.0) 39,501 (75.0)
Age (yr) 83,400 (100.0) 84±7.4 84±7.4 0.93
Residential region 0.01
Metropolitan 12,622 (15.1) 3,053 (24.2) 9,569 (75.8)
Urban 18,619 (22.3) 4,795 (25.8) 13,824 (74.3)
Rural 52,159 (62.5) 13,006 (24.9) 39,153 (75.1)
Insurance type 0.05
National health insurance 67,723 (81.2) 16,838 (24.9 50,885 (75.1)
Medical aid 15,677 (18.8) 4,016 (25.6 11,661 (74.4)
Charlson Comorbidity Index 0.00
0 26,345 (31.6) 6,399 (24.3) 19,946 (75.7)
1 23,772 (28.5) 5,909 (24.9) 17,863 (75.1)
2 14,430 (17.3) 3,705 (25.7) 10,725 (74.3)
≥3 18,853 (22.6) 4,841 (25.7) 14,012 (74.3)
Season <0.001
Spring 19,066 (22.9) 4,949 (26.0) 14,117 (74.0)
Summer 20,312 (24.4) 4,887 (24.1) 15,425 (75.9)
Fall 24,595 (29.5) 5,704 (23.2) 18,891 (76.8)
Winter 19,427 (23.3) 5,314 (27.4) 14,113 (72.7)
Year <0.001
2008 5,601 (6.7) 1,195 (21.3) 4,406 (78.7)
2009 12,519 (15.0) 3,124 (25.0) 9,395 (75.1)
2010 14,870 (17.8) 3,716 (25.0) 11,154 (75.0)
2011 15,553 (18.7) 3,962 (25.5) 11,591 (74.5)
2012 17,282 (20.7) 4,406 (25.5) 12,876 (74.5)
2013 17,575 (21.1) 4,451 (25.3) 13,124 (74.7)
Organization type <0.001
Public 5,514 (6.6) 1,269 (23.0) 4,245 (77.0)
Corporate 48,175 (57.8) 11,710 (24.3) 36,465 (75.7)
Private 29,711 (35.6) 7,875 (26.5) 21,836 (73.5)
Hospital type <0.001
General hospital 32,963 (39.5) 7,240 (22.0) 25,723 (78.0)
Hospital 17,043 (20.4) 3,950 (23.2) 13,093 (76.8)
Others 33,394 (40.0) 9,664 (28.9) 23,730 (71.1)
Presence of computed tomography <0.001
Yes 48,424 (58.1) 10,890 (22.5) 37,534 (77.5)
No 34,976 (41.9) 9,964 (28.5) 25,012 (71.5)
Presence of magnetic resonance imaging <0.001
Yes 40,479 (48.5) 8,901 (22.0) 31,578 (78.0)
No 42,921 (51.5) 11,953 (27.9) 30,968 (72.2)
Total 83,400 (100.0) 20,854 (25.0) 62,546 (75.0)
Values are presented as number (%) or mean±standard deviation.
PSI, patient safety indicator.
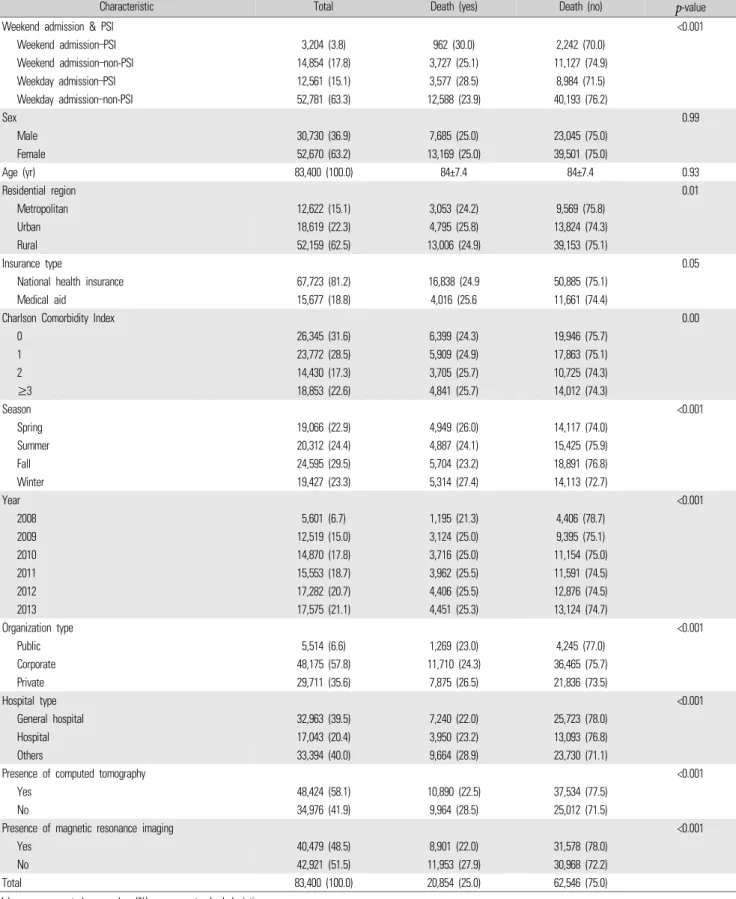
Table 1. General characteristics of participants
and others (including clinics). The presence of CT and MRI were both categorized as yes or no.
6. Statistical analysis
In this study, all statistical analyses were conducted using SAS ver.
9.4 (SAS Institute Inc., Cary, NC, USA). We used conditional logistic regression analysis for matched case-control studies, calculating the odds ratio (ORs) and 95% confidence interval (CIs) for each exposure variable. All estimated ORs were conditional on the matching factors.
Differences in covariate distribution between cases and controls were evaluated using chi-square tests and t-tests for categorical and continuous variables, respectively. All statistical tests were two-tailed, and the null hypothesis (suggesting no difference) was rejected if p<0.05.
RESULTS
1. General characteristics of cardiovascular disease intensive care unit patients
Regarding the distribution of PSIs, 4,582 patients (29.1%) had hospital-acquired infection, among whom 1,506 patients (32.9%) had a 30-day mortality event. Furthermore, 4,303 patients (27.3%) had respiratory complications, among whom 30-day mortality events were observed in 1,136 patients (26.4%). Of the 1,932 patients (12.3%) who had severe events proximally threatening to life or major vital organs, the 30-day mortality rate was 36.2% (n=699) (Figure 1).
Table 1 shows the in-hospital 30-day mortality according to patients’ general characteristics. Of the 83,400 patients, 20,854 cases (25.0%) experienced a 30-day mortality event in-hospital.
Furthermore, of all patients, the 30-day mortality rates among patients in the weekend admission/PSI, weekday admission/PSI, and weekday admission/non-PSI groups were 30.0% (n=962), 28.5% (n=3,577), and 23.9% (n=12,588), respectively.
2. Adjusted effects for in-hospital 30-day mortality
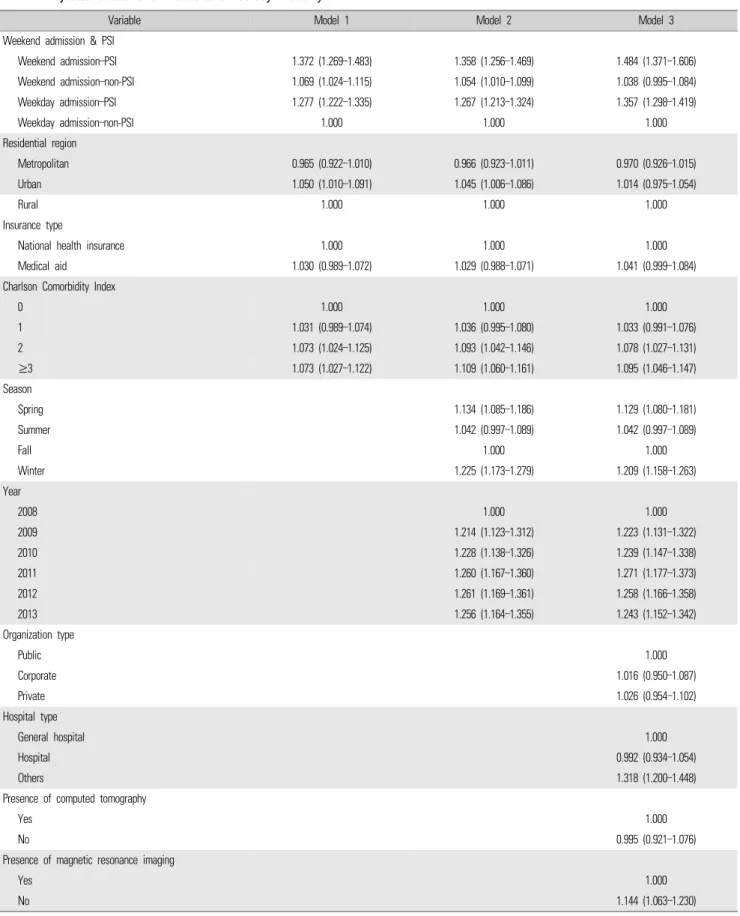
In model 1, wherein we adjusted for individual factors such as residential region, insurance type, and CCI, the odds of 30-day mortality in patients with weekend admission and a PSI were 1.372
times greater (95% CI, 1.269–1.483) than in patients with weekday admission and no PSI. By contrast, the odds for patients with weekday admission and a PSI were 1.277 times higher (95% CI, 1.222–1.335) than for patients with weekday admission and no PSI. In model 2, after adding the time factors (season and hospitalized year) to the model 1 variables, the odds of 30-day mortality in patients with weekend admission and a PSI increased—namely, they were 1.358 times greater (95% CI, 1.256–1.469) than in patients with weekday admission and no PSI. By contrast, the odds of 30-day mortality in patients with weekday admission and a PSI were about the same, at 1.267 times higher (95% CI, 1.213–1.324) than in the reference group. Finally, in model 3, we adjusted for individual, time, and hospital factors (organization type, hospital type, and presence of CT and MRI). After adjustment, the ORs for 30-day mortality in the weekend admission/PSI (OR, 1.484; 95% CI, 1.371–1.606) and weekday admission/PSI (OR, 1.357; 95% CI, 1.298–1.419) groups were greater compared to in both models 1 and 2. Furthermore, the odds of 30-day mortality among patients in the weekend admission/non-PSI group (95% CI, 0.995–1.084) were 1.038 times greater than in the reference group, but this was not statistically significant (Table 2).
DISCUSSION
In this nationwide elderly population-based study, we found
statistically significant differences exist in 30-day mortality among
elderly population vulnerable to adverse events according to whether
they were admitted on a weekend and had a PSI. Importantly, after
adjusting for hospital-level covariates, the odds of 30-day mortality in
the weekend admission/PSI and weekday admission/PSI groups
increased compared to when only individual (model 1) or when both
individual and time (model 2) factors were adjusted for. This suggests
that the higher rate of 30-day mortality after a weekend admission
might be linked to the structural and process limitations inherent to
hospitals during weekends [6]. In addition, having a PSI was
significantly associated with greater odds of 30-day mortality rate
(OR, 1.357; 95% CI, 1.371–1.606) than was not having a PSI, and these
odds further increased when individuals were admitted during a
weekend (OR, 1.484; 95% CI, 1.371–1.606). Furthermore, as expected,
Variable Model 1 Model 2 Model 3 Weekend admission & PSI
Weekend admission–PSI 1.372 (1.269–1.483) 1.358 (1.256–1.469) 1.484 (1.371–1.606)
Weekend admission–non-PSI 1.069 (1.024–1.115) 1.054 (1.010–1.099) 1.038 (0.995–1.084)
Weekday admission–PSI 1.277 (1.222–1.335) 1.267 (1.213–1.324) 1.357 (1.298–1.419)
Weekday admission–non-PSI 1.000 1.000 1.000
Residential region
Metropolitan 0.965 (0.922–1.010) 0.966 (0.923–1.011) 0.970 (0.926–1.015)
Urban 1.050 (1.010–1.091) 1.045 (1.006–1.086) 1.014 (0.975–1.054)
Rural 1.000 1.000 1.000
Insurance type
National health insurance 1.000 1.000 1.000
Medical aid 1.030 (0.989–1.072) 1.029 (0.988–1.071) 1.041 (0.999–1.084)
Charlson Comorbidity Index
0 1.000 1.000 1.000
1 1.031 (0.989–1.074) 1.036 (0.995–1.080) 1.033 (0.991–1.076)
2 1.073 (1.024–1.125) 1.093 (1.042–1.146) 1.078 (1.027–1.131)
≥3 1.073 (1.027–1.122) 1.109 (1.060–1.161) 1.095 (1.046–1.147)
Season
Spring 1.134 (1.085–1.186) 1.129 (1.080–1.181)
Summer 1.042 (0.997–1.089) 1.042 (0.997–1.089)
Fall 1.000 1.000
Winter 1.225 (1.173–1.279) 1.209 (1.158–1.263)
Year
2008 1.000 1.000
2009 1.214 (1.123–1.312) 1.223 (1.131–1.322)
2010 1.228 (1.138–1.326) 1.239 (1.147–1.338)
2011 1.260 (1.167–1.360) 1.271 (1.177–1.373)
2012 1.261 (1.169–1.361) 1.258 (1.166–1.358)
2013 1.256 (1.164–1.355) 1.243 (1.152–1.342)
Organization type
Public 1.000
Corporate 1.016 (0.950–1.087)
Private 1.026 (0.954–1.102)
Hospital type
General hospital 1.000
Hospital 0.992 (0.934–1.054)
Others 1.318 (1.200–1.448)
Presence of computed tomography
Yes 1.000
No 0.995 (0.921–1.076)
Presence of magnetic resonance imaging
Yes 1.000
No 1.144 (1.063–1.230)
Values are presented as odds ratio (95% confidence interval).
PSI, patient safety indicator.