pISSN 2288-3886 / eISSN 2288-3959
선형계획법을 이용한 한국 성인의 최적 식품섭취패턴 설계 (Ⅰ) : 2010 ~ 2014년 국민건강영양조사 자료 분석
아사노가나1· 양홍석2· 이영미3· 윤지현1,4†
서울대학교 식품영양학과1 서울대학교 경영학과2 명지대학교 식품영양학과3 서울대학교 생활과학연구소4
Designing optimized food intake patterns for Korean adults using linear
programming (Ⅰ): analysis of data from the 2010 ~ 2014 Korea National Health and Nutrition Examination Survey
Asano, Kana1· Yang, Hongsuk2· Lee, Youngmi3· Yoon, Jihyun1,4†
1Department of Food and Nutrition, Seoul National University, Seoul 08826, Korea
2Department of Business Administration, Seoul National University, Seoul 08826, Korea
3Department of Food and Nutrition, Myongji University, Yongin, Gyeonggi 17058, Korea
4Research Institute of Human Ecology, Seoul National University, Seoul 08826, Korea
ABSTRACT
Purpose: The aim of this study was to design optimized food intake patterns that meet the nutritional recommendations with minimal changes from the current food intake patterns among Korean adults using linear programming. Methods: Data of a one day 24-hour dietary recall from the 2010 ~ 2014 Korea National Health and Nutrition Survey were used to quantify the food items that Korean adults usually consumed. These food items were categorized into seven groups and 24 subgroups.
The mean intakes and intake distributions of the food groups and the food subgroups were calculated for eight age (19 ~ 29, 30 ~ 49, 50 ~ 64, and over 65 years old) and gender (male and female) groups. A linear programming model was constructed to minimize the difference between the optimized and mean intakes of the food subgroups while meeting the Dietary Reference Intakes for Koreans (KDRIs) for energy and 13 nutrients, and not exceeding the typical quantities of each food subgroup consumed by the respective age and gender groups. Results: The optimized food intake patterns, which were a set of quantities of 24 food subgroups, were obtained mathematically for eight age and gender groups. Overall, major modifications of current diet were required to increase the intake of vegetables and milk/dairy products and decrease the Kimchi intake. The optimized intake of seasonings, including salt, was calculated to be 0 g for all the age and gender groups.
Conclusion: The optimized food intake patterns designed using linear programming in this study lack feasibility because they suggest a seasoning consumption of 0 g. Modification of intake goal for sodium is needed to obtain optimized food intake patterns with improved feasibility.
KEY WORDS: linear programming, nutritional requirements, nutrition surveys, food
Received: October 15, 2017 / Revised: November 5, 2017 / Accepted: January 17, 2018
†
To whom correspondence should be addressed.
tel: +82-2-880-8750, e-mail: [email protected]
© 2018 The Korean Nutrition Society
This is an Open Access article distributed under the terms of the Creative Commons Attribution Non-Commercial License (http://creative- commons. org/licenses/by-nc/3.0/) which permits unrestricted non-commercial use, distribution, and reproduction in any medium, provided the original work is properly cited.
서 론
영양섭취기준은 국민의 건강증진 및 질병예방을 위하여 에너지 및 각 영양소의 적정 섭취량을 나타낸 것으로 개인 과 집단의 식사계획 수립과 평가에 활용될 수 있다 .
1그러 나 영양섭취기준만을 충족한 식사는 무한히 구성될 수 있
으나 이러한 식사는 영양적인 조건을 충족하더라도 현실 적인 식품섭취 범위를 벗어날 수도 있다.
2,3식습관은 쉽게 바꾸기가 어려우므로 영양섭취기준을 만족하는 이상적인 식품섭취량이 현재 식품섭취 상태와 크게 차이가 나면 실 생활에서 실현하기가 쉽지 않다.
이러한 문제를 해결할 수 있는 방법의 하나로 경영학의
Male (n = 11,345)
Female (n = 12,796)
Total (n = 24,141) n (%)
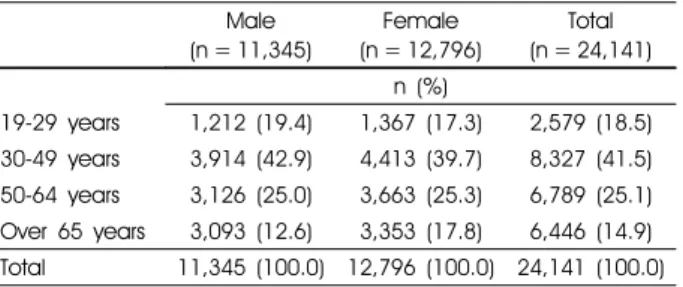
19-29 years 1,212 (19.4) 1,367 (17.3) 2,579 (18.5) 30-49 years 3,914 (42.9) 4,413 (39.7) 8,327 (41.5) 50-64 years 3,126 (25.0) 3,663 (25.3) 6,789 (25.1) Over 65 years 3,093 (12.6) 3,353 (17.8) 6,446 (14.9) Total 11,345 (100.0) 12,796 (100.0) 24,141 (100.0) Data were analyzed using complex sample module.
Table 1. Age and gender distribution of study subjects
계량적 분석방법으로 알려진 선형계획법이 있다. 선형계 획법은 다양한 제약조건을 충족하면서 주어진 목적함수의 값을 최대화 또는 최소화하는 의사결정변수의 값을 구하 는 수리계획법의 일종으로 목적함수와 제약조건식이 모두 1차식으로 표현되는 가장 단순한 형태이다.
4제외국에서 는 영양학 분야에 선형계획법을 이용한 연구들이 이루어 지고 있는데, 선형계획법을 이용해서 대상자의 실제 식품 섭취패턴에 가깝고 영양섭취기준도 함께 충족하는 최적 식품섭취패턴을 산출한 연구 ,
5,6선형계획법을 이용해서 산 출된 식품섭취패턴을 바탕으로 식사지침을 개발한 연구들 이 있다 .
7,8또한 기존의 식사지침에서 설정된 영양소 기준 의 타당성을 검토할 때에도 선형계획법이 이용되었다.
9,10일본에서도 현재 식품섭취패턴에서 크게 벗어나지 않으 면서 영양섭취기준을 충족하는 식품섭취패턴이 선형계획 법을 이용하여 연구된 바 있다 .
6산출된 최적 식품섭취패 턴에서는 현재 식품섭취패턴에 비해 현미 · 통밀과 같은 정제되지 않는 곡류와 저지방 유제품을 보다 많이 섭취해 야 하는 것으로 나타났다. 또한 조미료의 섭취량은 크게 줄여야 하는 것으로 나타나 , 영양섭취기준 중 나트륨은 목 표량에 맞게 섭취하기가 가장 어려운 영양소인 것으로 파 악되었다. 일본 후생노동성은 이러한 방법을 일본인의 장 수를 뒷받침하는 ‘건강한 식사’의 기준 설정 시 적용하였 고,
11이 기준에서 일본의 전통적인 식사구성인 주식, 주찬 (단백질 반찬), 부찬 (채소 반찬) 각각의 에너지와 염분의 상한 기준 및 탄수화물과 단백질, 채소 섭취량의 범위가 제시되었다 .
12이와 같이 선형계획법은 현재 섭취량을 바탕으로 이를 어느 정도 변화시키면 영양적인 조건을 충족할 수 있을지 알려주는 효율적인 방법으로 영양학 분야에서 이용되어 왔다. 그러나 한국의 영양학 분야에서는 아직 선형계획법 을 이용한 연구는 보고된 바 없다 . 따라서 본 연구는 현재 의 식품섭취패턴에서 크게 벗어나지 않으면서 영양섭취기 준을 충족하는 한국 성인의 최적 식품섭취패턴을 설계하 는 것을 목적으로 수행되었다. 본 논문 (연구 Ⅰ)에서는 2015 한국인 영양소 섭취기준에 제시된 에너지와 13개 영 양소의 섭취기준을 제약조건으로 최적 식품섭취패턴을 선 형계획법을 이용하여 설계한 부분을 보고하였다 . 후속 논 문 (연구 Ⅱ)에서는 제약조건 중 나트륨의 영양섭취기준 변화에 따른 최적 식품섭취패턴을 설계하였다.
연구방법
연구 자료
본 연구는 국민건강영양조사 제 5기 (2010 ~ 2012)와 제6기
1, 2차년도 (2013, 2014)의 식품섭취조사 자료를 이용하였다.
만 19세 이상 성인 총 25,034명 중 임신수유부 (498명), 임신 및 수유여부에 대한 변수에 결측값이 있는 사람 (6명)과 하루 에너지섭취량이 이상치 범위 (500 kcal 미만 혹은 5,000 kcal 초과)에 해당되는 사람 389명)을 제외한 총 24,141명의 1일 24시간 회상법 원시자료를 분석하였다.
선형계획법에서 에너지 및 영양소의 제약조건으로 2015 한국인 영양소 섭취기준
13에 제시된 값을 설정하기 때문에 분석 대상자를 한국인 영양소 섭취기준의 연령구분과 동 일하게 성별 (남, 여), 연령별 (만 19 ~ 29세, 30 ~ 49세, 50
~ 64세, 65세 이상) 여덟 집단으로 분류하였다. 단, 65세 이상 대상자에 대해서는 65 ~ 74세와 75세 이상을 통합하 여 하나의 집단으로 분류하였다 (Table 1).
분석 내용 및 방법
식품군 · 식품품목 분류체계 설정
2015 한국인 영양소 섭취기준
13에서 제시된 식사구성안 은 여섯 가지 식품군으로 구성된 권장식사패턴을 제시하고 있다. 이러한 식품군은 22개의 식품품목을 포함한다. 여섯 개 식품군은 곡류군, 고기 · 생선 · 달걀 · 콩류군, 채소류군, 과일류군, 우유 · 유제품류군, 유지 · 당류군으로 구성되고, 22개의 식품품목은 곡류, 면류, 떡류, 빵류, 씨리얼류, 감자 류, 기타, 과자류, 육류, 어패류, 난류, 콩류, 견과류, 채소 류, 해조류, 버섯류, 과일류, 주스류, 우유, 유제품, 유지류, 당류로 구성된다 .
본 연구에서는 2015 한국인 영양소 섭취기준
13의 식사구
성안에서 이용된 식품군과 식품품목을 기초로 연구의 목
적에 맞는 새로운 식품군 · 식품품목 분류체계를 설정하였
다. 그 결과, 새로 설정한 식품군 · 식품품목 분류체계는 일
곱 개 식품군과 24개 식품품목으로 구성되었다. 일곱 개
식품군은 곡류군, 고기 · 생선 · 달걀 · 콩류군, 채소 · 해조 ·
버섯 · 곡류 · 서류군, 김치류군, 과일류군, 우유 · 유제품류
군, 기타군으로 분류하였고, 24개 식품품목은 밥류, 면류,
빵류, 떡류, 육류, 어패류, 난류, 콩류, 채소류, 해조류, 버
섯류, 곡류 · 서류, 김치, 장아찌, 과일류, 우유 · 유제품류,
Food group Food subgroup
Number of foods included
Examples of foods included
1. Grains 1-1. Rice 12 Milled rice, glutinous rice, barley, etc.
1-2. Noodles 14 Instant noodles, noodles, buckwheat noodles, etc.
1-3. Bread 2 Loaf bread, bread (others)
1-4. Rice cake 1 Galaetteok eaten as ‘sliced rice cake soup’ and ‘rice cake and mandu soup’
2. Meat, fish, eggs, and legumes
2-1. Meat 24 Pork, chicken, beef, etc.
2-2. Seafood 142 Fish cake, mackerel, squid, etc.
2-3. Eggs 3 Eggs, quail eggs, duck eggs
2-4. Legumes 21 Tofu, soybean, soft tofu, etc.
3. Vegetables, seaweed, mushrooms, and starchy vegetables
3-1. Vegetables 130 Onion, white radish, tomato, etc.
3-2. Seaweed 23 Sea mustard, laver, sea tangle, etc.
3-3. Mushrooms 15 Oyster mushroom, pine mushroom, oak mushroom, etc.
3-4. Starchy vegetables 13 Potatoes, acorn jelly, corn, etc.
4. Pickled vegetables 4-1. Kimchi 14 Chinese cabbage Kimchi, radish Kimchi, young radish Kimchi, etc.
4-2. Jangajji 11 Salted radish, pickled perilla leaves, Korean pickled cucumbers, etc.
5. Fruits 5. Fruits 47 Apple, mandarin orange, watermelon, etc.
6. Milk and dairy products 6. Milk and dairy products 10 Milk, yogurt, cheese, etc.
7. Others 7-1. Fats and oils 14 Soybean oil, sesame oil, rapeseed oil, etc.
7-2. Sugar 8 Sugar, starch syrup, honey, etc.
7-3. Rice cake, bread, and confectionary
41 Rice cake, cereal, bread with jam, etc.
7-4. Alcoholic beverages 16 Beer, Korean distilled spirits, Korean rice wine, etc.
7-5. Non-alcoholic beverages 45 Coffee, cola, fruit drinks, etc.
7-6. Seasonings including salt 50 Soy sauce, soybean paste, salt, etc.
7-7. Nuts and seeds 18 Peanut, sesame, almond, etc.
7-8. Other starchy products 8 Wheat flour, starch flour, bread crumb, etc.
Table 2. Classification of food groups and food subgroups in the study
유지류, 당류, 떡 · 빵 · 과자류, 알코올음료, 기호음료, 조미 료, 견과류, 기타 곡류로 분류하였다.
이러한 본 연구의 분류체계를 식사구성안
13의 분류체계 와 비교하면 다음과 같다 . 본 연구에서는 식사패턴과의 연 계를 고려하여 ‘곡류군’을 주로 주식으로 섭취하는 밥류 (식사구성안의 ‘곡류’에 해당), 면류, 빵류, 떡류로 분류하
였다.
14,15떡류에 대해서는 주로 간식이나 식사대용으로
섭취하지만
16떡국, 떡만둣국으로 섭취하는 가래떡은 주식 의 개념으로 섭취하고 있다. 따라서 떡국, 떡만둣국으로 섭취하는 가래떡은 곡류군으로 분류하였다. 견과류는 육 류, 어패류, 난류, 콩류에 비해 부식으로 활용되는 경우가 많지 않고 ,
17부식으로 활용이 되더라도 주재료라기보다는 다른 식재료와 혼합해서 활용될 경우가 많다. 또한 견과류 를 간식으로 먹는 경우도 있기 때문에 본 연구에서는 견과 류를 ‘고기 · 생선 · 달걀 · 콩류군’에서 제외하고 ‘기타군’에 포함시켰다 . ‘채소 · 해조 · 버섯 · 곡류 · 서류군’의 곡류 · 서 류에는 식사구성안
13에서 ‘곡류군’의 감자류에 포함된 감 자와 고구마, ‘곡류군’의 기타에 포함된 묵, ‘곡류군’의 곡 류에 포함된 옥수수를 포함시켰다. 식사구성안
13에서는
‘채소류군’에 김치가 포함되어 있다. 그러나 한국인의 식 사패턴 기본형태는 밥, 국 또는 찌개, 김치에 한 두 가지의 반찬이 포함된 형태를 취하고 있으므로,
14,18김치류는 따 로 채소류와 분류할 필요가 있다고 판단하여 식품군에 ‘김 치류군’을 추가하였다.
‘과일류군’은 과일류만 포함시키고 주스류는 ‘기타군’의 기호음료로 분류하였다. 또한 ‘우유 · 유제품류군’은 식사 구성안에서는 우유와 유제품으로 분류되었으나 본 연구에 서는 일본의 선행연구
6,11에 따라 우유와 유제품을 분류하 지 않고 우유 · 유제품류로 하였다. ‘기타군’으로 분류한 떡
· 빵 · 과자류에는 식사구성안에서 ‘곡류군’으로 분류된 떡 국, 떡만둣국 이외로 섭취하는 가래떡과 떡 (팥소, 시루떡 등), 빵류 중 빵 (쨈빵, 팥빵 등), 씨리얼류, 과자류를 분류 하였다. 기타 곡류에는 식사구성안에서 ‘곡류군’으로 분류 된 기타에 포함된 밀가루, 전분, 빵가루, 부침가루, 튀김가 루, 믹스를 포함시켰다. 결론적으로 본 연구에서 설정한 식품군 · 식품품목 분류체계는 Table 2와 같다.
이 식품군 · 식품품목 분류체계에 따라 분석 대상자가 세
끼니 (아침, 점심, 저녁)에서 섭취한 682개의 식품목록을
분류하였다 . 분석 대상자가 세 끼니 이외에서 섭취한 간식 에 대해서는 본 연구의 최종 목적이 한 끼 식사의 기준을 개발하는 것이었기 때문에 제외하였다 .
식품군 · 식품품목별 섭취량 계산
성 및 연령별 여덟 집단에 대해 각 식품군 · 식품품목에 대한 1인 1일 평균섭취량과 섭취량 범위 (10
th, 90
th백분위 수)를 산출하였다. 떡류의 1인 1일 평균섭취량 산출 시 떡 국, 떡만둣국으로 섭취한 가래떡의 1인 1일 평균섭취량을 산출하고 이를 곡류군 중 떡류의 1인 1일 평균섭취량으로 하였고 , 이 이외의 가래떡에 대해서는 가래떡의 총 1인 1일 평균섭취량에서 떡국과 떡만둣국으로 섭취한 가래떡의 섭 취량을 제외해서 산출하였다. 식품군 · 식품품목별 섭취량 산출 시 복합표본분석을 실시하였고 자료 분석에는 EXCEL 2010 (Microsoft Corporation, Redmond, WA)과 SPSS 21.0 (IBM SPSS Inc., Chicago, IL, USA)을 이용하였다.
식품품목별 영양성분 프로파일 산출
24개 식품품목별로 대표식품을 선정하였다. 성 및 연령 별 여덟 집단에 대해서 각 식품품목의 1인 1일 평균섭취 량 중 각 식품의 1인 1일 평균섭취량이 차지하는 비율 (가 중치)을 산출하고 그 가중치가 0.01 이상인 식품들을 식품 품목별 대표식품으로 선정하였다.
19식품품목을 구성하는 대표식품들의 1인 1일 평균섭취량의 합에 대하여 대표식 품의 1인 1일 평균섭취량이 차지하는 비율을 산출하고 이 를 대표식품별 가중치로 하였다 .
선정된 대표식품별로 100 g 당 에너지 및 영양소 (탄수 화물 , 단백질, 지방, 비타민 A, 비타민 C, 티아민, 리보플라 빈, 나이아신, 칼슘, 인, 나트륨, 칼륨, 철) 함량을 산출하였 고 이에 대표식품별 가중치를 곱한 값의 합을 식품품목별 영양성분 프로파일로 하였고 여덟 집단 각각에 대해서 산 출하였다 . 이 영양성분 프로파일은 에너지 및 영양소에 대 한 제약조건을 설정함에 있어서 식품품목별 최적섭취량에 따른 에너지 및 영양소 함량 산출에 이용되었다 . 대표식품 별 1인 1일 평균섭취량과 대표식품별 100 g 당 에너지 및 영양소 함량 산출 시 복합표본분석을 실시하였고 자료 분 석에는 EXCEL 2010 (Microsoft Corporation, Redmond, WA)과 SPSS 21.0 (IBM SPSS Inc., Chicago, IL, USA)을 이용하였다 .
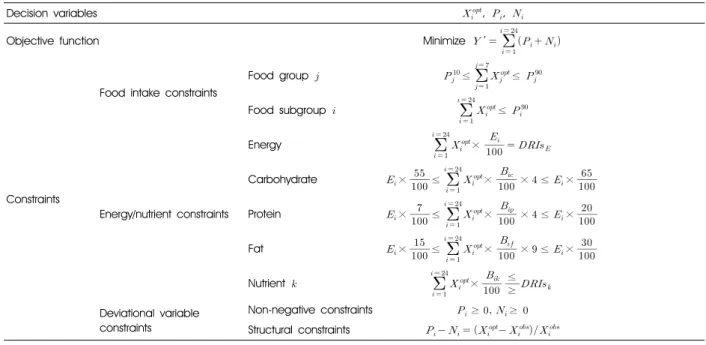
선형계획 모형 설정
본 연구에서 최종적으로 설정한 선형계획 모형은 Table 3과 같다.
영양섭취기준을 충족하면서 평균섭취량과의 차이가 최
소화되는 식품품목별 최적섭취량 (
)을 의사결정변수 로 하였고, 대상 집단에서 식품품목별 최적섭취량과 산출 한 평균섭취량 간의 편차의 최소화를 목적함수 ()로 하 였다. 목적함수 는 식품품목별 최적섭취량 (
)에서 식품품목별 실제섭취량 (
), 즉 산출한 평균섭취량을 뺀 후 식품품목별 실제섭취량으로 나눈 절댓값의 합으로 정의된다. 목적함수 는 다음과 같은 수식으로 표현된다.
Minimize
식품품목 1 ~ 24 (1: 밥류, 2: 면류, 3: 빵류, 4: 떡류, 5: 육류, 6: 어패류, 7: 난류, 8: 콩류, 9: 채소류, 10: 해조류, 11: 버섯류, 12: 곡류 · 서류, 13: 김치, 14: 장아찌, 15: 과 일류, 16: 우유 · 유제품, 17: 유지류, 18: 당류, 19: 떡 · 빵
· 과자류, 20: 알코올음료, 21: 기호음료, 22: 조미료, 23:
견과류, 24: 기타 곡류)
이 수식에서 는 24개 식품품목에 해당된다. 절댓값으로 표현된 는 비선형이기 때문에 선형계획법의 목적함수로 이용할 수가 없어서 목적계획법을 이용해서
201차함수로 전환해야 한다 . 이때 0 이상의 값을 가지는 새로운 의사결 정변수가 생성되는데, 이 변수는 식품품목별 최적섭취량 과 실제섭취량 간의 차이를 나타내는 정의 편차 (
)와 부 의 편차 (
)로 표현된다. 새로운 의사결정변수 (
,
)는 다음과 같이 정의된다.
′ 라고 불리는 새로운 1차 함수는 편차변수의 합으로 표현되고 다음과 같은 수식으로 표현된다.
Minimize ′
선형계획법을 이용해서 산출된 식품품목별 최적섭취량 은 실제섭취량과의 편차를 최소화할 뿐 아니라 영양학적 으로 이상적인 기준인 영양섭취기준을 충족할 필요가 있 다. 또한 절댓값으로 표현되는 목적함수를 1차함수로 전 환하는 과정에서 새로 설정된 의사결정변수인 정의 편차 (
)와 부의 편차 (
)에 대해서도 제약조건을 설정할 필 요가 있다. 따라서 식품섭취량, 에너지 및 영양소, 편차변 수에 관한 제약조건을 다음과 같이 설정하였다.
먼저 식품섭취량에 관한 제약조건은 식품품목별 최적섭
취량이 대상 집단에서 관찰된 실제섭취량 범위 내로 정해
Decision variables , ,
Objective function Minimize
′
Constraints
Food intake constraints
Food group
≤
≤
Food subgroup
≤
Energy/nutrient constraints
Energy
×
Carbohydrate
×
≤
×
× ≤
×
Protein
×
≤
×
× ≤
×
Fat
×
≤
×
× ≤
×
Nutrient
×
≥
≤
Deviational variable constraints
Non-negative constraints
≥
≥
Structural constraints
: Optimized intake of food subgroup
: Positive deviation of food subgroup
: Negative deviation of food subgroup
: Food group 1 ~ 7(1: Grains, 2: Meat, fish, eggs, and legumes, 3: Vegetables, seaweed, mushrooms, and starchy vegetables, 4: Pickled vegetables, 5: Fruits, 6: Milk and dairy products, 7: Others)
: 10th percentile of the observed distribution in the food group
: 90th percentile of the observed distribution in the food group
: Food subgroup 1 ~ 24(1: Rice, 2: Noodles, 3: Bread, 4: Rice cake, 5: Meat, 6: Seafood, 7: Eggs, 8: Legumes, 9: Vegetables, 10: Seaweed, 11: Mushrooms, 12: Starchy vegetables, 13: Kimchi, 14: Jangajji, 15: Fruits, 16: Milk and dairy products, 17: Fats and oils, 18: Sugar, 19: Rice cake, bread, and confectionary, 20: Alcoholic beverages, 21: Non-alcoholic beverages, 22: Seasonings including salt, 23: Nuts and seeds, 24: Other starchy products)
: 90th percentile of the observed distribution in the food subgroup
: Amount of energy in 100 g of the food subgroup
: Amount of carbohydrate in 100 g of the food subgroup
: Amount of protein in 100 g of the food subgroup
: Amount of fat in 100 g of the food subgroup
: Nutrient 1 ~ 11(1: Protein, 2: Vitamin A, 3: Vitamin C, 4: Thiamin, 5: Riboflavin, 6: Niacin, 7: Calcium, 8: Phosphorus, 9: Sodium, 10: Potassium, 11: Iron)
: Amount of the nutrient
in 100 g of the food subgroup
: Observed intake of food subgroup
Table 3. The liner programming model used in the study
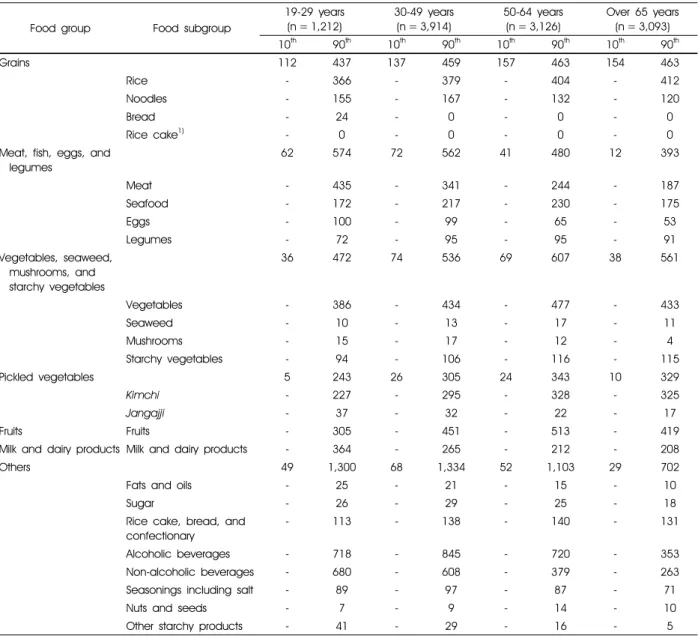
지도록 설정하였다. 선행연구
10를 참고하여 일곱 개 식품 군에 대해서는 하한 기준을 10
th백분위수로, 상한 기준을 90
th백분위수로 각각 설정하였다. 또한 24개의 식품품목 에 대해서는 각 식품품목 중 섭취하지 않는 식품품목도 있 기 때문에 하한 기준은 설정하지 않고 상한 기준 (90
th백 분위수)만을 제약조건으로 설정하였다. 설정한 식품군과 식품품목의 제약조건을 남녀 각각 Table 4와 Table 5에 제 시하였다. 빵류 혹은 떡류 (떡국, 떡만둣국으로 섭취하는 가래떡)의 상한 기준으로 설정한 90
th백분위수가 0 g으로 제시된 것은 섭취량이 적은 사람부터 정렬하였을 때 90
th백분위수에 해당하는 값이 0 g이라는 것을 의미한다. 즉,
빵류와 떡류의 섭취량 분포를 보았을 때 빵류에서는 19 ~ 29세를 제외한 남성과 50세 이상의 여성 집단, 떡류에서 는 성 및 연령별 여덟 집단 모두에서 90% 이상이 전혀 섭 취하지 않는 것으로 나타났다.
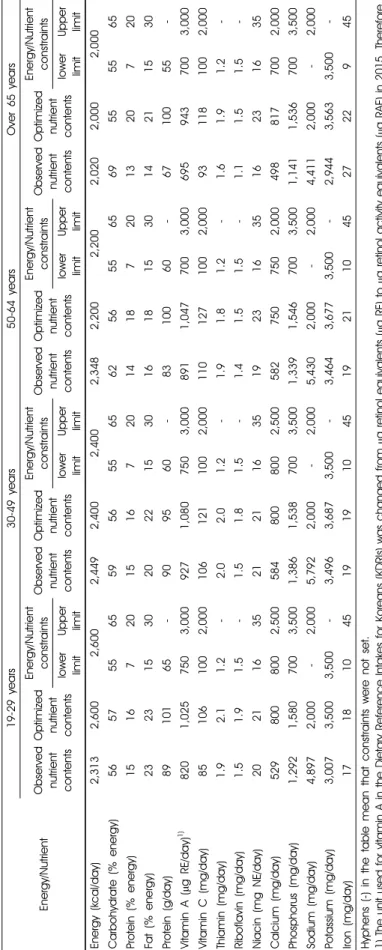
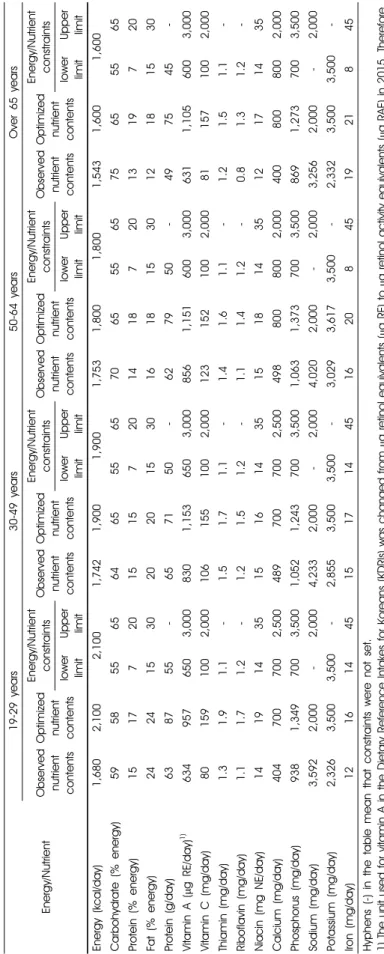
에너지와 영양소의 제약조건으로 성 및 연령별 여덟 집
단 각각에 대해서 2015 한국인 영양소 섭취기준
13에 제시
된 에너지와 13개 영양소 (탄수화물, 단백질, 지방, 비타민
A, 비타민 C, 티아민, 리보플라빈, 나이아신, 칼슘, 인, 나
트륨, 칼륨, 철)의 섭취기준을 설정하였다. 에너지에 대해
서는 에너지필요추정량과 동일한 값을 제약조건으로 설정
하였다. 탄수화물, 단백질, 지방에 대해서는 에너지적정비
Food group Food subgroup
19-29 years (n = 1,212)
30-49 years (n = 3,914)
50-64 years (n = 3,126)
Over 65 years (n = 3,093)
10th 90th 10th 90th 10th 90th 10th 90th
Grains 112 437 137 459 157 463 154 463
Rice - 366 - 379 - 404 - 412
Noodles - 155 - 167 - 132 - 120
Bread - 24 - 0 - 0 - 0
Rice cake1) - 0 - 0 - 0 - 0
Meat, fish, eggs, and legumes
62 574 72 562 41 480 12 393
Meat - 435 - 341 - 244 - 187
Seafood - 172 - 217 - 230 - 175
Eggs - 100 - 99 - 65 - 53
Legumes - 72 - 95 - 95 - 91
Vegetables, seaweed, mushrooms, and starchy vegetables
36 472 74 536 69 607 38 561
Vegetables - 386 - 434 - 477 - 433
Seaweed - 10 - 13 - 17 - 11
Mushrooms - 15 - 17 - 12 - 4
Starchy vegetables - 94 - 106 - 116 - 115
Pickled vegetables 5 243 26 305 24 343 10 329
Kimchi
- 227 - 295 - 328 - 325Jangajji
- 37 - 32 - 22 - 17Fruits Fruits - 305 - 451 - 513 - 419
Milk and dairy products Milk and dairy products - 364 - 265 - 212 - 208
Others 49 1,300 68 1,334 52 1,103 29 702
Fats and oils - 25 - 21 - 15 - 10
Sugar - 26 - 29 - 25 - 18
Rice cake, bread, and confectionary
- 113 - 138 - 140 - 131
Alcoholic beverages - 718 - 845 - 720 - 353
Non-alcoholic beverages - 680 - 608 - 379 - 263
Seasonings including salt - 89 - 97 - 87 - 71
Nuts and seeds - 7 - 9 - 14 - 10
Other starchy products - 41 - 29 - 16 - 5
Data were analyzed using complex sample module.
10th: 10th percentile of the observed distribution in the food group or food subgroup obtained by analyzing the data of a one day 24-hour dietary recall from the 2010-2014 Korea National Health and Nutrition Survey
90th: 90th percentile of the observed distribution in the food group or food subgroup obtained by analyzing the data of a one day 24-hour dietary recall from the 2010-2014 Korea National Health and Nutrition Survey
Hyphens (-) in the table mean that constraints were not set.
1) Including ‘Galaetteok’ eaten as ‘Sliced rice cake soup’ and ‘Rice cake and mandu soup’
Table 4. Food intake constrains applied to the linear programming models for Korean male adults
율 (탄수화물: 55 ~ 65%, 단백질: 7 ~ 20%, 지방: 15 ~ 30%) 을 제약조건으로 설정하였다. 13개 영양소 중 권장섭취량 이 설정된 영양소 (단백질, 비타민 A, 비타민 C, 티아민, 리보플라빈 , 나이아신, 칼슘, 인, 철)에 대해서는 권장섭취 량을, 충분섭취량이 설정된 영양소 (칼륨)에 대해서는 충 분섭취량의 값을 하한 기준으로 설정하였다. 목표섭취량 이 설정된 영양소 (나트륨)에 대해서는 목표섭취량의 값을 상한 기준으로 하였고 상한섭취량이 설정된 영양소 (비타
민 A, 비타민 C, 나이아신, 칼슘, 인, 철)에 대해서는 상한
섭취량의 값을 상한 기준으로 설정하였다. 2010 한국인 영
양섭취기준
21에서는 레티놀당량 (Retinol Equivalents, RE)
을 사용하였으나, 2015 한국인 영양소 섭취기준
13에서는
레티놀활성당량 (Retinol Activity Equivalents, RAE)을 사
용하였다. 그러나 본 연구에서 이용한 국민건강영양조사
자료에서는 비타민 A의 단위로 레티놀당량 (RE)을 사용
하고 있기 때문에 비타민 A의 제약조건 설정에는 2010 한
Food group Food subgroup
19-29 years (n = 1,367)
30-49 years (n = 4,413)
50-64 years (n = 3,663)
Over 65 years (n = 3,353)
10th 90th 10th 90th 10th 90th 10th 90th
Grains 60 334 85 353 99 367 119 391
Rice - 250 - 289 - 326 - 364
Noodles - 124 - 120 - 107 - 58
Bread - 40 - 26 - 0 - 0
Rice cake1) - 0 - 0 - 0 - 0
Meat, fish, eggs, and legumes
39 404 36 386 20 341 2 268
Meat - 277 - 211 - 163 - 100
Seafood - 141 - 157 - 152 - 126
Eggs - 74 - 74 - 54 - 29
Legumes - 47 - 76 - 77 - 61
Vegetables, seaweed, mushrooms, and starchy vegetables
31 396 51 513 53 581 28 475
Vegetables - 300 - 396 - 427 - 357
Seaweed - 8 - 15 - 15 - 9
Mushrooms - 12 - 18 - 10 - 2
Starchy vegetables - 99 - 125 - 170 - 125
Pickled vegetables 0 155 12 231 12 252 0 248
Kimchi
- 145 - 219 - 240 - 242Jangajji
- 38 - 29 - 21 - 14Fruits Fruits - 361 - 510 - 653 - 398
Milk and dairy products Milk and dairy products - 312 - 283 - 250 - 208
Others 45 1,053 40 788 29 601 16 400
Fats and oils - 18 - 14 - 12 - 7
Sugar - 21 - 19 - 16 - 11
Rice cake, bread, and confectionary
- 116 - 136 - 156 - 144
Alcoholic beverages - 338 - 270 - 56 - 0
Non-alcoholic beverages - 653 - 451 - 347 - 218
Seasonings including salt - 68 - 71 - 66 - 53
Nuts and seeds - 5 - 8 - 14 - 5
Other starchy products - 30 - 23 - 14 - 5
Data were analyzed using complex sample module.
10th: 10th percentile of the observed distribution in the food group or food subgroup obtained by analyzing the data of a one day 24-hour dietary recall from the 2010-2014 Korea National Health and Nutrition Survey
90th: 90th percentile of the observed distribution in the food group or food subgroup obtained by analyzing the data of a one day 24-hour dietary recall from the 2010-2014 Korea National Health and Nutrition Survey
Hyphens (-) in the table mean that constraints were not set.
1) Including ‘Galaetteok’ eaten as ‘Sliced rice cake soup’ and ‘Rice cake and mandu soup’
Table 5. Food intake constrains applied to the linear programming models for Korean female adults
국인 영양섭취기준
21에 따랐다.
마지막으로 편차변수에 관한 제약조건으로 편차변수가 0 이상의 값을 가지도록 음수가 될 수 없음을 요구하는 비 음수 조건식과 구조적 제약조건식을 설정하였다.
한국 성인의 최적 식품섭취패턴 산출
설정한 선형계획 모형의 해 , 즉 24개 식품품목에 대한 최적섭취량을 여덟 집단별로 산출하였다 . 이러한 해의 산
출에는 Microsoft EXCEL SOLVER 프로그램 (Frontline System Inc., NV, USA)을 이용하였다.
한국 성인의 최적 식품섭취패턴에 따른 에너지 및 영양소 함량 산출
산출된 최적 식품섭취패턴에 따른 에너지 및 영양소 함
량을 식품품목별 영양성분 프로파일을 이용하여 산출하였
다. 즉, 식품품목별 최적섭취량에 식품품목별 영양성분 프
Food group Food subgroup
19-29 years 30-49 years 50-64 years Over 65 years Observed
intake1) (g/day)
Optimized intake (g/day)
Observed intake1) (g/day)
Optimized intake (g/day)
Observed intake1) (g/day)
Optimized intake (g/day)
Observed intake1) (g/day)
Optimized intake (g/day)
Grains Rice 201.36 234.15 229.38 188.21 257.65 188.20 267.84 163.23
Noodles 53.87 49.00 50.52 49.41 36.81 36.81 28.78 28.78
Bread 10.65 10.65 7.34 0.00 4.56 0.00 2.87 0.00
Rice cake2) 2.59 0.00 2.48 0.00 3.51 0.00 2.38 0.00
Meat, fish, eggs, and legumes
Meat 164.59 183.61 135.44 135.44 91.74 93.91 68.23 172.28
Seafood 62.81 62.81 82.24 110.26 84.69 201.16 62.25 169.86
Eggs 36.68 36.68 34.14 34.14 22.20 22.20 13.35 18.59
Legumes 27.33 27.33 34.26 34.26 35.09 35.09 32.29 32.29
Vegetables, seaweed, mushrooms, and starchy vegetables
Vegetables 184.92 386.16 224.74 434.43 244.03 476.64 207.86 433.06
Seaweed 8.86 8.86 9.35 9.35 11.82 11.82 8.36 8.36
Mushrooms 6.15 6.15 6.12 6.12 4.44 4.44 3.51 3.51
Starchy vegetables 30.17 30.17 40.68 40.68 43.18 43.18 38.68 38.68
Pickled vegetables
Kimchi
100.36 6.77 143.58 15.94 151.25 30.19 138.78 55.38Jangajji
11.63 11.63 10.22 10.22 7.49 7.49 5.51 5.51Fruits Fruits 98.70 98.70 153.87 153.87 176.92 176.92 147.46 147.46
Milk and dairy products Milk and dairy products 113.39 364.00 76.98 265.00 57.82 57.82 49.11 145.67
Others Fats and oils 10.15 10.15 8.78 8.78 5.76 5.76 3.47 3.47
Sugar 8.64 8.64 10.57 10.57 9.07 9.07 6.22 6.22
Rice cake, bread, and confectionary
42.24 42.24 44.63 44.63 44.36 44.36 40.95 40.95
Alcoholic beverages 181.91 181.91 250.89 250.89 232.06 232.06 109.86 109.86 Non-alcoholic beverages 257.57 257.57 213.32 213.32 127.31 127.31 86.90 86.90 Seasonings including salt 41.18 0.00 47.42 0.00 43.16 0.00 33.60 0.00
Nuts and seeds 3.01 3.01 4.38 4.38 6.03 6.03 4.55 4.55
Other starchy products 12.85 12.85 9.14 9.14 6.48 6.48 3.39 3.39 1) Data were analyzed using complex sample module. 2) Including ‘Galaetteok’ eaten as ‘Sliced rice cake soup’ and ‘Rice cake and mandu soup’
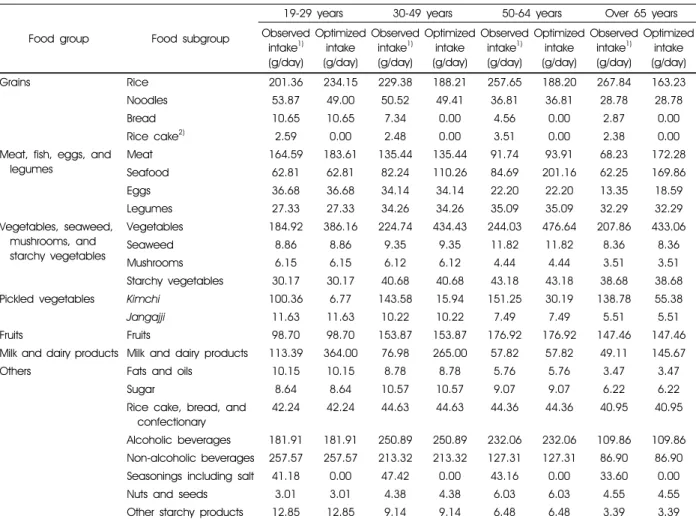
Table 6. Comparison of food subgroup amounts between observed and optimized food intake patterns among Korean male adults
로파일 (식품품목별 100 g 당 에너지 및 13개 영양소의 함 량)을 곱하여 100으로 나눈 값을 합산하여 산출하였다.
결 과
한국 성인의 최적 식품섭취패턴
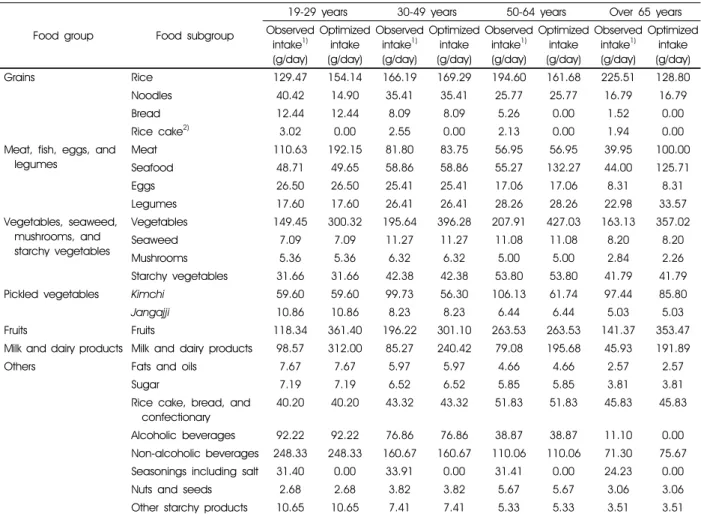
최적 식품섭취패턴으로 24개 식품품목별 최적섭취량이 성 및 연령별 여덟 집단 각각에 대해 산출되었다 . 식품품 목별 최적섭취량을 실제섭취량과 비교한 결과를 남녀 각 각 Table 6과 Table 7에 제시하였다.
식품품목별 실제섭취량에 대해 살펴보면, 곡류군 중에 서 밥류의 섭취량은 연령대가 높을수록 증가하는 경향이 보였으나, 면류, 빵류에서는 연령대가 높을수록 섭취량이 감소하는 경향이 남녀 모두에서 확인되었다. 육류, 난류, 우유 · 유제품류에 있어서는 연령대가 높을수록 섭취량이 감소하는 경향이 보였다. 어패류, 채소류, 해조류에서는 남녀 모두에서 19 ~ 29세와 65세 이상의 섭취량이 30 ~ 64
세에 비해 낮았다. 또한 남녀 각각 50 ~ 64세에서 채소류, 과일류, 김치의 섭취량이 가장 높게 나타났고, 19 ~ 29세에 서 난류와 장아찌의 섭취량이 다른 연령대에 비해 가장 높 았다. 특히 김치는 19 ~ 29세 여성을 제외한 모든 연령대 에서 하루에 평균 100 g 안팎으로 섭취하고 있었다.
선형계획법을 이용해서 산출된 식품품목별 최적섭취량 과 실제섭취량을 비교한 결과, 모든 집단에서 공통적으로 채소류, 50 ~ 64세 남성을 제외한 집단에서 우유 · 유제품 류의 최적섭취량이 실제섭취량보다 높게 나타났다. 특히 채소류의 최적섭취량은 제약조건으로 설정한 90
th백분위 수와 동일한 값으로 산출되었다. 50 ~ 64세를 제외한 모든 여성 집단에서는 채소류와 우유 · 유제품류 이외에 과일류 의 최적섭취량도 높게 나타났다. 한편, 모든 남성 집단과 19 ~ 29세를 제외한 여성 집단에서 김치의 최적섭취량이 실제섭취량보다 낮게 나타났고 조미료에 대해서는 모든 집단에서 공통적으로 최적섭취량이 0 g으로 산출되었다.
연령대별로 살펴보면, 19 ~ 29세의 젊은 연령대에서는
Food group Food subgroup
19-29 years 30-49 years 50-64 years Over 65 years Observed
intake1) (g/day)
Optimized intake (g/day)
Observed intake1) (g/day)
Optimized intake (g/day)
Observed intake1) (g/day)
Optimized intake (g/day)
Observed intake1) (g/day)
Optimized intake (g/day)
Grains Rice 129.47 154.14 166.19 169.29 194.60 161.68 225.51 128.80
Noodles 40.42 14.90 35.41 35.41 25.77 25.77 16.79 16.79
Bread 12.44 12.44 8.09 8.09 5.26 0.00 1.52 0.00
Rice cake2) 3.02 0.00 2.55 0.00 2.13 0.00 1.94 0.00
Meat, fish, eggs, and legumes
Meat 110.63 192.15 81.80 83.75 56.95 56.95 39.95 100.00
Seafood 48.71 49.65 58.86 58.86 55.27 132.27 44.00 125.71
Eggs 26.50 26.50 25.41 25.41 17.06 17.06 8.31 8.31
Legumes 17.60 17.60 26.41 26.41 28.26 28.26 22.98 33.57
Vegetables, seaweed, mushrooms, and starchy vegetables
Vegetables 149.45 300.32 195.64 396.28 207.91 427.03 163.13 357.02
Seaweed 7.09 7.09 11.27 11.27 11.08 11.08 8.20 8.20
Mushrooms 5.36 5.36 6.32 6.32 5.00 5.00 2.84 2.26
Starchy vegetables 31.66 31.66 42.38 42.38 53.80 53.80 41.79 41.79
Pickled vegetables
Kimchi
59.60 59.60 99.73 56.30 106.13 61.74 97.44 85.80Jangajji
10.86 10.86 8.23 8.23 6.44 6.44 5.03 5.03Fruits Fruits 118.34 361.40 196.22 301.10 263.53 263.53 141.37 353.47
Milk and dairy products Milk and dairy products 98.57 312.00 85.27 240.42 79.08 195.68 45.93 191.89
Others Fats and oils 7.67 7.67 5.97 5.97 4.66 4.66 2.57 2.57
Sugar 7.19 7.19 6.52 6.52 5.85 5.85 3.81 3.81
Rice cake, bread, and confectionary
40.20 40.20 43.32 43.32 51.83 51.83 45.83 45.83
Alcoholic beverages 92.22 92.22 76.86 76.86 38.87 38.87 11.10 0.00 Non-alcoholic beverages 248.33 248.33 160.67 160.67 110.06 110.06 71.30 75.67 Seasonings including salt 31.40 0.00 33.91 0.00 31.41 0.00 24.23 0.00
Nuts and seeds 2.68 2.68 3.82 3.82 5.67 5.67 3.06 3.06
Other starchy products 10.65 10.65 7.41 7.41 5.33 5.33 3.51 3.51 1) Data were analyzed using complex sample module. 2) Including ‘Galaetteok’ eaten as ‘Sliced rice cake soup’ and ‘Rice cake and mandu soup’
Table 7. Comparison of food subgroup amounts between observed and optimized food intake patterns among Korean female adults
남녀 모두에서 밥류의 최적섭취량이 실제섭취량에 비해 높게 나타났다 . 30세 이상의 남성과 50세 이상의 여성에서 는 빵류의 최적섭취량은 0 g으로 산출되었고 떡류에 대해 서는 모든 연령대에서 최적섭취량이 0 g으로 산출되었다.
또한 연령대가 높을수록 고기 · 생선 · 달걀 · 콩류군에 해당 되는 육류, 어패류 등의 식품품목의 최적섭취량이 실제섭 취량보다 높게 나타났다 .
한국 성인의 최적 식품섭취패턴에 따른 에너지 및 영양소 함량