Introduction
Among the patients admitted to intensive care units (ICUs), those requiring ventilator care consume high amounts of medical resources and incur much expense
1,2. Several studies have suggested that an important factor contributing to the high cost of health care may be associated with the clinician decision-making at the patient’s bedside
3-6. Accordingly, the length of stay of a patient in the ICU would be expected to be longer, and it may be helpful for critical-care physicians to de- termine at an early stage if these patients would really benefit from ICU care.
Recently, some reports described a novel subpopulation of patients on mechanical ventilation (MV): those who require
The Prognostic Value of the Charlson’s Comorbidity Index in Patients with
Prolonged Acute Mechanical Ventilation: A Single Center Experience
Seung Eon Song, M.D.
1, Sang Hee Lee, M.D.
2, Eun-Jung Jo, M.D.
1, Jung Seop Eom, M.D.
1, Jeong Ha Mok, M.D.
1, Mi-Hyun Kim, M.D.
1, Ki Uk Kim, M.D.
1, Min Ki Lee, M.D.
1and Kwangha Lee, M.D.
11
Division of Pulmonary, Allergy and Critical Care Medicine, Department of Internal Medicine, Pusan National University School of Medicine, Busan,
2Division of Pulmonology, Department of Internal Medicine, Wonkwang University Sanbon Hospital, Gunpo, Korea
Background: The aim of our study was to evaluate the prognostic value of Charlson’s weighted index of comorbidities (WIC) in patients with prolonged acute mechanical ventilation (PAMV, ventilator care ≥96 hours).
Methods: We retrospectively enrolled 299 Korean PAMV patients who were admitted in a medical intensive care unit (ICU) of a university-affiliated tertiary care hospital between 2008 and 2013. Survivors were defined as patients who survived for 60 days after ICU admission.
Results: The patients’ mean age was 65.1±14.1 years and 70.6% were male. The mean ICU and hospital length of stay was 21.9±19.7 and 39.4±39.1 days, respectively. In addition, the 60-day mortality rate after ICU admission was 35.5%. The mean WIC was 2.3±1.8, with significant differences between nonsurvivors and survivors (2.7±2.1 vs. 2.1±1.7, p<0.05). The area under the curve of receiver-operating-characteristics curve for WIC was 0.593 (95% confidence interval [CI], 0.523–
0.661; p<0.05). Based on Kaplan-Meier curves of 60-day survival, WIC ≥5 had statistically lower survival than WIC <5 (log- rank test, p<0.05). In a multivariate Cox proportional hazard model, WIC ≥5 was associated with poor prognosis (hazard ratio, 1.901; 95% CI, 1.140–3.171; p<0.05). The mortality rate of patients with WIC ≥5 was 54.2%.
Conclusion: Our study showed a WIC score ≥5 might be helpful in predicting 60-day mortality in PAMV patients.
Keywords: Intensive Care Units; Comorbidity; Respiration, Artificial; Prognosis
Copyright © 2016
The Korean Academy of Tuberculosis and Respiratory Diseases.
All rights reserved.
Address for correspondence: Kwangha Lee, M.D., Ph.D.
Division of Pulmonary, Allergy and Critical Care Medicine, Department of Internal Medicine, Pusan National University School of Medicine, 179 Gudeok-ro, Seo-gu, Busan 49241, Korea
Phone: 82-51-240-7743, Fax: 82-52-245-3127 E-mail: [email protected]
Received: Dec. 14, 2015 Revised: Feb. 4, 2016 Accepted: Aug. 10, 2016
cc
It is identical to the Creative Commons Attribution Non-Commercial
License (http://creativecommons.org/licenses/by-nc/4.0/).
MV for ≥96 hour, referred to as “prolonged acute mechani- cal ventilation” (PAMV) cases
2,7-9. These studies reported that PAMV patients constituted one-third of all hospitalized patients undergoing MV and consumed two thirds of the medical resources of all MV patients
2,7-9. Also, these patients are projected to increase in the years to come
7,8. Thus, further research needs to focus on more accurately characterizing the clinical outcomes and prognostic factors for such patients.
When critical care physicians discuss and guide the goal of care and prognosis of PAMV patients, a mortality prediction model would be necessary to address prognostic uncertainty.
Although clinical parameters on their clinical course would be associated with clinical outcomes, the concurrent comorbidi- ties before admission should be considered. In the existing literature, Charlson’s weighted index of comorbidities (WIC) has been suggested to have a predictive value
10and has also been shown to predict hospital mortality in critically ill pa- tients
10-14. In existing literature, there were some reports about the validity and utility of Charlson’s WIC in relation to other illness scores (such as Acute Physiology and Chronic Health Evaluation [APACHE] II and Sequential Organ Failure Assess- ment [SOFA] scores) in predicting the outcome of critically ill patients
11-16. Based on previous reports, we hypothesized the role of this index as a prognostic model for PAMV population.
This study sought to investigate the prognostic value of Charlson’s WIC in predicting 60-day mortality after MV in pa- tients defined as PAMV cases in a medical ICU of a university- affiliated tertiary care center in South Korea.
Materials and Methods
1. Study design
This retrospective study was conducted in Pusan National University Hospital, Republic of Korea, a university-affiliated tertiary care hospital with a 12-bed medical ICU with full car- diovascular and close airway monitoring as well as a separate seven-bed adult coronary care unit. The physician staff in the medical ICU consisted of one full-time specialist, one clinical fellow in pulmonary and critical care medicine, two resident physicians, and one intern. Fellows and resident physicians provided overnight care, and the nurse-to-bed ratio was 1:3.
Full-time physical and respiratory rehabilitation therapies were available for all patients. Consultation services were ac- cessible for all the subspecialists in the hospital. All patients were managed according to therapeutic recommendations based on early goal-directed therapy and a lung-protective ventilator strategy
17,18.
2. Study subjects
Patients defined as PAMV cases within the period from
March 1, 2008, to February 28, 2013 were included in this study. The PAMV patients were those who had undergone MV for longer than 4 days in the ICU
2, regardless of tracheos- tomy. The exclusion criteria included patients younger than 18 years who received ventilator care prior to ICU admission.
The medical records and laboratory and radiological findings of all the patients were reviewed. The investigators completed a case report form, and data were collected from March to June 2014. The three investigators (S.E.S., S.H.L., and K.L.) con- firmed that the study objectives and procedures were honest- ly disclosed, and all had full access to all the study data. This study was conducted with approval from the Institutional Re- view Board of Pusan National University Hospital (E-2015127).
This study had no impact on the patient treatment.
3. Data collection
The following data were gathered from the medical records of each patient: age, gender, body mass index, presence of shock on the ICU admission day, duration of MV, and length of stay in the ICU and hospital. The ICU and in-hospital mor- tality for all the patients were recorded. The APACHE II and SOFA scores were calculated to quantify the severity of the illness and the degree of organ dysfunction, respectively, using the data from the first 24 hours of ICU admission
15,16. Charl- son’s WIC, acquired from the medical records of all the pa- tients’ comorbidities before the catastrophic illness requiring ICU care, was calculated to predict the effect of the underlying diseases on the patient outcomes
10. The major diagnoses lead- ing to MV were also collected. We also evaluated the do-not- resuscitate (DNR) status records of the patients within 4 days after ICU admission. The survivors were defined as patients who had survived for 60 days after ICU admission.
4. Statistical analysis
The continuous variables were expressed as median values with the range or mean±standard deviation, and the categori- cal variables were expressed as numbers (percentages). Stu- dent’s t test and Mann-Whitney U test were used to compare the continuous variables, and the chi-square and Fisher exact tests (for small numbers) were used to compare the categori- cal variables. To evaluate the relationship between WIC and the other clinical variables, the Pearson’s correlation coef- ficient (γ) was calculated. Receiver operating characteristic (ROC) curves and the area under the curve (AUC) were used.
Univariate Cox proportional hazard models were developed to determine the relationship between WIC and mortality.
Variables with p<0.05 were included in the multivariate Cox
proportional hazard model. Survival curves were prepared
using the Kaplan-Meier method with the log-rank test. All the
statistical analyses were performed using the Statistical Pack-
age for the Social Sciences (version 19.0, IBM Corp., Armonk,
NY, USA) program. A two-tailed p-value <0.05 was considered to indicate a significant difference.
Results
A total of 754 patients who had been admitted to the medi- cal ICU and to whom MV was applied during the study period were identified. Among them, 311 patients (41.2%) met the definition of PAMV. Among these patients, 12 patients (3.9%) had DNR order given before day 4 of MV. We appropriately
excluded them because this would be effective modified of prognosis. For the total enrolled patients (n=299), the ICU and in-hospital mortality rates were 41.5 and 42.1%, respectively.
In addition, the 60-day mortality rate after ICU admission was 35.5%. Table 1 shows the results of the baseline characteristics of all enrolled patients, and the results of the comparisons be- tween the survivors and the nonsurvivors.
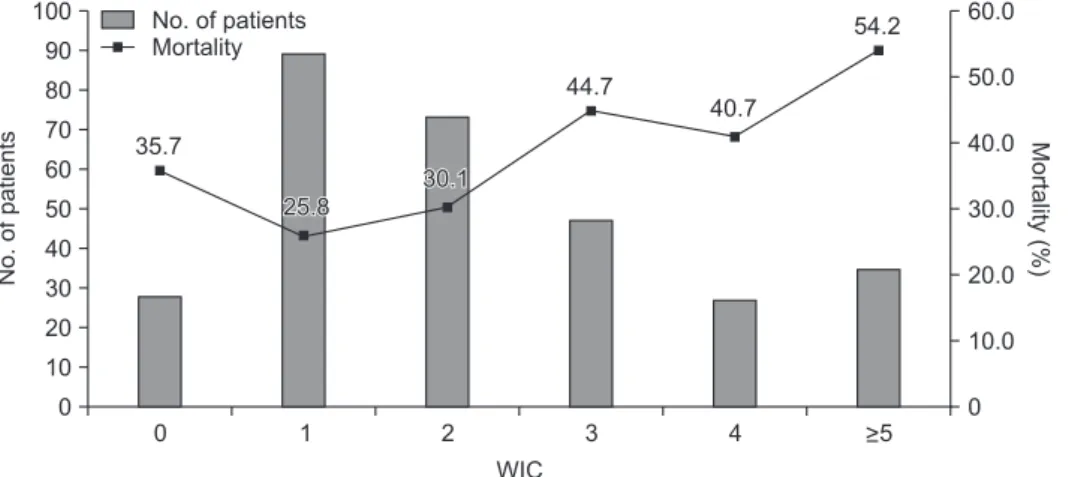
The enrolled patients had an average WIC of 2.3±1.8 and a median WIC of 2 (range, 0–11). The number of patients for each WIC level and the corresponding mortality are shown in Figure 1. Results of the investigation of all the components of
Table 1. Comparison of baseline characteristics between survivors and nonsurvivors
Characteristic Total (n=299) Survivor (n=193) Nonsurvivor (n=106) p-value
Age, yr 65.1±14.1 64.0±14.1 67.2±14.1 0.058
Male 211 (70.6) 133 (68.9) 78 (73.6) 0.428
Body mass index, kg/m
221.7±4.0 21.9±3.6 21.3±4.6 0.219
ICU LOS, day 21.9±19.7 24.7±22.8 16.9±10.6 <0.001
Hospital LOS, day 39.4±39.1 49.0±44.9 22.0±14.0 <0.001
APACHE II score on admission day 17.1±6.0 16.5±5.9 18.1±6.1 0.028
SOFA score on admission day 4.9±2.5 4.9±2.5 5.0±2.7 0.921
Total MV days 17.9±19.5 19.2±22.9 15.6±10.4 0.130
Shock on admission day 223 (74.6) 138 (71.5) 85 (80.2) 0.126
Major diagnosis leading to MV
Pneumonia without ARDS 148 (49.5) 97 (50.2) 51 (48.1) 0.809
Pneumonia with ARDS 59 (19.7) 16 (8.3) 43 (40.6) <0.001
Cardiogenic pulmonary edema 55 (18.4) 48 (24.9) 7 (6.6) <0.001
Aspiration 20 (6.7) 17 (8.8) 3 (2.8) 0.054
AE of chronic lung diseases* 17 (5.7) 15 (7.8) 2 (1.9) 0.038
Values are presented as mean±standard deviation or number (%).
*Chronic lung diseases: chronic obstructive pulmonary disease, asthma, and bronchiectasis.
ICU LOS: intensive care unit length of stay; APACHE: Acute Physiology and Chronic Health Evaluation; SOFA: Sequential Organ Failure Assessment; MV: mechanical ventilation; ARDS: acute respiratory distress syndrome; AE: acute exacerbation.
100 90 80 70 60 50 40 30 20 10
No.ofpatients
0 0 1 2 3 4
WIC
60.0 50.0 40.0 30.0 20.0 10.0
Mortality(%)
>5 0 No. of patients
Mortality
35.7
25.8
25.8 30.130.1
44.7 40.7
54.2
Figure 1. The number of patients for each
Charlson’s weighted index of comorbidi-
ties (WIC) score (left Y axis) and the cor-
responding mortality (right Y axis).
WIC and their matching patients are shown in Table 2. Table 2 also shows the comparisons between survivors and nonsurvi- vors according to the components of WIC.
When the relationship between WIC and the clinical vari- ables upon admission were analyzed, it was found that the WIC score was positively correlated with the APACHE II (γ=0.321, p<0.001) and SOFA (γ=0.224, p<0.001) scores on ad- mission day, respectively.
When the WIC scores of the nonsurvivors and survivors were compared, it was found that the nonsurvivors had signifi- cantly higher WIC scores than the survivors (2.7±2.1 vs. 2.1±1.7, p=0.008). The AUC of the ROC curve for WIC in our cohort was 0.592 (95% confidence interval, 0.523–0.661; p=0.008).
Kaplan-Meier curves of 60-day survival are shown in Figure 2. Survival curves showed WIC ≥5 had statistically significant differences than other WIC scores (log-rank test, p=0.027). In a univariate Cox proportional hazard model, four clinical factors were associated with poor prognosis (p<0.05): WIC more than or equal to 5; presence of shock on ICU admission day; acute respiratory distress syndrome (ARDS) on ICU admission day;
and APACHE II score of more than or equal to 17 (the cut-off level was determined by ROC curves).
After adjusting for age and sex, these factors were included in a multivariate model: 3 factors (WIC ≥5, ARDS on ICU ad-
mission day, and APACHE II ≥17) were independently associ- ated with the 60-day mortality (Table 3). The mortality rate of patients with WIC ≥5 was 54.2%.
Table 2. Comparison of the components of Charlson’s weighted index of comorbidities between survivors and nonsurvivors Assigned weight for
underlying disorder Underlying disorder Total (n=299)
Survivor (n=193)
Nonsurvivor
(n=106) p-value
1 Myocardial infarction 16 (5.4) 5 (2.6) 11 (10.4) 0.006
Congestive heart failure 54 (18.1) 35 (18.1) 19 (17.9) >0.999
Peripheral vascular disease 5 (1.7) 5 (2.6) 0 (0) 0.165
Cerebrovascular disease 70 (23.4) 49 (25.4) 21 (19.8) 0.319
Dementia 9 (3.0) 6 (3.1) 3 (2.8) >0.999
Chronic pulmonary disease 124 (41.5) 75 (38.9) 49 (46.2) 0.223
Connective tissue disease 19 (6.4) 16 (8.3) 3 (2.8) 0.082
Ulcer disease 22 (7.4) 15 (7.8) 7 (6.6) 0.819
Mild liver disease 23 (7.7) 16 (8.3) 7 (6.6) 0.658
Diabetes 69 (23.1) 45 (23.3) 24 (22.6) >0.999
2 Hemiplegia 16 (5.4) 13 (6.7) 3 (2.8) 0.186
Moderate and severe renal disease 39 (13.0) 19 (9.8) 20 (18.9) 0.032
Diabetes with end-organ damage 15 (5.0) 9 (4.7) 6 (5.7) 0.784
Any tumor 37 (12.4) 15 (7.8) 22 (20.8) 0.002
Leukemia 1 (0.3) 1 (0.5) 0 (0.0) >0.999
Lymphoma 1 (0.3) 1 (0.5) 0 (0.0) >0.999
3 Moderate and severe liver disease 11 (3.7) 4 (2.1) 7 (6.6) 0.058
6 Metastatic tumor 6 (2.0) 3 (1.6) 3 (2.8) 0.670
Acquired immune deficiency syndrome 0 (0) 0 (0) 0 (0) Not applicable
Value are presented as number (%).
Proportionofsurvivors
0
0 60
Time since ICU admission (day) 1.0
0.8 0.6 0.4 0.2
50 40 30
10 20
p=0.027 Above 5 12 04 3 WIC score