A Comparison of Various Energy and Protein Concentrations in Diets on the Performance, Bone Mineral Density and Blood Characteristics of Broiler Chicks
Ho Sung Choe
1, Jae Sang Um
2and Kyeong Seon Ryu
3,†1
Department of Animal Biotechnology, Chonbuk National University, Jeonju 561-756 Korea,
2
Nonghyup Feed Inc., Seoul 134-763 Korea,
3
Department of Animal Science, Chonbuk National University, Jeonju 561-756 Korea
ABSTRACT Two experiments were conducted separately with different concentration of dietary energy and protein to evaluate the performance, blood characteristics and bone mineral density (BMD) of broiler chicks. In experimentr 1, a total of 480 heads one-day-old Ross × Ross broiler chicks were randomly divided into 6 treatments (5 replications; 16 birds/pen).
Three concentration of ME (3,000, 3,100 and 3,200 kcal/kg) and two of CP (pre-starter 22, 23%, starter 20, 21% and finisher 18, 19%) in a 3 × 2 factorial arrangement of treatments were used. In experiment 2, similar chicks and CP concentration was used but ME concentration was changed (pre-starter; 3,000, 3,050 and 3,100 kcal/kg, starter; 3,050, 3,100 and 3,150 kcal/kg, finisher; 3,100, 3,150 and 3,200 kcal/kg) in the diet. In both experiments, 10 blood and tibia samples were collected per treatment and blood characteristics and BMD were analyzed. In experiment 1, weight gain and feed intake were increased by the 3,000 kcal/kg ME in the diet (P<0.05). Serum total protein and albumin levels were increased numerically with the level of CP in the diet. Total cholesterol and HDL content were increased numerically with the energy content in the diet.
Consistently in experiment 2, weight gain was increased numerically by the energy and protein level (prestarter 3,000 × 23, starter 3,050 × 21 and finisher 3,100 kcal/kg ME and 19% CP) in the diet. Serum glucose level was increased with the energy level in the diet (P<0.05). Therefore, serum total protein, albumin, triglycerides, total cholesterol and HDL contents were tended to increase with the energy increments in the diet.
(Key words: energy, protein, performance, blood composition, broiler chicks)
†
To whom correspondence should be addressed : [email protected]
INTRODUCTION
During the last decades, genetic selection programs, imp- rovement of nutrition and rearing environments may enhance growth performance of broiler chicks (Jang et al., 2009).
Therefore, most of the nutrient requirements released by NRC (1994) may be slightly low for maximizing the growth yields of broiler chicks. But, dietary energy and protein contributing ingredients have played a major role of feed cost. Higher die- tary level of ME and CP is costly, whereas lower level may affect growth performance. On the other hand, high dietary energy content in the diet caused deposition of excess abdo- minal and carcass fat and low dietary protein have decreased meat yields and increased fat deposition (Tumova and Tei- mouri, 2010). In the Republic of Korea, the commercial poultry industry has greatly increased and broiler chicks have reached 1.8 to 2.0 kg body weight at 33 ∼35 days (Jang et al., 2009).
To meet the domestic demands in Korea, major feed ingre- dients have been imported from USA, Brazil and China etc.
Therefore, considering the high cost of feed, it is important to optimize energy and protein levels to maximize growth and meat yield of broiler chicks.
In commercial production, different levels of ME (2,926 to 3,300 kcal/kg) and CP (16 to 23%) are used in formulating broiler diets (Saleh et al., 2004a,b, Pesti, 2009). Furthermore, the efficiency of energy use decreases as the bird advances with age (Hidalgo et al., 2004). Several researchers (Saleh et al., 2004, Griffiths et al., 1977 and Bartov et al., 1974) men- tioned that increasing concentrations of dietary ME while maintaining a constant ratio to CP of broiler diets improves feed conversion without increasing fat deposition. Because providing nutrients at either an excessive or marginal concen- tration to the bird’s requirement can depress broiler growth.
On the other hand, the response of broiler chicks to dietary
ME and CP may be different according to the stage of growth and bone development. But, most previous researchers did not evaluate the level of energy and protein in different growth stage (prestarter, starter and grower) of broiler chicks. Mean- while, it is an important issue to optimize the dietary energy and protein level with different growth stage of modern broiler chicks. Therefore, two experiments were conducted consecuti- vely to optimize the levels of dietary ME and CP on the per- formance, bone mineral density and blood characteristics com- position of broiler chicks.
MATERIALS AND METHODS
1. Birds and Management
This experiment was conducted in an experimental farm, Department of Animal Science, Chonbuk National University, Korea. Chicks were bedded with rice husk and stocking den- sity (10 birds/m
2) was maintained in each pen. Supplementary heat was provided by hot water pipes (85 cm) under the floor.
The room temperature was maintained at 33 ℃ for the first week, and then reduced by 2∼3℃ per week until it reached 22℃ on 28 d, which was maintained until the end of the experiment. The mean relative humidity was 60 to 65% and was kept constant within this range throughout the experi- ment. Chicks had ad libitum access to commercial pellet and water, and diets were formulated to meet the nutrient require- ments according to NRC (1994). When the set temperature and humidity were exceeded, fan was operated automatically and circulated fresh air inside the pen. To prevent any pre- ferences for familiar odors interfering with the treatment, each pen were cleaned daily. During the two experiments, body weight and feed intake were determined at weekly intervals.
The feed conversion ratio was calculated by dividing the feed intake and weight gain. All managements of chicks and expe- rimental procedures were conducted in accordance with the Institutional Animal Care and Use Committee at Chonbuk National University, Korea.
2. Experiment 1
A total of 480 day One — day-old Ross × Ross broiler chicks (39.54 ± 0.49 g) were arranged in a factorial design
(3 × 2) in which three energy (3,000, 3,100 and 3,200 kcal/
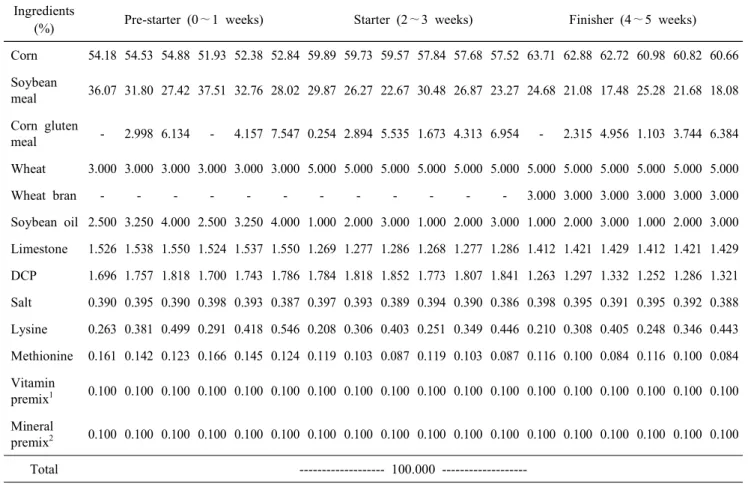
kg ME) and two protein levels (pre-starter 22, 23%, starter 20, 21% and finisher 18, 19% CP). Each treatment was re- plicated 5 times with 16 chicks per replicate. The composition of the experimental diets is shown in Table 1.
3. Blood Characteristics and Bone Mineral Den- sity
Ten birds from each treatment were selected according to mean body weight and blood samples were taken by punc- turing the wing vein, and the serum was collected at the end of the experiment, and stored at —70℃until analysis. Bioche- mical blood parameters, including glucose (GLU, mg/dL), total protein (TP, g/dL), albumin (ALB, g/dL), total cholesterol (TCL, mg/dL), triglycerides (TG, mg/dL), high density lipo- protein (HDL, mg/dL), aspartate aminotransferase (AST, U/I) and alanine aminotransferase (ALT, U/I) concentrations were measured on a Konelab 20 analyzer (Thermo Fisher Scientific, Vantaa, Finland) following the manufacturer’s instructions. At 5 weeks of age, 10 chicks per treatment were killed by cervical dislocation and the tibia was removed from the muscle. Bone mineral density of the tibia was measured by bone densito- metry (pDEXA, Norland Medical Systems Inc., White Plains, NY, USA).
4. Experiment 2
In experiment 1, chicks were provided three level of ME (3,000, 3,100 and 3,200 kcal/kg) and two level of CP during the 35 days rearing period and identified that the 3,000 kcal/
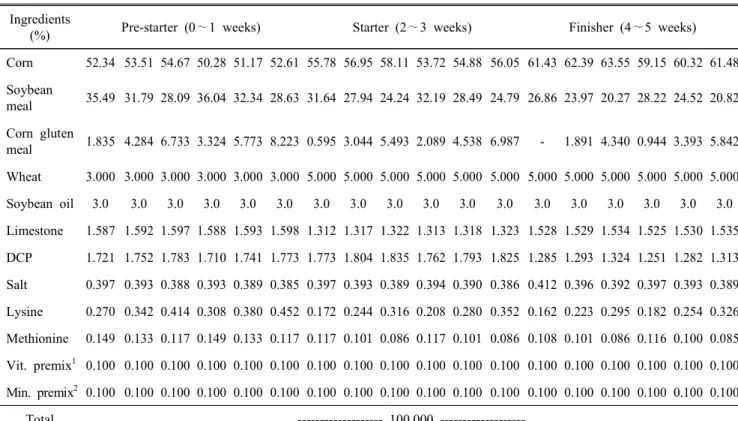
kg did enhance chick’s performance. Therefore, in experiment 2 design was the same protein in diets as the Expt 1 except the ME concentration (pre-starter : 3,000, 3,050 and 3,100 kcal/kg, starter : 3,050, 3,100 and 3,150 kcal/kg, finisher : 3,100, 3,150 and 3,200 kcal/kg) in the diet. All other proce- dures were as described for experiment 1. Blood and bone samples were collected and analyzed using the procedures as described for experiment 1.
5. Statistical Analysis
In both experiments, data were analyzed as 3 × 2 (3 levels
of ME and 2 levels of dietary protein) arrangement of treat-
Table 1. General diet composition of experiment 1 Ingredients
(%) Pre-starter (0∼1 weeks) Starter (2∼3 weeks) Finisher (4∼5 weeks)
Corn 54.18 54.53 54.88 51.93 52.38 52.84 59.89 59.73 59.57 57.84 57.68 57.52 63.71 62.88 62.72 60.98 60.82 60.66 Soybean
meal 36.07 31.80 27.42 37.51 32.76 28.02 29.87 26.27 22.67 30.48 26.87 23.27 24.68 21.08 17.48 25.28 21.68 18.08 Corn gluten
meal - 2.998 6.134 - 4.157 7.547 0.254 2.894 5.535 1.673 4.313 6.954 - 2.315 4.956 1.103 3.744 6.384 Wheat 3.000 3.000 3.000 3.000 3.000 3.000 5.000 5.000 5.000 5.000 5.000 5.000 5.000 5.000 5.000 5.000 5.000 5.000
Wheat bran - - - - - - - - - - - - 3.000 3.000 3.000 3.000 3.000 3.000
Soybean oil 2.500 3.250 4.000 2.500 3.250 4.000 1.000 2.000 3.000 1.000 2.000 3.000 1.000 2.000 3.000 1.000 2.000 3.000 Limestone 1.526 1.538 1.550 1.524 1.537 1.550 1.269 1.277 1.286 1.268 1.277 1.286 1.412 1.421 1.429 1.412 1.421 1.429 DCP 1.696 1.757 1.818 1.700 1.743 1.786 1.784 1.818 1.852 1.773 1.807 1.841 1.263 1.297 1.332 1.252 1.286 1.321 Salt 0.390 0.395 0.390 0.398 0.393 0.387 0.397 0.393 0.389 0.394 0.390 0.386 0.398 0.395 0.391 0.395 0.392 0.388 Lysine 0.263 0.381 0.499 0.291 0.418 0.546 0.208 0.306 0.403 0.251 0.349 0.446 0.210 0.308 0.405 0.248 0.346 0.443 Methionine 0.161 0.142 0.123 0.166 0.145 0.124 0.119 0.103 0.087 0.119 0.103 0.087 0.116 0.100 0.084 0.116 0.100 0.084 Vitamin
premix
10.100 0.100 0.100 0.100 0.100 0.100 0.100 0.100 0.100 0.100 0.100 0.100 0.100 0.100 0.100 0.100 0.100 0.100 Mineral
premix
20.100 0.100 0.100 0.100 0.100 0.100 0.100 0.100 0.100 0.100 0.100 0.100 0.100 0.100 0.100 0.100 0.100 0.100
Total --- 100.000 ---
Chemical composition
ME(kcal/kg) 3,000 3,100 3,200 3,000 3,100 3,200 3,000 3,100 3,200 3,000 3,100 3,200 3,000 3,100 3,200 3,000 3,100 3,200 CP (%) 22.00 22.00 22.00 23.00 23.00 23.00 20.00 20.00 20.00 21.00 21.00 21.00 18.00 18.00 18.00 19.00 19.00 19.00 Calcium 1.100 1.100 1.100 1.100 1.100 1.100 1.000 1.000 1.000 1.000 1.000 1.000 0.950 0.950 0.950 0.950 0.950 0.950 Lysine 1.387 1.387 1.387 1.450 1.450 1.450 1.190 1.190 1.190 1.250 1.250 1.250 1.064 1.064 1.064 1.120 1.120 1.120 Methionine 0.495 0.495 0.495 0.517 0.517 0.517 0.432 0.432 0.432 0.454 0.454 0.454 0.400 0.400 0.400 0.421 0.421 0.421 Sodium 0.180 0.180 0.180 0.180 0.180 0.180 0.180 0.180 0.180 0.180 0.180 0.180 0.180 0.180 0.180 0.180 0.180 0.180 AP 0.450 0.450 0.450 0.450 0.450 0.450 0.450 0.450 0.450 0.450 0.450 0.450 0.350 0.350 0.350 0.350 0.350 0.350
1
Contains per kg: vit. A, 12,000,000 IU; vit D
3, 5,000,000 IU; vit E, 50,000 IU; vit K
3, 3,000 mg; vit B
1, 2,000 mg; vit B
2, 6,000 mg; vit B
6, 4,000mg; vit B
12, 25 mg; Biotin, 200 mg; folica cid, 2,000 mg; niacin, 70,000 mg; pantothenic acid, 20,000 mg.
2
Contains per kg; Cu, 20,000 mg; Co, 500 mg; Fe, 50,000 mg; I, 1,300 mg; Mn, 120,000 mg; Se, 300 mg; Zn, 100,000 mg.
ments by two-way analysis of variance using the GLM proce- dure in SAS (9.1., Cary, NC, 2002). Duncan’s new multiple- range test was performed to identify differences (Steel and Torrie, 1980). A P-value<0.05 was considered significant.
RESULTS AND DISCUSSION
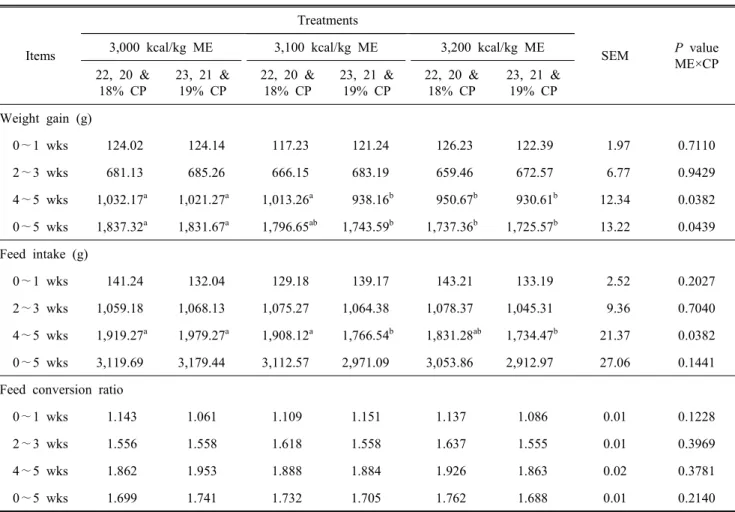
The performance (BW, FI and FCR) of the broilers in
experiment 1 was influenced by the interaction of ME and
CP in the diet (Table 3). During the pre-starter period (0∼7
days), performance were not influenced by the dietary ME
and CP. Extending the grow-out period from 8 to 21 days,
resulted in increased weight gain and feed intake numerically
Table 2. General diet composition of experiment 2 Ingredients
(%) Pre-starter (0∼1 weeks) Starter (2∼3 weeks) Finisher (4∼5 weeks)
Corn 52.34 53.51 54.67 50.28 51.17 52.61 55.78 56.95 58.11 53.72 54.88 56.05 61.43 62.39 63.55 59.15 60.32 61.48 Soybean
meal 35.49 31.79 28.09 36.04 32.34 28.63 31.64 27.94 24.24 32.19 28.49 24.79 26.86 23.97 20.27 28.22 24.52 20.82 Corn gluten
meal 1.835 4.284 6.733 3.324 5.773 8.223 0.595 3.044 5.493 2.089 4.538 6.987 - 1.891 4.340 0.944 3.393 5.842 Wheat 3.000 3.000 3.000 3.000 3.000 3.000 5.000 5.000 5.000 5.000 5.000 5.000 5.000 5.000 5.000 5.000 5.000 5.000 Soybean oil 3.0 3.0 3.0 3.0 3.0 3.0 3.0 3.0 3.0 3.0 3.0 3.0 3.0 3.0 3.0 3.0 3.0 3.0 Limestone 1.587 1.592 1.597 1.588 1.593 1.598 1.312 1.317 1.322 1.313 1.318 1.323 1.528 1.529 1.534 1.525 1.530 1.535 DCP 1.721 1.752 1.783 1.710 1.741 1.773 1.773 1.804 1.835 1.762 1.793 1.825 1.285 1.293 1.324 1.251 1.282 1.313 Salt 0.397 0.393 0.388 0.393 0.389 0.385 0.397 0.393 0.389 0.394 0.390 0.386 0.412 0.396 0.392 0.397 0.393 0.389 Lysine 0.270 0.342 0.414 0.308 0.380 0.452 0.172 0.244 0.316 0.208 0.280 0.352 0.162 0.223 0.295 0.182 0.254 0.326 Methionine 0.149 0.133 0.117 0.149 0.133 0.117 0.117 0.101 0.086 0.117 0.101 0.086 0.108 0.101 0.086 0.116 0.100 0.085 Vit. premix
10.100 0.100 0.100 0.100 0.100 0.100 0.100 0.100 0.100 0.100 0.100 0.100 0.100 0.100 0.100 0.100 0.100 0.100 Min. premix
20.100 0.100 0.100 0.100 0.100 0.100 0.100 0.100 0.100 0.100 0.100 0.100 0.100 0.100 0.100 0.100 0.100 0.100
Total --- 100.000 ---
Chemical composition
ME(kcal/kg) 3,000 3,050 3,100 3,000 3,050 3,100 3,050 3,100 3,150 3,050 3,100 3,150 3,100 3,150 3,200 3,100 3,150 3,200 CP (%) 22.00 22.00 22.00 23.00 23.00 23.00 20.00 20.00 20.00 21.00 21.00 21.00 18.00 18.00 18.00 19.00 19.00 19.00 Calcium 1.100 1.100 1.100 1.100 1.100 1.100 1.000 1.000 1.000 1.000 1.000 1.000 0.950 0.950 0.950 0.950 0.950 0.950 Lysine 1.387 1.387 1.387 1.450 1.450 1.450 1.190 1.190 1.190 1.250 1.250 1.250 1.064 1.064 1.064 1.120 1.120 1.120 Methionine 0.50 0.50 0.50 0.52 0.52 0.52 0.43 0.43 0.43 0.45 0.45 0.45 0.40 0.40 0.40 0.42 0.42 0.42 Sodium 0.18 0.18 0.18 0.18 0.18 0.18 0.18 0.18 0.18 0.18 0.18 0.18 0.18 0.18 0.18 0.18 0.18 0.18 Available
phosphate 0.45 0.45 0.45 0.45 0.45 0.45 0.45 0.45 0.45 0.45 0.45 0.45 0.35 0.35 0.35 0.35 0.35 0.35
1
Contains per kg: vit. A, 12,000,000 IU; vit D
3, 5,000,000 IU; vit E, 50,000 IU; vit K
3, 3,000 mg; vit B
1, 2,000 mg; vit B
2, 6,000 mg; vit B
6, 4,000 mg; vit B
12, 25 mg; Biotin, 200 mg; folic acid, 2,000 mg; niacin, 70,000 mg; pantothenic acid, 20,000 mg.
2
Contains per kg; Cu, 20,000 mg; Co, 500 mg; Fe, 50,000 mg; I, 1,300 mg; Mn, 120,000 mg; Se, 300 mg; Zn, 100,000 mg.
in chicks in 3,000 × 20 and 3,000 × 21 kcal of ME/kg and CP treatments. When the growth period was extended further (22∼35 days), weight gain was increased (p<0.05) to the interaction of ME and CP level (3,000 × 18 and 3,000 × 19) in the diet might be due to increased feed intake and thus enhanced growth performance. Although we did not measure fat deposition in the present trial, but have measured serum
lipid properties (glucose, cholesterol and HDL) and which were increased numerically with the energy content in the diet.
: P>0.05, therefore no meaning. Therefore, dietary interaction of 3,000 kcal ME and 19% CP would enhance growth perfor- mance. In follow up studies, a small increase was observed when dietary energy was increased from 3,050 to 3,150 kcal/
kg on 2∼3 wks and 3,100 to 3,200 on the 4∼5 wks of age
Table 3. Effect of different level of ME and CP on the performance of broiler chicks (Experiment 1)
Items
Treatments
SEM P value
ME×CP 3,000 kcal/kg ME 3,100 kcal/kg ME 3,200 kcal/kg ME
22, 20 &
18% CP
23, 21 &
19% CP
22, 20 &
18% CP
23, 21 &
19% CP
22, 20 &
18% CP
23, 21 &
19% CP Weight gain (g)
0∼1 wks 124.02 124.14 117.23 121.24 126.23 122.39 1.97 0.7110
2∼3 wks 681.13 685.26 666.15 683.19 659.46 672.57 6.77 0.9429
4∼5 wks 1,032.17
a1,021.27
a1,013.26
a938.16
b950.67
b930.61
b12.34 0.0382 0∼5 wks 1,837.32
a1,831.67
a1,796.65
ab1,743.59
b1,737.36
b1,725.57
b13.22 0.0439 Feed intake (g)
0∼1 wks 141.24 132.04 129.18 139.17 143.21 133.19 2.52 0.2027
2∼3 wks 1,059.18 1,068.13 1,075.27 1,064.38 1,078.37 1,045.31 9.36 0.7040
4∼5 wks 1,919.27
a1,979.27
a1,908.12
a1,766.54
b1,831.28
ab1,734.47
b21.37 0.0382
0∼5 wks 3,119.69 3,179.44 3,112.57 2,971.09 3,053.86 2,912.97 27.06 0.1441
Feed conversion ratio
0∼1 wks 1.143 1.061 1.109 1.151 1.137 1.086 0.01 0.1228
2∼3 wks 1.556 1.558 1.618 1.558 1.637 1.555 0.01 0.3969
4∼5 wks 1.862 1.953 1.888 1.884 1.926 1.863 0.02 0.3781
0∼5 wks 1.699 1.741 1.732 1.705 1.762 1.688 0.01 0.2140
SEM, Standard error of mean.
1
First value indicates CP from 1 to 7 days of age; second value indicates CP from 8 to 21 days; third value indicates CP from 22 to 35 days.
a,b
Means within the column followed by different letters are significantly different (P<0.05).
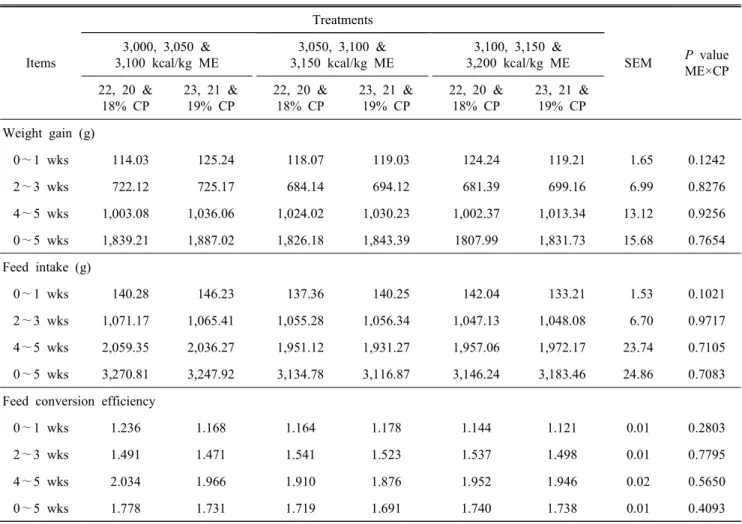
(Table 5). It might be hypothesized that it could be happened due to the small range of ME and CP levels used in the pre- sent study. Between the feeding trials, dietary energy and CP had no significant effect on FCR, but feed intake was increa- sed with decreasing dietary energy and protein dependant ma- nner, indicating that birds can regulate their feed intake based on energy and protein consumption (Sterling et al. 2003 and Nahashon et al, 2005). In consistent, Hidalgo et al. (2004) increased dietary energy from 3,020 to 3,196 kcal/kg and re- ported that there were no significant differences in growth rate, feed consumption and feed conversion. Thereafter, Lesson et al. (1996 a,b) who supplied various levels of dietary energy (2,700, 2,900, 3,100 and 3,300 kcal/kg) which had not signi- ficantly effect on growth rate and recommended that broilers
have good ability to control its feed intake based on energy content in the diet. In another experiment, Sizemore and Sigel, (1993) reported higher growth rate, less feed consumed and improved feed conversion when chicks were fed diets for- mulated to 3,190 kcal of ME/kg compared to 2,712 kcal of ME/kg during the starter period (0 to 21 d), and thus increa- sed body weight. In contrast, Saleh et al. (2004. a,b) used various levels of ME (3,023 to 3,383) and highest growth was achieved under the 3,276 kcal/kg of ME treatment at 21, 42 and 49 days of age (p<0.05). Thus, the variation of broilers performance to the dietary energy and protein might be due to the variation of dietary ME and CP level, feed composition, age and strain of the bird.
Dietary protein and carbohydrate has an important impact
Table 4. Effect of different level of ME and CP on the blood component and bone mineral density of broiler chicks (Experiment 1)
Items
Treatments
SEM P value
ME×CP 3,000 kcal/kg ME 3,100 kcal/kg ME 3,200 kcal/kg ME
22, 20 &
18% CP
23, 21 &
19% CP
22, 20 &
18% CP
22, 20 &
18% CP
23, 21 &
19% CP
22, 20 &
18% CP Blood properties
Alb (g/dL) 1.31 1.18 1.34 1.25 1.27 1.14 0.02 0.8461
TP (g/dL) 2.66 2.46 2.66 2.60 2.64 2.43 0.03 0.5713
Glu (mg/dL) 169.81 157.28 166.14 167.88 173.25 174.23 3.44 0.4828
TG (mg/dL) 41.60 43.80 44.40 43.60 45.80 44.70 1.48 0.7798
CHOL (mg/dL) 121.80 116.00 131.90 129.90 137.50 126.60 2.63 0.7796
HDL (mg/dL) 92.90 90.50 94.30 99.30 105.20 91.50 2.16 0.2104
AST (U/L) 219.60 235.70 217.60 232.10 211.20 197.60 8.78 0.2846
ALT (U/L) 1.57 1.58 1.29 1.72 1.45 1.57 0.23 0.43
Tibia bone mineral density
BMD (mg/cm
2) 165.73 168.02 166.03 161.61 170.63 180.61 0.01 0.3858
SEM, Standard error of mean.
1
First value indicates CP from 1 to 7 days of age; second value indicates CP from 8 to 21 days; third value indicates CP from 22 to 35 days.
a,b
Means within the column followed by different letters are significantly different (P<0.05).
ALB : albumin; TP : total protein; Glu : glucose; TG : triacylglyceride; CHOL : cholesterol; HDL : high density lipo- protein; AST : aspartate aminotransferase; ALT : alanine aminotransferase; BMD : bone mineral density.
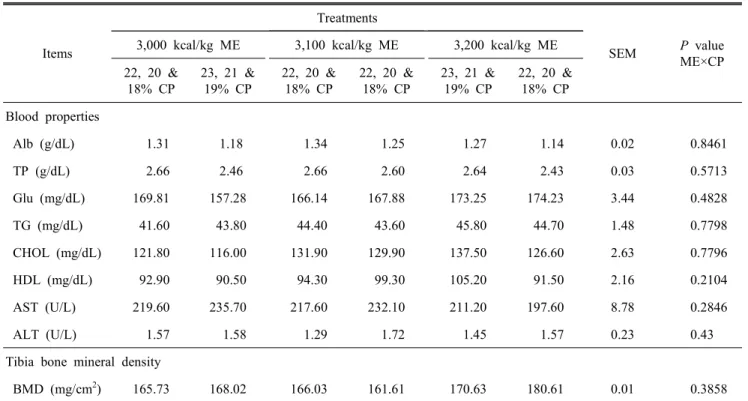
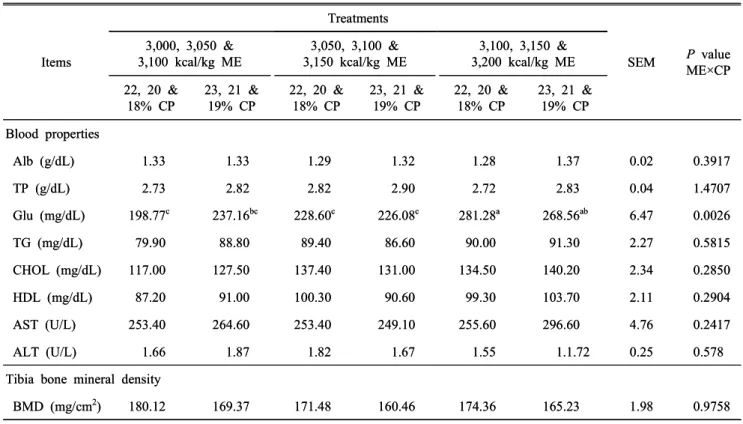
on bone health (Son Sook Mee, Ye Na Chun 2004). There was no interaction between ME × CP on bone mineral density (BMD) of broiler chicks in this study. When dietary energy level increased from ME 3,000 to 3,200 kcal/kg and 1% CP level, BMD was increased numerically but the effect was non-significant (Table 4). However a further modification of dietary energy level in different growth stage (Table 6) had no additional effect on bone characteristics. So, it can be assumed that modification of energy and protein content of the diet without altering the Ca:P ratio had no effect on bone mineral density of the broilers chicks (Kwon et al, 2009).
Therefore, the present results suggested that dietary modifica- tion of ME within the range of 3,000 to 3,200 kcal/kg and decreasing 1% CP did not adversely affect on the bone mineral density of broiler chicks. In another experiment, Kermanshahi et al. (2011) mentioned that increased CP content in the diet significantly decreased Ca and N retention and thus decreased
bone mineral content of broiler chicks.
In both experiments, as expected, serum albumin levels was
increased numerically as dietary CP level was increased (Table
4 and Table 6). There was no interaction between dietary
energy and protein on blood characteristics, but dietary energy
increased from 3,100 to 3,200 kcal/kg in the diet had increa-
sed serum glucose level from 237.16 to 281.28 mg/dL (Table
6). So it can be assumed that increased dietary ME and CP
increases serum glucose level via two processes (1) an enhan-
cement of de novo lipogenesis (Rosebrough and Steele. 1985,
Swennen et al., 2005) and (2) a decreased whole body fat
oxidation consecutive to the rise in carbohydrate oxidation
(Shah and Garg, 1996). Therefore, serum triglycerides, total
cholesterol and HDL contents were tended to increase with
the energy increments in the diet. In another experiment,
Swennen et al. (2005) mentioned that plasma triglycerides
level was increased due to energy and protein ratio in the
Table 5. Effect of different level of ME and CP on the performance of broiler chicks (Experiment 2)
Items
Treatments
SEM P value ME×CP 3,000, 3,050 &
3,100 kcal/kg ME
3,050, 3,100 &
3,150 kcal/kg ME
3,100, 3,150 &
3,200 kcal/kg ME 22, 20 &
18% CP
23, 21 &
19% CP
22, 20 &
18% CP
23, 21 &
19% CP
22, 20 &
18% CP
23, 21 &
19% CP Weight gain (g)
0∼1 wks 114.03 125.24 118.07 119.03 124.24 119.21 1.65 0.1242
2∼3 wks 722.12 725.17 684.14 694.12 681.39 699.16 6.99 0.8276
4∼5 wks 1,003.08 1,036.06 1,024.02 1,030.23 1,002.37 1,013.34 13.12 0.9256
0∼5 wks 1,839.21 1,887.02 1,826.18 1,843.39 1807.99 1,831.73 15.68 0.7654
Feed intake (g)
0∼1 wks 140.28 146.23 137.36 140.25 142.04 133.21 1.53 0.1021
2∼3 wks 1,071.17 1,065.41 1,055.28 1,056.34 1,047.13 1,048.08 6.70 0.9717
4∼5 wks 2,059.35 2,036.27 1,951.12 1,931.27 1,957.06 1,972.17 23.74 0.7105
0∼5 wks 3,270.81 3,247.92 3,134.78 3,116.87 3,146.24 3,183.46 24.86 0.7083
Feed conversion efficiency
0∼1 wks 1.236 1.168 1.164 1.178 1.144 1.121 0.01 0.2803
2∼3 wks 1.491 1.471 1.541 1.523 1.537 1.498 0.01 0.7795
4∼5 wks 2.034 1.966 1.910 1.876 1.952 1.946 0.02 0.5650
0∼5 wks 1.778 1.731 1.719 1.691 1.740 1.738 0.01 0.4093
SEM, Standard error of mean.
1
First value indicates ME and CP from 1 to 7 days of age; second value indicates ME and CP from 8 to 21 days; third value indicates ME and CP from 22 to 35 days.
a,b
Means within the column followed by different letters are significantly different (P<0.05).
diet. Liver function was assessed at the end of both experi- ments by determining serum AST and ALT levels (Tables 4 and Table 6). In both experiments, serum AST and ALT were not influenced by the interaction of ME and CP in the diet, but birds under the 3,200 kcal/kg ME and 19% CP die- tary treatments tended to show lower activities and which indicated healthy flock. On the other hand, higher level of AST was found in Experiment 2 may be due to a particular experimental environment over time.
SUMMARY
본 실험은 육계의 서로 다른 농도의 에너지와 단백질이 생산성과 혈액성상 및 BMD에 미치는 영향을 구명하기 위
하여 두 차례 실시하였다. 실험 1에서 총 480수의 Ross ×
Ross 병아리를 무작위로 6처리구(5반복; 16수/펜)로 나누어
배치하였다. 처리구는 사료 내 ME는 3,000, 3,100, 3,200
kcal/kg 수준으로 하였고 CP는 초기 22, 23%, 전기 20, 21%,
후기 18, 19% 수준으로 하였다. 실험 2에서는 실험 1과 유
사하게 병아리와 CP를 적용하였으며, 사료 내 ME 수준을
변형하였다(초기 : 3,000, 3,050, 3,100 kcal/kg, 전기 : 3,050,
3,100, 3,150 kcal/kg, 후기 : 3,100, 3,150, 3,200 kcal/kg). 두
실험에서 처리구당 10수씩 혈액과 경골 샘플을 채취하였고,
혈액성상과 BMD를 분석하였다. 실험 1에서 증체량과 사료
섭취량은 3,000 kcal/kg의 에너지를 급여한 처리구에서 증가
되었다(P<0.05). 혈청 총 단백질과 albumin 농도는 CP의 수
준이 증가함에 따라 수치적으로 증가하였다. 총 콜레스테롤
과 HDL의 함유량은 에너지 함유량의 증가에 따라 수치적으
Table 6. Effect of different level of ME and CP on the blood component and bone mineral density of broiler chicks (Experiment 2)
Items
Treatments
SEM P value ME×CP 3,000, 3,050 &
3,100 kcal/kg ME
3,050, 3,100 &
3,150 kcal/kg ME
3,100, 3,150 &
3,200 kcal/kg ME 22, 20 &
18% CP
23, 21 &
19% CP
22, 20 &
18% CP
23, 21 &
19% CP
22, 20 &
18% CP
23, 21 &
19% CP Blood properties
Alb (g/dL) 1.33 1.33 1.29 1.32 1.28 1.37 0.02 0.3917
TP (g/dL) 2.73 2.82 2.82 2.90 2.72 2.83 0.04 1.4707
Glu (mg/dL) 198.77
c237.16
bc228.60
c226.08
c281.28
a268.56
ab6.47 0.0026
TG (mg/dL) 79.90 88.80 89.40 86.60 90.00 91.30 2.27 0.5815
CHOL (mg/dL) 117.00 127.50 137.40 131.00 134.50 140.20 2.34 0.2850
HDL (mg/dL) 87.20 91.00 100.30 90.60 99.30 103.70 2.11 0.2904
AST (U/L) 253.40 264.60 253.40 249.10 255.60 296.60 4.76 0.2417
ALT (U/L) 1.66 1.87 1.82 1.67 1.55 1.1.72 0.25 0.578
Tibia bone mineral density
BMD (mg/cm
2) 180.12 169.37 171.48 160.46 174.36 165.23 1.98 0.9758
SEM, Standard error of mean.
a∼c