Effects of body composition, leptin
and adiponectin on bone mineral
density in prepubertal girls
Young Jun Rhie
Department of Medicine
Effects of body composition, leptin
and adiponectin on bone mineral
density in prepubertal girls
Directed by Professor Duk Hee Kim
The Master's Thesis
submitted to the Department of Medicine,
the Graduate School of Yonsei University
in partial fulfillment of the requirements for the
degree of Master of Medical Science
Young Jun Rhie
This certifies that the Master's Thesis
of Young Jun Rhie is approved.
---
Thesis Supervisor: Duk Hee Kim
---
Thesis Committee Member: Bong Soo Cha
---
Thesis Committee Member: Bae Hwan Lee
The Graduate School
Yonsei University
ACKNOWLEDGEMENTS
This thesis would never have been completed without the
help and encouragement of my academic advisers, as well as
my family members.
First and foremost, I would like to give my thanks to God
who always strengthens and encourages me.
I am most grateful to Professor Duk Hee Kim, who gave me
the opportunity to participate in such a great project and
supervised my work. In addition, I am in debt to Professors
Bong Soo Cha and Bae Hwan Lee who gave me many great
advices during the study. Furthermore, I am grateful to
Professors Ho Seong Kim, Kee Hyoung Lee and So Chung
Chung who were helpful with meaningful discussion.
I would never forget my parents-in-law’s all sort of tangible
and intangible support.
Finally, I especially wish to express my greatest love and
gratitude to my wife, Ji Hyun and two lovely kids, Ha Ram
and Ha Eun for their love and patience.
<TABLE OF CONTENTS>
ABSTRACT ···1
I. INTRODUCTION ···3
II. MATERIALS AND METHODS ···5
1.
Subjects···5
2.
Anthropometric measurement ···5
3.
Bone age assessment ···5
4.
Body composition assessment ···6
5.
Bone mineral density assessment ···6
6.
Biochemical assessment ···6
7.
Statistical analysis ···7
III. RESULTS ···8
1.
Anthropometric and endocrine characteristics ···8
2.
Serum glucose, insulin, leptin, adiponectin levels,
body composition and bone mineral density ···10
3.
Relationship of serum leptin, adiponectin levels, HOMA-IR
and body composition with bone mineral density ···12
4.
Serum leptin, adiponectin levels, HOMA-IR
and body composition as independent predictors
of bone mineral density ···14
IV. DISCUSSION ···16
V. CONCLUSION ···19
REFERENCES ···20
LIST OF TABLES
Table 1.
Anthropometric and endocrine characteristics
of obese and control groups
···
9
Table 2.
Metabolic parameters, body composition
and bone mineral density results of obese
and control groups
···
11
Table 3.
Correlation of metabolic parameters
and body composition
with bone mineral density
···
13
Table 4.
Serum leptin, adiponectin levels, HOMA-IR
and body composition as independent predictors
of bone mineral density
···
15
<ABSTRACT>
Effects of body composition, leptin and adiponectin on bone
mineral density in prepubertal girls
Young Jun Rhie
Department of Medicine
The Graduate School, Yonsei University
(Directed by Professor Duk Hee Kim)
The relationship between obesity and bone mineral density is not
clear. Body weight is positively associated with bone mineral density.
It has been a controversy whether lean mass or fat mass has more
influence on bone stimulatory effect. Some adipokines seem to
participate in bone metabolism. Leptin and adiponectin are potential
independent contributors to bone mineral density. The aim of this study
was to assess the relation among body composition, adipokines (leptin
and adiponectin) and bone mineral density, and whether adipokines and
body composition determine bone mineral density independently in
prepubertal girls. Subjects included forty eight prepubertal girls. They
were classified as obese and control groups according to their body
mass index. Serum leptin and adiponectin levels were determined by
enzyme immunoassay. Bone mineral density by dual energy X-ray
absorptiometry and body composition by bioelectrical impedance
analysis were measured. Lean mass was positively correlated with bone
mineral density. Fat mass was negatively correlated with L-spine bone
mineral density after adjustment for body weight. Serum leptin levels
were positively correlated with bone mineral density. Lean mass was a
positive independent predictor of bone mineral density. Serum leptin
was a positive independent predictor of femoral bone mineral density.
Fat mass was found to be a negative independent predictor of femoral
bone mineral density. Lean mass has favorable effect on bone mineral
density. Fat mass seems not to be beneficial to the bone structure
against osteoporosis, despite increased mechanical loading. Leptin may
have a certain biological role in regulating bone metabolism.
---
Key words: bone mineral density, body composition, leptin,
Effects of body composition, leptin and adiponectin on bone
mineral density in prepubertal girls
Young Jun Rhie
Department of Medicine
The Graduate School, Yonsei University
(Directed by Professor Duk Hee Kim)
I. INTRODUCTION
Rapidly increasing childhood obesity has become a major public health concern. Obesity is a main risk factor for cardiovascular disease, diabetes,
hypertension and cancer1-3. However, the relationship between obesity and
bone mineral density (BMD) is unclear4.
Childhood and adolescence are the most important period for maximum bone mass acquisition, associated with genetic potential, nutritional factors,
physical activity and body composition5. Osteoporosis-related fracture risk is
highly dependent on BMD6, 7. Body weight is positively associated with
BMD8-10 and negatively associated with fracture incidence7, 11. However, it remains a controversy whether it is lean mass or adipose tissue that mediates the bone stimulatory effect exerted by weight12-14. Recent reports indicated that in young female populations, lean mass is a positive predictor15, 16, whereas adipose tissue is a weaker positive17, or a negative predictor of BMD16, 18, 19. Adipose tissue, once considered a metabolically passive fuel
depot for energy substrate, has recently become as a metabolically active tissue. It secretes a variety of proteins called adipokines into circulation, which play important roles in the modulation of biological functions. The relation between adipose tissue and BMD is credited not only to stress from mechanical loading but also to the metabolic effect of adipokines20. Leptin and adiponectin are potential contributors to BMD. Leptin is a satiety regulating hormone and have a central role not only regulating in energy expenditure, but also in bone metabolism4. Leptin increases the proliferation and differentiation of osteoblast in adults21. Adiponectin increases insulin sensitivity and may improve the lipid profiles22, 23. Serum adiponectin levels
are negatively correlated with parameters of overall obesity24. It was
suggested that high adiponectin levels may cause increased osteoclastic activity and low BMD25. Adiponectin, however, is also reported to increase osteoblastic activity and decrease osteoclastic activity in animals26.
The relation between body composition, especially adipose tissue, and BMD in obese children is clinically important because any therapeutic interventions for obesity that modifies body composition may affect BMD and the risk of osteoporosis in later life. Few have attempted to investigate the effect of body composition and adipokines on BMD in children. Accordingly, I investigated the relation among body composition, leptin and adiponectin, and BMD, and whether adipokines and body composition determine BMD independently in prepubertal girls.
II. MATERIALS AND METHODS
1. Subjects
The Institutional Review Board at Korea University Ansan Hospital approved the study. Written informed consents were obtained from both subjects and parents. Forty eight children who visited department of pediatrics, Korea University Ansan Hospital due to obesity or non-endocrine disease participated in the study. All of the subjects were female and prepubertal. Pubertal stage was determined by a single pediatric endocrinologist according
to the criteria of Tanner27. Children who showed pubertal development were
excluded from the study. None of the subjects in this study had a medical history of cardiovascular disease, diabetes, hypertension and other endocrine disorders.
2. Anthropometric measurement
Height was measured to the nearest 0.1 cm using a rigid stadiometer. Weight was measured to the nearest 0.1 kg using a calibrated balance scale. Body mass index (BMI) was calculated as the weight in kilograms divided by the square of height in meters. Among the forty eight subjects, twenty three
(BMI ≥ 95th percentile for age and sex, according to 2007 Korean national
growth chart) were classified into obese group and twenty five (25th
percentile ≤ BMI < 75th percentile, according to 2007 Korean national
growth chart) into control group.
3. Bone age assessment
A standard left-hand wrist radiograph was obtained and bone age was
determined by a single observer according to Greulich and Pyle method28,
4. Body composition assessment
Body composition measurement was performed by bioelectrical impedance analysis, using InBody 4.0 (Biospace, Seoul, Korea). Fat and lean mass were expressed in kilograms.
5. Bone mineral density assessment
BMD was measured by a single technician by way of dual energy X-ray absorptiometry (DXA), using Expert version 1.90 (Lunar Corp., Madison, WI, USA). BMD of L2-L4 lumbar spine and femoral neck was evaluated,
expressed in gram/centimeter2.
6. Biochemical assessment
Blood sampling was performed in the overnight fasting state. Serum insulin like growth factor-1 (IGF-1), insulin like growth factor binding protein-3 (IGFBP-3), luteinizing hormone (LH), follicle stimulating hormone (FSH), estradiol, thyroid stimulating hormone (TSH), fT4, adrenocorticotropic hormone (ACTH), cortisol, parathyroid hormone (PTH), osteocalcin, insulin, glucose, total cholesterol, triglyceride, LDL-cholesterol, HDL-cholesterol, leptin and adiponectin were measured. Leptin levels were measured with enzyme immunoassay kit (ALPCO Diagnostics, Salem, NH, USA). Adiponectin levels were measured by enzyme immunoassay kit (AdipoGen, Inc., Seoul, Korea). Insulin resistance was estimated as homeostatic model assessment of insulin resistance (HOMA-IR), with the calculations as follows: HOMA-IR = [insulin (mU/l) x glucose (mmol/l)] / 22.5.
7. Statistical analysis
Data are expressed as mean ± SD. Anthropometric and endocrine
characteristics were compared between obese and control groups using an independent t-test. Serum glucose, insulin, HOMA-IR, leptin, adiponectin levels, body composition and bone mineral density were compared between obese and control groups using an independent t-test. The relationship between BMD and other metabolic variables was determined by Pearson’s correlation analysis and Partial correlation analysis. Multiple linear regression analysis was performed to investigate whether leptin, adiponectin, HOMA-IR and body composition determine BMD independently. The SPSS 12.0 software was used for statistical analysis. P values < 0.05 were considered statistically significant.
III. RESULTS
1. Anthropometric and endocrine characteristics
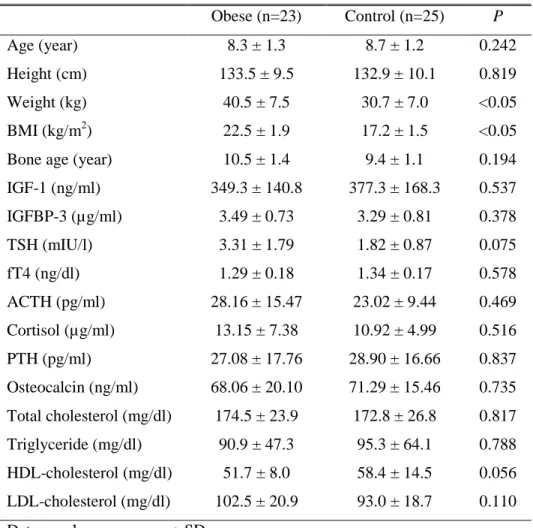
Anthropometric and endocrine characteristics of obese and control groups are shown in Table 1. LH, FSH and estradiol levels of all the subjects were less than 0.07 IU/l, 1.00 IU/l and 10.0 pg/ml, respectively. Obese group had significantly higher weight and BMI compared with control group. There was no significant difference in age, height, bone age, IGF-1, IGFBP-3, TSH, fT4, ACTH, cortisol, PTH, osteocalcin levels and lipid profiles between the two groups.
Table 1. Anthropometric and endocrine characteristics of obese and control groups Obese (n=23) Control (n=25) P Age (year) 8.3 ± 1.3 8.7 ± 1.2 0.242 Height (cm) 133.5 ± 9.5 132.9 ± 10.1 0.819 Weight (kg) 40.5 ± 7.5 30.7 ± 7.0 <0.05 BMI (kg/m2) 22.5 ± 1.9 17.2 ± 1.5 <0.05
Bone age (year) 10.5 ± 1.4 9.4 ± 1.1 0.194
IGF-1 (ng/ml) 349.3 ± 140.8 377.3 ± 168.3 0.537 IGFBP-3 (µg/ml) 3.49 ± 0.73 3.29 ± 0.81 0.378 TSH (mIU/l) 3.31 ± 1.79 1.82 ± 0.87 0.075 fT4 (ng/dl) 1.29 ± 0.18 1.34 ± 0.17 0.578 ACTH (pg/ml) 28.16 ± 15.47 23.02 ± 9.44 0.469 Cortisol (µg/ml) 13.15 ± 7.38 10.92 ± 4.99 0.516 PTH (pg/ml) 27.08 ± 17.76 28.90 ± 16.66 0.837 Osteocalcin (ng/ml) 68.06 ± 20.10 71.29 ± 15.46 0.735 Total cholesterol (mg/dl) 174.5 ± 23.9 172.8 ± 26.8 0.817 Triglyceride (mg/dl) 90.9 ± 47.3 95.3 ± 64.1 0.788 HDL-cholesterol (mg/dl) 51.7 ± 8.0 58.4 ± 14.5 0.056 LDL-cholesterol (mg/dl) 102.5 ± 20.9 93.0 ± 18.7 0.110
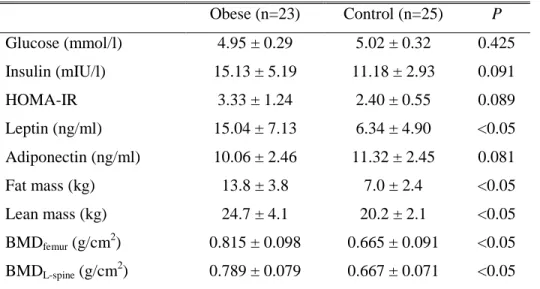
2. Serum glucose, insulin, leptin, adiponectin levels, body composition and bone mineral density
Serum glucose, insulin, leptin, adiponectin levels, body composition and bone mineral density of obese and control groups are shown in Table 2. Obese group had significantly higher serum leptin levels, fat mass, lean mass, femoral and L-spine BMD compared with control group. There was no significant difference in serum glucose, insulin, HOMA-IR and serum adiponectin levels between the two groups.
Table 2. Metabolic parameters, body composition and bone mineral density of obese and control groups
Obese (n=23) Control (n=25) P Glucose (mmol/l) 4.95 ± 0.29 5.02 ± 0.32 0.425 Insulin (mIU/l) 15.13 ± 5.19 11.18 ± 2.93 0.091 HOMA-IR 3.33 ± 1.24 2.40 ± 0.55 0.089 Leptin (ng/ml) 15.04 ± 7.13 6.34 ± 4.90 <0.05 Adiponectin (ng/ml) 10.06 ± 2.46 11.32 ± 2.45 0.081 Fat mass (kg) 13.8 ± 3.8 7.0 ± 2.4 <0.05 Lean mass (kg) 24.7 ± 4.1 20.2 ± 2.1 <0.05 BMDfemur (g/cm 2 ) 0.815 ± 0.098 0.665 ± 0.091 <0.05 BMDL-spine (g/cm 2 ) 0.789 ± 0.079 0.667 ± 0.071 <0.05
Data are shown as mean ± SD.
HOMA-IR: homeostatic model assessment of insulin resistance, BMDfemur:
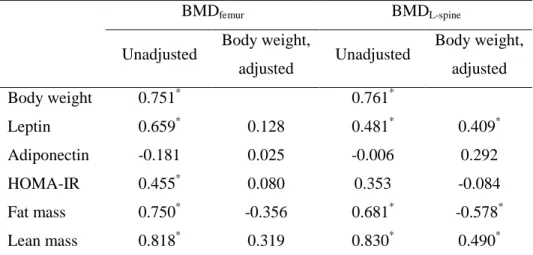
3. Relationship of serum leptin, adiponectin levels, HOMA-IR and body composition with bone mineral density
The results of Pearson’s correlation and Partial correlation after adjustment for body weight of serum leptin, adiponectin levels, HOMA-IR and body composition with bone mineral density are shown in Table 3. Body weight was positively correlated with femoral and L-spine BMD. Serum leptin, HOMA-IR, fat and lean mass had significant positive correlations with femoral BMD, and they disappeared after adjustment for body weight. Serum adiponectin was not correlated with femoral BMD. Serum leptin and lean mass had significant positive correlations with L-spine BMD, and still remained significant after adjustment for body weight. There was significant positive correlation between fat mass and L-spine BMD, but it became negative after adjustment for body weight. HOMA-IR and serum adiponectin level were not correlated with L-spine BMD.
Table 3. Correlation of metabolic parameters and body composition with bone mineral density
BMDfemur BMDL-spine
Unadjusted Body weight,
adjusted Unadjusted Body weight, adjusted Body weight 0.751* 0.761* Leptin 0.659* 0.128 0.481* 0.409* Adiponectin -0.181 0.025 -0.006 0.292 HOMA-IR 0.455* 0.080 0.353 -0.084 Fat mass 0.750* -0.356 0.681* -0.578* Lean mass 0.818* 0.319 0.830* 0.490*
Pearson’s correlation coefficients and Partial correlation coefficients after adjustment for body weight are presented.
BMDfemur: femoral bone mineral density, BMDL-spine: L-spine bone mineral
density, HOMA-IR: homeostatic model assessment of insulin resistance.
*
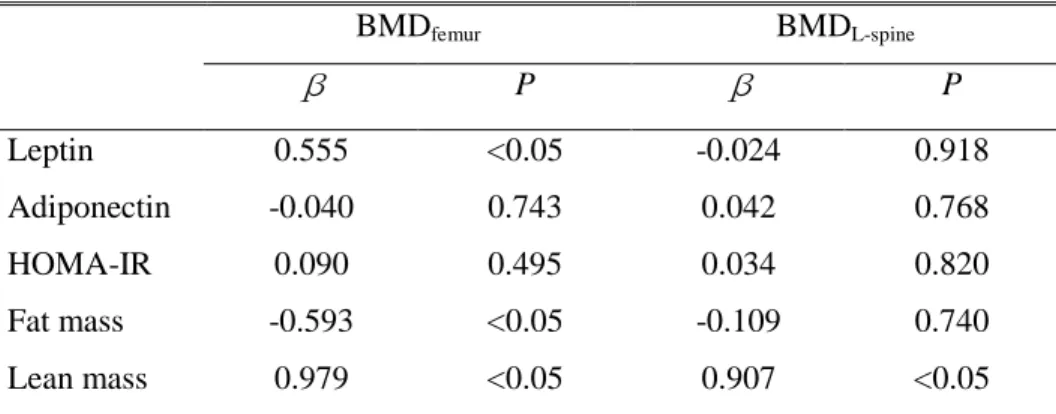
4. Serum leptin, adiponectin levels, HOMA-IR and body composition as independent predictors of bone mineral density
The results of multiple linear regression analysis to investigate whether leptin, adiponectin and body composition determine BMD independently are shown in Table 4. Lean mass was found to be a positive independent predictor of femoral and L-spine BMD. Serum leptin was found to be a positive independent predictor of femoral BMD but not of L-spine BMD. Fat mass was found to be a negative independent predictor of femoral BMD but not of L-spine BMD. Serum adiponectin and HOMA-IR were not independent predictors of BMD.
Table 4. Serum leptin, adiponectin levels, HOMA-IR and body composition as independent predictors of bone mineral density
BMDfemur BMDL-spine β P β P Leptin 0.555 <0.05 -0.024 0.918 Adiponectin -0.040 0.743 0.042 0.768 HOMA-IR 0.090 0.495 0.034 0.820 Fat mass -0.593 <0.05 -0.109 0.740 Lean mass 0.979 <0.05 0.907 <0.05
Results of multiple linear regression analyses including serum leptin, adiponectin , HOMA-IR, fat and lean mass on bone mineral density.
Standardized β and P values are presented.
BMDfemur:femoral bone mineral density, BMDL-spine:L-spine bone mineral
IV. DISCUSSION
In this study, I was able to demonstrate higher BMD in obese than control group children. This finding supports a positive relationship between body weight and BMD in the previous studies8-10. BMD of obese subject can be influenced by increased body weight. The bone structure can easily adapt to stimuli. Excessive weight produces a mechanical force on the bones, stimulating osteogenesis29.
Obesity is characterized by increased body weight with excess body fat and a relative increase of lean mass. It has been a controversy whether lean mass
or fat mass has more influence on bone stimulatory effect12-14. Previous
studies indicated that regardless of age or gender, lean mass has a strong
positive influence on BMD17, 30, 31. However, the results of previous studies on
the relation between fat mass and BMD were conflicting. Adipose tissue is a weaker positive predictor17 or even stronger predictor10, 14 than lean mass, or
even a negative predictor of BMD18, 19.
This study indicates that lean mass is positively correlated with BMD and a positive independent predictor of BMD, whereas fat mass is negatively correlated with L-spine BMD after adjustment for body weight. This finding is consistent with previous reports suggesting that bone strengths is primarily determined by dynamic loads from muscle force, not static loads, such as fat mass31. I also found that fat mass was a negative independent predictor of femoral BMD after multiple linear regression analysis. It seems that the contribution of fat mass offset its potential benefit as a mechanical load. The basis for negative effect of fat mass on the bone mass observed in this study is unknown.
Adipose tissue is not a metabolically passive fuel depot for energy substrate anymore. It has become a metabolically active tissue, secreting a variety of adipokines that modulate biological functions. It is suggested that some
adipokines participate in bone metabolism. Leptin and adiponectin are potential contributors to BMD.
Leptin has been proposed to be a mediator of adipose tissue hormonal effect on bone mass4. The role of leptin in bone metabolism is not fully understood, but animal studies showed the ‘high bone mass phenotype’ in the
leptin deficient mice32. In humans, some studies4, 33, 34 have failed to show any
association between serum leptin levels and BMD in women or in men, whereas others have reported a positive association between leptin and BMD35. In a few recent studies36, 37, leptin was negatively correlated with BMD. In this study, I showed that serum leptin levels were positively correlated with both femoral and L-spine BMD, and leptin was an independent positive predictor of femoral BMD.
Adiponectin acts directly on bone to induce human osteoblast proliferation and differentiation, and to increase osteoclast formation indirectly25, 38.
Another previous study39 showed that adiponectin exerted a negative
independent effect on BMD. Some studies also reported that there were no
independent relationship between adiponectin and BMD40, 41. I was not able to
show any correlation between adiponectin and BMD.
Another link between obesity and BMD is insulin. Insulin reduces the hepatic synthesis of sex hormone carriers. Thus, there is an increase in free
form sex hormones, which stimulates the activity of osteoblasts42. I found that
HOMA-IR had a weak positive correlation with femoral BMD, but no significant correlation with L-spine BMD.
This study was limited to prepubertal girls to control other factors that affect BMD. In puberty, growth hormone and sex steroid actively participate
in the bone structure development as a result of normal growth5. Sex seems to
be an important determinant of BMD, probably because of different muscle and sex steroid level in boys and girls43.
the results, especially with regard to cause-effect interactions. Another limit of this study is the fact that we did not include male and pubertal subject and I did not control the life style of subjects such as calcium diet and exercise.
In conclusion, in prepubertal girls, lean mass has favorable effect on BMD. Lean mass is a positive independent predictors of femoral and L-spine BMD. Fat mass is a negative independent predictor of femoral BMD. Fat mass seems not to be beneficial to the bone structure against osteoporosis, despite increased mechanical loading. Leptin can predict femoral BMD independently. Leptin may have a certain biological role in regulating bone metabolism. Further prospective study including male and pubertal subjects is necessary to apply our findings to general populations.
V. CONCLUSION
I assessed the effects of body composition, leptin and adiponectin on bone mineral density in prepubertal girls. Lean mass is more favorable to the bone mass than fat mass against osteoporosis. Leptin may have a certain biological role in regulating bone metabolism.
REFERENCES
1. Freedman DS, Khan LK, Dietz WH, Srinivasan SR, Berenson GS.
Relationship of childhood obesity to coronary heart disease risk factors in adulthood: the Bogalusa Heart Study. Pediatrics 2001;108:712-8.
2. Gascon F, Valle M, Martos R, Zafra M, Morales R, Castano MA.
Childhood obesity and hormonal abnormalities associated with cancer risk. Eur J cancer Prev 2004;13:193-7.
3. Weiss R, Dziura J, Burgert TS, Tamborlane WV, Taksali SE, Yeckel CW,
et al. Obesity and the metabolic syndrome in children and adolescents. N Engl J Med 2004;350:2362-74.
4. Thomas T, Burguera B. Is leptin the link between fat and bone mass? J
Bone Miner Res 2002;17:1563-9.
5. Bouillon R, Prodonova A. Growth and hormone deficiency and peak
bone mass. J Pediatr Endocrinol Metab 2000;13:1327-36.
6. Albrand G, Munoz F, Sornay-Rendu E, DuBoeuf F, Delmas PD.
Independent predictors of all osteoporosis-related fractures in healthy postmenopausal women: The OFELY study. Bone 2003;32:78-85.
7. Cummings SR, Nevitt MC, Browner WS, Stone K, Fox KM, Ensrud K et
al. Risk factors for hip fracture in white women. Study of Osteoporotic Fracture Research Group. N Engl J Med 1995;332:767-73.
body mass index on bone mineral density in men and women: The Framingham study. J Bone Miner Res 1993;8:567-73.
9. Marcus R, Greendale G, Blunt BA, Bush TL, Sherman S, Sherwin R, et
al. Correlates of bone mineral density in the postmenopausal estrogen/progestin interventions trial. J Bone Miner Res 1994;9:1467-76.
10. Reid IR. Relationship among body mass, its components, and bone. Bone
2002;31:811-22.
11. Espallargues M, Sampietro-Colom L, Estrada MD, Solà M, del Rio L,
Setoain J, et al. Identifying bone-mass-related risk factors for fracture to guide bone densitometry measurements: a systematic review of the literature. Osteoporos Int 2001;12:811-22.
12. Glauber HS, Vollmer WM, Nevitt MC, Ensrud KE, Orwoll ES. Body
weight versus body fat distribution, adiposity, and frame size as predictors of bone density. J Clin Endocrinol Metab 1995;80:1118-23.
13. Van Langendonck L, Claessens AL, Lefevre J, Thomis M, Philippaerts R,
Delvaux K, et al. Association between bone mineral density (DXA), body structure, and body composition in middle-aged men. Am J Hum Biol 2002 ;14:735-42.
14. Khosla S, Atkinson EJ, Riggs BL, Melton 3rd LJ. Relationship between
body composition and bone mass in women. J Bone Miner Res 1996;11:857-63.
al. Difference in the effect of adiposity on bone density between pre- and postmenopausal women. Maturitas 2000;34:261-6.
16. Young D, Hopper JL, Macinnis RJ, Nowson CA, Hoang NH, Wark JD.
Changes in body composition as determinants of longitudinal changes in bone mineral measures in 8 to 26-year-old female twins. Osteoporos Int 2001;12:506-15.
17. Wang MC, Bachrach LK, Van Loan M, Hudes M, Flegal KM, Crawford
PB. The relative contributions of lean tissue mass and fat mass to bone density in young women. Bone 2005;37:474-81.
18. Janicka A, Wren TA, Sanchez MM, Dorey F, Kim PS, Mittelman SD, et
al. Fat mass is not beneficial to bone in adolescents and young adults. J Clin Endocrinol Metab 2007;92:143-7.
19. Lazcano-Ponce E, Tamayo J, Cruz-Valdez A, Diaz R, Hernandez B, Del
Cueto R, et al. Peak bone mineral area density and determinants among females aged 9 to 24 years in Mexico. Osteoporos Int 2003;14:539-47.
20. Klein KO, Lamore KA, de Lancy E, Brown JM, Considine RV, Hassink
SG. Effect of obesity on estradiol level, and its relationship to leptin, bone maturation, and bone mineral density in children. J Clin Endocrinol Metab 1998;83:3469-75.
21. Yamaguchi M, Sugimoto T, Yamaguchi T, Nakaoka D, Kanzawa M,
Yano S, et al. Plasma leptin concentrations are associated with bone mineral density and the presence of vertebral fractures in postmenauposal women. Clin Endocrinol 2001;55:341-7.
22. Esposito K, Pontillo A, Di Palo C, Giugliano G, Masella M, Marfella R, et al. Effect of weight loss and lifestyle changes on vascular inflammatory markers in obese women: a randomized trial. JAMA 2003;289:1799-804.
23. Yamauchi T, Kamon J, Waki H, Terauchi Y, Kubota N, Hara K, et al.
The fat-derived hormone adiponectin reverses insulin resistance associated with both lipoatrophy and obesity. Nat Med 2001;7:941-6.
24. Weyer C, Funahashi T, Tanaka S, Hotta K, Matsuzawa Y, Pratley RE, et
al. Hypoadiponectinemia in obesity and type 2 diabetes: close association with insulin resistance and hyperinsulinemia. J Clin Endocrinol Metab 2001;86:1930-5.
25. Luo XH, Guo LJ, Xie H, Yuan LQ, Wu XP, Zhou HD, et al. Adiponectin
stimulate RANKL and inhibit OPG expression in human osteoblast through the MAPK signaling pathway. J Bone Miner Res 2006;21:1648-56.
26. Oshima K, Nampei A, Matsuda M, Iwaki M, Fukuhara A, Hashimoto J,
et al. Adiponectin increases bone mass by suppressing osteoclast and activating osteoblast. Biochem Biophys Res Commun 2005;331:520-6.
27. Tanner JM. Growth at adolescence. 2nd ed. Oxford, England: Blackwell
Scientific Publications; 1962.
28. Greulich WW, Pyle SI. Radiographic atlas of skeletal development of the
29. Sugiyama T, Yamaguchi A, Kawai S. Effects of skeletal loading on bone mass and compensation mechanism in bone: a new insight into the ‘mechanostat’ theory. J Bone Miner Metab 2002;20:196-200.
30. Crabtree NJ, Kibirige MS, Fordham JN, Banks LM, Muntoni F, Chinn D,
et al. The relationship between lean body mass and bone mineral content in paediatric health and disease. Bone 2004;35:965-72.
31. Petit MA, Beck TJ, Shults J, Zemel BS, Foster BJ, Leonard MB.
Proximal femur bone geometry is appropriately adapted to lean mass in overweight children and adolescents. Bone 2005;36:568-76.
32. Takeda S, Elefteriou F, Levasseur R, Liu X, Zhao L, Parker KL, et al. Leptin regulates bone formation via the sympathetic nervous system. Cell. 2002;111:305-17.
33. Goulding A, Taylor RW. Plasma leptin values in relation to bone mass
and density and to dynamic biochemical markers of bone resorption and formation in postmenopausal women. Calcif Tissue Int 1998;63:456-8.
34. Martini G, Valenti R, Giovani S, Franci B, Campagna S, Nuti R.
Influence of insulin-like growth factor-1 and leptin on bone mass in healthy postmenopausal women. Bone 2001;28:113-7.
35. Papadopoulou F, Krassas GE, Kalothetou C, Koliakos G, Constantinidis
TC. Serum leptin values in relation to bone density and growth hormone-insulin like growth factors axis in healthy men. Arch Androl 2004;50:97-103.
36. Sato M, Takeda N, Sarui H, Takami R, Takami K, Hayashi M, et al. Association between serum leptin concentrations and bone mineral density, and biochemical markers of bone turnover in adult men. J Clin Endocrinol Metab 2001;86:5273-6.
37. Lorentzon M, Landin K, Mellstrom D, Ohlsson C. Leptin is a negative
independent predictor of areal BMD and cortical bone size in young adult Swedish men. J Bone Miner Res 2006;21:1871-8.
38. Luo XH, Guo LJ, Yuan LQ, Xie H, Zhou HD, Wu XP, et al. Adiponectin
stimulates human osteoblasts proliferation and differentiation via the MAPK signaling pathway. Exp Cell Res 2005;309:99-109.
39. Richards JB, Valdes AM, Burling K, Perks UC, Spector TD. Serum
adiponectin and bone mineral density in women. J Clin Endocrinol Metab 2007;92:1517-23.
40. Huang KC, Cheng WC, Yen RF, Tsai KS, Tai TY, Yang WS. Lack of
independent relationship between plasma adiponectin, leptin levels and bone density in nondiabetic female adolescents. Clin Endocrinol (Oxf) 2004;61:204-8.
41. Kontogianni MD, Dafni UG, Routsias JG, Skopouli FN. Blood leptin and
adiponectin as possible mediators of the relation between fat mass and BMD in perimenopausal women. J Bone Miner Res 2004;19:546-51.
42. Schwartz AV. Diabetes Mellitus: Does it Affect Bone? Calcif Tissue Int
43. Manzoni P, Brambilla P, Pietrobelli A, Beccaria L, Bianchessi A, Mora S, et al. Influence of body composition on bone mineral content in children and adolescents. Am J Clin Nutr 1996;64:603-7.