Copyright © 2014 The Korean Society for Bone and Mineral Research
This is an Open Access article distributed under the terms of the Creative Commons Attribution Non-Commercial Li- cense (http://creativecommons.org/licenses/by-nc/3.0/) which permits unrestricted non-commercial use, distribu- tion, and reproduction in any medium, provided the original work is properly cited.
pISSN 2287-6375 eISSN 2287-7029
Efficacy of Dual Energy X-ray Absorptiometry for Evaluation of Biomechanical Properties:
Bone Mineral Density and Actual Bone Strength
Sung Hwa Seo1, Joomi Lee2, Il Hyung Park3
1Department of Medical and Health Science, Gyeongju University, Gyeongju;
2Department of Biomedical Sciences, Kyungpook National University, Daegu;
3Department of Orthopaedic Surgery, Kyungpook National University School of Medicine, Daegu, Korea
Introduction: Bone mineral density (BMD) is an important index in diagnosis of osteo- porosis and other metabolic bone diseases, prediction of fractures, and monitoring treatment. This study was to find a more feasible technique for prediction of osteoporot- ic fracture between dual energy X-ray absorptiometry (DXA) and quantitative computed tomography (QCT) and to reveal the actual change of bone strength when BMD was changed. Methods: Ten of these 20 specimens were used as the demineralized group and the other 10 as the control. Each specimen was immersed in HCl solution at for a period of at least 10 minutes, up to 100 minutes, at an interval of 10 minutes for differ- ent levels of demineralization. BMD was measured using DXA and QCT. Uniaxial com- pression tests were conducted to mea sure biomechanical parameters. Pearson correla- tion analysis was used respectively be tween BMD and biomechanical parameters and between DXA and QCT. Results: Elastic modulus (r=0.87) and yield stress (r=0.84) showed a statistically significant correlation with DXA BMD. Through correlation analysis with QCT BMD and elastic modulus, correlation coef ficient showed hemi-vertebra (r=0.80) and trabecular (r=0.68). In yield stress, there was a statistically significant cor- relation in hemi-vertebra (r=0.87) and trabecular bone (r=0.84). Conclusion: DXA is a current standard technique not only for diagnosis of osteoporosis but also for prediction of fracture risk compared to QCT. Actual decrease of bone strength was much greater than that of BMD by both DXA and QCT.
Key Words: Absorptiometry photon, Biomechanical phenomena, Bone density, Osteo- porosis
INTRODUCTION
Osteoporosis is a systemic skeletal disease characterized by low bone mass and deterioration of bone microstructure, leading to bone fragility and susceptibility to fracture.[1] Skeletal sites with high trabecular content, including the spine, proxi- mal femur, and distal radius, are the usual sites of osteoporotic fractures.[2] Occur- rence of these fractures is common in the aged, and, in particular, vertebral com- pression fractures are a major clinical problem involving substantial morbidity and mortality.[3] With extension of the average lifespan, the total number of the population who are affected by osteoporosis is also expected to increase.[4] As a Corresponding author
Il Hyung Park
Department of Orthopaedic Surgery, Kyungpook National University School of Medicine, 680 Gukchaebosang-ro, Jung-gu, Daegu 700-842, Korea
Tel:+82-53-200-5634 Fax:+82-53-200-6337 E-mail: [email protected] Received: June 16, 2014 Revised: August 20, 2014 Accepted: August 21, 2014
No potential conflict of interest relevant to this article was reported.
Original Article
result, prevention and treatment of osteoporosis has emerg- ed as a serious social and financial.
Bone mineral density (BMD) is an important index in di- agnosis of osteoporosis and other metabolic bone diseas- es, prediction of fractures, and monitoring treatment.[5]
Despite the fact that there are many tests for measuring BMD, most tests different from each other with regard to which bones are measured for determination of BMD val- ues. Dual energy X-ray absorptiometry (DXA), quantitative computed tomography (QCT), and quantitative ultrasound (QUS) techniques can be used for measurement of BMD.
QUS is inexpensive, without radiation exposure so useful as a prescreening tool; however, this technique cannot be used to monitor treatment of osteoporosis.[6]
Due to its low cost, high reproducibility, ease of use, and minimum exposure to radiation, DXA is the most widely used technique for assessment of BMD.[7] Nevertheless, as a technique that measures areal BMD in g/cm2, DXA has a limitation in evaluation of bone geometry and cannot pro- vide a separate bone mass for cortical and trabecular areas.
However, QCT, which measures volumetric BMD in mg/cm3, provides information on 3D bone geometry, and enables compartmental bone assessments.
Consequently, in explaining vertebral fractures, it has been argued that QCT has greater sensitivity than DXA.[7]
However, compared with DXA, the main disadvantages of QCT include high exposure to radiation for moderately high-resolution, difficulties with quality control, and high cost.[8] Regarding the limitations of these two methods, discussion of the accuracy and difference of the BMD value has been considerable.
A large number of clinical studies have recently reported on comparative analysis of bone density measured by DXA and QCT,[8,9] however, few studies using these two meth- ods have been conducted for analysis of direct correlation between biomechanical properties and BMD.[10] In this experimental study, an artificial demineralization method using HCl solution was employed for simulation of osteo- porosis. Axial compression test was performed to evaluate correlation between BMD according to DXA and QCT and biomechanical properties.
The purpose of this study was, First, to find a more feasi- ble technique for prediction of osteoporotic fracture be- tween DXA and QCT, and, Second, to reveal the actual change of bone strength when BMD was changed.
METHODS
1. Cadaveric material
Whole human vertebrae from the eighth thoracic to the fifth lumbar spine were received from the department of anatomy, School of Medicine, Kyungpook National Univer- sity. Within 72 hours after death, spines were removed from one fresh cadaver (a 69-year-old male) with no condition known to affect bone metabolism. This experimental study was approved by the institutional review board (IRB).
Spines were separated into individual vertebrae. Surroun- ding musculature, ligaments, periosteum, and interverte- bral discs were removed from these 10 vertebrae, and the vertebral spinous process were all cut out. These 10 verte- brae were cut into specimens exactly half of the width for use in biomechanical compression testing of the deminer- alized and control groups. Prior to cutting into half verte- bra, plain radiographs were evaluated in order to confirm that both sides were apparently equal. Ten specimens of hemi-vertebra were included in the demineralized group and the other 10 were used as the control group. Prior to the procedure, all specimens were embedded in 10% for- malin solution (Duksan Pure Chemicals Co., Ansan, Korea) for a period of 24 hours. In particular, specimens belonging to the control group were kept in immersion until use in biomechanical testing.
Prior to performance of the demineralization procedure, DXA (anterior-posterior direction) and QCT (transverse plane) were performed for measurement of BMD of all specimens.
2. Demineralization procedure
Ten specimens of the demineralized group were used in performance of the demineralization procedure. In order to simulate osteoporosis with demineralization, each spec- imen was dipped in 1N HCl (Duksan Pure Chemicals Co., Ansan, Korea) at room temperature. This method for bone demineralization has been described in several other stud- ies.[11,12] Each specimen was immersed in HCl solution at for a period of at least 10 minutes, up to 100 minutes, at an interval of 10 minutes for different levels of demineralization.
After processing, specimens were washed with running distilled water for removal of remaining HCl, followed by immersion in phosphate buffered saline (Duksan Pure Che- micals Co., Ansan, Korea). Specimens were re-embedded in 10% formalin solution for a period of 24 hours prior to
conduct of DXA, QCT, and biomechanical studies.
3. Measurement of BMD
DXA (Lunar Prodigy Advance en CORE 2005, GE Lunar, Medison, WI, USA) and QCT scanners (Philips MX 16 CT Scanner 120 kV, 100 mA; Phillips Medical Systems, Eind- hoven, Netherlands) with a high-resolution bone algorithm were used for measuring BMD. The absolute values of BMD before and after the demineralization process were mea- sured for each specimen. Decrease of BMD was expressed in differences (%), normal (before demineralization) was counted as 100%. After calibration of densitometry with a set of Ca-HA phantoms for mapping of a standard gray scale, a specimen was placed in a prone positioned in a plastic jar for measuring BMD. QCT was checked at a thick- ness of 6 mm parallel to the endplates in the longitudinal middle of the specimen. An image analysis program (CIR- SCALC-CT Bone; Densitometry version 6.12; Philips Health- care, Hamburg, Germany) was used for determination of QCT. After completion of measurements, specimens were restored in 10% formalin solution.
1) Biomechanical axial compression testing
Uniaxial compression tests were performed for measure- ment of elastic modulus and yield stress of specimens of the control group and the demineralized group (10 speci- mens in each group). Prior to performance of the compres- sion test, assessment of BMD values of the control and de-
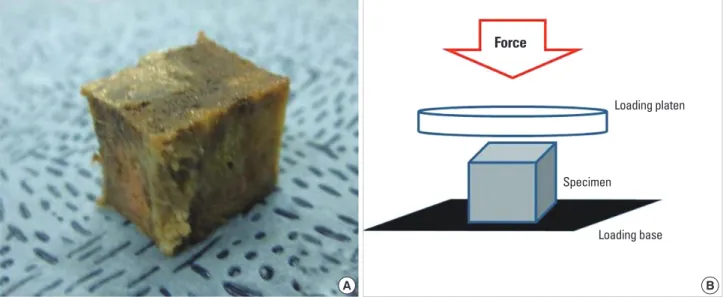
mineralized groups was performed. Using a bone saw, for a parallel surface and uniformity of sample size, control and demineralized specimens were cut off in the shape of a cube (approximately 15×10×15 mm3). Cut specimens contained only a trabecular bone (Fig. 1A). Cube-shaped specimens of the control group and the demineralized group were then placed on the axial compression testing machine (Texture Analyzer, TA-HD 1500; Texture Technolo- gies Corp., Scardsale, NY, USA) with one-loaded platen rods in displacement control (Fig. 1B).
Elastic modulus and yield stress were determined under the axial compression test with a nominal deformation rate of 0.2 mm/second. The modulus was determined as maxi- mum slope in the initial linear region of the stress-strain curve; yield stress was defined as the stress at which a speci- men began to show plastic deformation, here the 0.2% off- set yield strain method for yield point was used.[13] The specimen was purely trabecular and porous in structure, therefore, evaluation of ultimate stress could not be per- formed.
4. Statistical analyses
SPSS software (ver. 18.0 for Windows; SPSS Inc., Chicago, IL, USA) was used in performance of all statistical tests. Sci- entific Data Analysis and Graphing Software (SigmaPlot, version 10.0; Systat Software Inc., Chicago, IL, USA) was used in performance of statistical linear regression analy- sis. The independent t-test was used for mean comparison
Force
Loading platen
Specimen
Loading base
A
Fig. 1. (A) All specimens were cut off (approximately 15×10×15 mm3) in the shape of a cube and (B) were compressed under one-loaded platen rods on an axial compression testing machine in displacement control.
B
between BMDs using DXA and QCT. Percent decrements were used to describe differences between before and af- ter in the demineralized group and between the control and demineralized groups.
Pearson correlation analysis was used to determine cor- relation between DXA and QCT and between BMD and bio- mechanical properties. Results were expressed as means
±SD, and a P-value below 0.05 indicated statistical signifi- cance.
RESULTS
1. BMD of DXA and QCT
The difference of DXA BMD with passage time according to standard value of undemineralization (100%) was mea- sured; results showed a significant decrease every 10 min- utes, approximately 3.20%, respectively (R2=0.95). The dif- ference of QCT BMD showed a significant decrease every 10 minutes, approximately 4.57% (R2=0.78) in hemi-verte- bral, 4.44% (R2=0.61) in trabecular, respectively. The QCT BMD was check on hemi-vertebral and trabecular bone be- cause cortical bone is very few in each specimen.
2. Biomechanical axial compression test
As shown in Table 1, results of an independent t-test in- dicated significant correspondence for both groups. Mean values of DXA hemi-vertebral BMD were 0.39±031 in the
control group and 0.39±0.37 g/cm2 in the future-demin- eralized group, QCT hemi-vertebral BMD was 57.60±22.40 and 58.24±22.70 mg/cm3, respectively.
Biomechanical parameters (elastic modulus and yield stress, megapascals [MPs=N/mm2]) of the control group and the demineralized group were determined. Differenc- es in two parameters with passage of time were measured according to the standard value of the control group (100%);
results showed a significant decrease every 10 minutes, ap- proximately 2.78% (R2=0.78), in elastic modulus and 2.97%
(R2=0.65) in yield stress, respectively.
3. Pearson correlation analysis
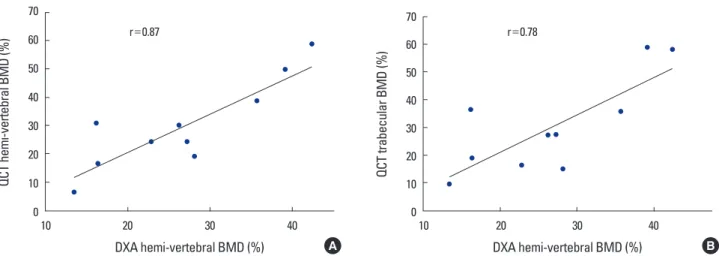
As demineralization was going on with time of digging into HCl, Pearson correlations between parameters of DXA and QCT BMD are listed in Table 2. A statistically significant correlation was observed between the parameters (corre- lation coefficient; r=0.87 in DXA and QCT hemi-vertebral, r=0.78 in DXA and QCT trabecular bone) (Fig. 2A, B).
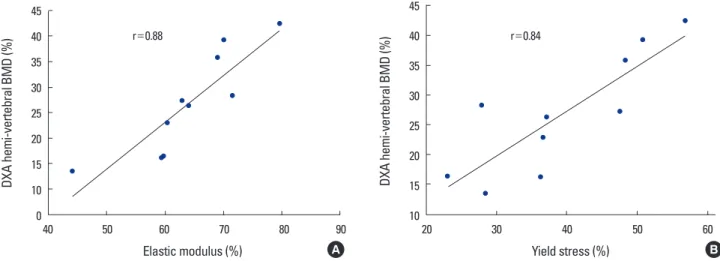
Elastic modulus (r=0.88, P<0.01) and yield stress (r=
0.84, P<0.01) showed a statistically significant correlation with DXA BMD. In QCT BMD, Elastic modulus showed high correlation coefficient (r=0.81, P<0.01 in hemi-vertebral and r=0.68, P<0.05 in trabecular bone). With yield stress, a statistically significant correlation was observed in hemi- vertebral (r=0.87, P<0.01) and trabecular bone (r=0.84, P<0.01) (Table 3).
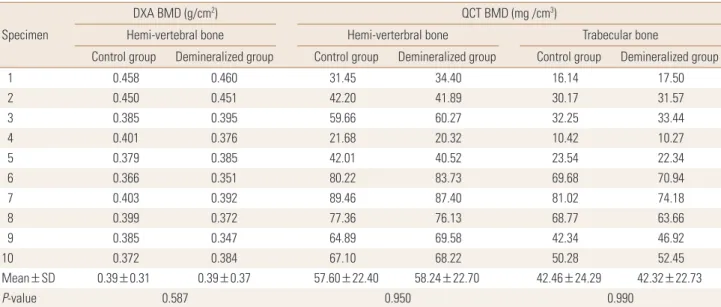
Table 1. Summary of dual energy X-ray absorptiometry and quantitative computed tomography bone mineral density values of specimens, unde- mineralized two (control and demineralized) group
Specimen
DXA BMD (g/cm2) QCT BMD (mg /cm3)
Hemi-vertebral bone Hemi-verterbral bone Trabecular bone
Control group Demineralized group Control group Demineralized group Control group Demineralized group
1 0.458 0.460 31.45 34.40 16.14 17.50
2 0.450 0.451 42.20 41.89 30.17 31.57
3 0.385 0.395 59.66 60.27 32.25 33.44
4 0.401 0.376 21.68 20.32 10.42 10.27
5 0.379 0.385 42.01 40.52 23.54 22.34
6 0.366 0.351 80.22 83.73 69.68 70.94
7 0.403 0.392 89.46 87.40 81.02 74.18
8 0.399 0.372 77.36 76.13 68.77 63.66
9 0.385 0.347 64.89 69.58 42.34 46.92
10 0.372 0.384 67.10 68.22 50.28 52.45
Mean±SD 0.39±0.31 0.39±0.37 57.60±22.40 58.24±22.70 42.46±24.29 42.32±22.73
P-value 0.587 0.950 0.990
BMD, bone mineral density; DXA, dual energy X-ray absorptiometry; QCT, quantitative computed tomography.
Table 2. Pearson’s correlation coefficient between dual energy X-ray absorptiometry bone mineral density (BMD) and quantitative com- puted tomography BMD parameters (%) as progressive demineraliza- tion time
DXA parameters QCT parameters
Hemi-vertebral bone Trabecular bone DXA Hemi-vertebral bone 0.869a) 0.779a)
a)Significant Correlation<0.01.
DXA, dual energy X-ray absorptiometry; QCT, quantitative computed to- mography.
Table 3. Pearson’s correlation coefficient between bone mineral den- sity and biomechanical axial compression parameters (%) as progres- sive demineralization time
BMD parameters Biomechanical parameters Elastic modulus Yield stress DXA Hemi-vertebral bone 0.876b) 0.841b)
QCT Hemi-vertebral bone
Trabecular bone 0.805b)
0.684a) 0.871b)
0.841b)
a)Significant Correlation<0.05, b)Significant Correlation<0.01.
BMD, bone mineral density; DXA, dual energy X-ray absorptiometry; QCT, quantitative computed tomography.
Fig. 2. The graphs showed a strong correlation (A) between quantitative computed tomography (QCT) hemi-vertebral bone mineral density (BMD) and dual energy X-ray absorptiometry (DXA) BMD (r=0.87), (B) QCT trabecular and DXA BMD (r=0.78) as time progression.
QCT hemi-vertebral BMD (%)
70 60 50 40 30 20 10
010 20 30 40
DXA hemi-vertebral BMD (%) r=0.87
A
QCT trabecular BMD (%)
70 60 50 40 30 20 10
010 20 30 40
DXA hemi-vertebral BMD (%) r=0.78
B
DISCUSSION
DXA and QCT have been widely used for measuring BMD.
As a test reading fracture risk assessment, DXA is most valid test;[14] however, in explaining vertebra fractures, greater sensitivity of QCT, compared with DXA, has been reported.
[7] In this study, statistically significant correlation was ob- served between DXA and QCT (r=0.87) (Table 2). Through- out the entire process of simulation of bone loss as progres- sive demineralization time, a strong relationship has been observed between the two devices. According to findings of some research studies, BMD values of DXA and QCT, as a whole, showed a statistically significant relationship (r=
0.66).[15]
Use of QCT has resulted in some progress in separation of bone density into hemi-vertebral, cortical, and trabecu- lar bone density. Findings of this study demonstrated sta- tistically strong correlation between hemi-vertebral and trabecular BMD (r=0.96), higher than that between hemi-
vertebral and cortical (r=0.72) in QCT. The vertebral body consists of trabecular and cortical bone, and trabecular bone is 60-70% of total bone. Therefore, bone loss of ver- tebra represents reduction of BMD of trabecular bone.[16]
Prior to performance of the axial compression test, all specimens were cut off in the shape of a cube in order to provide a flat surface for application during the test. Thus, the cut specimens contained only a trabecular bone. Mi- crostructure, density, and mechanical properties of trabec- ular bone are strongly dependent on loading direction;
therefore, in consideration of the anisotropy of trabecular bone, all specimens were compressed in the same direc- tion.[17]
To a great extent, variance in mechanical properties (mo- dulus, strength) of trabecular bone can be explained by apparent density. Apparent density explains approximate- ly 60% of the variance in modulus and strength of trabecu-
lar bone.[18] In addition, some research studies have re- ported a high correlation (R2=0.9) between BMD and the mechanical properties of bone.[19,20]
In order to obtain these mechanical properties, the test was also performed in this study. Fracture risk can be de- fined as the ratio between the load under particular load- ing conditions and the ultimate load supported by bone strength.[21] Unfortunately, because the specimen was porous as a result of progressive demineralization, evalua- tion of ultimate stress could not be performed. Therefore, all specimens were evaluated for elastic modulus and yield stress.
In analysis of correlation between biomechanical param- eters and BMD using DXA and QCT, elastic modulus and yield stress showed statistically significant correlation with DXA and QCT BMD (Table 3).
In this study, all findings of DXA and QCT BMD showed high correlation with elastic modulus. Because mineral content and hardness are strongly related, a relationship between hardness and elastic modulus in trabecular bone has also been suggested.[22] Compared with the control group, elastic modulus showed a significant decrease of approximately 30% (R2=0.65) for every 10 minutes of de- mineralization, respectively. For example, a 30% decrease of BMD according to findings on DXA and QCT indicates a 65% decrease of elastic modulus in a cadaveric vertebra (Fig. 3A).
DXA and QCT BMD showed high correlation with yield stress, which could reflect the failure force of the compres- sion fracture. A significant decrease in yield stress was ob-
served every 10 minutes during the demineralization pro- cess, approximately 28%, respectively (R2=0.78). Ultimate- ly, when a 30% decrease of BMD was observed according to findings of DXA and QCT, yield stress showed a decrease of approximately 40% in cadaveric vertebra (Fig. 3B).
This experimental study was designed for determination of which technique is better for prediction of an osteopo- rotic vertebral compression fracture. Several authors have reported that DXA had limitation on geometric and struc- tural information; DXA cannot predict fracture risk.
However, according to findings of this study, both DXA and QCT BMD showed strong correlation with biomechan- ical properties in cadaveric thoraco-lumbar vertebra. There- fore, DXA could be as predictive of fracture risk as QCT. In addition, DXA is inexpensive, involves a very low dose of radiation (effective dose of less than 0.01 millisievert [mSv]), and is considered as economical for use in management of bone disease.[23] Findings of this study demonstrated the potential for use of DXA as a current standard clinical tech- nique, not only for diagnosis of osteoporosis, but also for prediction of fracture risk.
Studies of bone loss and spinal implant of osteoporotic vertebra are important in the effort to gain an understand- ing of bone biomechanics and for development of instru- ments.[24] Results of one biomechanical animal study have demonstrated an association of mean tissue density and compressive strength of calf spines with a young healthy human spine.[25] Hence, in experimental study, animal spines are used as a substitute for human cadaveric speci- mens. However, an animal model has limitation for simula-
Fig. 3. The graphs showed a strong correlation (A) between elastic modulus (r=0.88) for dual energy X-ray absorptiometry (DXA) bone mineral density (BMD) and (B) yield stress and quantitative computed tomography (QCT) hemi-vertebral BMD (r=0.87) as time progression.
DXA hemi-vertebral BMD (%)
45 40 35 30 25 20 15 10
040 50 60 70 80 90
Elastic modulus (%) r=0.88
A
DXA hemi-vertebral BMD (%)
45 40 35 30 25 20 15
1020 30 40 50 60
Yield stress (%) r=0.84
B
tion of severe osteoporosis.[26]
This study was conducted for simulation of osteoporosis through a cadaveric spine and analysis of the association with BMD and biomechanical properties. In addition, the current study demonstrated creativity by cutting each ver- tebra for in order to rule out cadaveric heterogeneity, which was inadequate, such as heterogeneity from a biomechan- ical perspective.
In this study, despite the small number of specimens, there was no shortage of specimens for establishment of statistical results. In addition, biomechanical testing was only performed on trabecular bone. Additional studies us- ing long bone containing large amount of cortical bone for determination of fracture risk of cortical bone are needed.
For the future, a large number of cadaveric and large scale clinical studies will be required.
This study demonstrated the relationship between bio- mechanical parameters and BMD measured using DXA and QCT. Both DXA and QCT showed strong correlation with biomechanical parameters in cadaveric vertebra. There- fore, DXA and QCT showed equivalent accuracy and persis- tency for prediction of vertebral fracture risk. Findings from this study indicate the potential for use of DXA as a current standard clinical technique, not only for diagnosis of os- teoporosis, but also for prediction of vertebral fracture risk, when compared to the QCT technique. In addition, actual decrease of bone strength was much greater than that of BMD by both DXA and QCT.
REFERENCES
1. Peck WA, Burckhardt P, Christiansen C, et al. Consensus de- velopment conference: diagnosis, prophylaxis, and treat- ment of osteoporosis. Am J Med 1993;94:646-50.
2. Ettinger B, Black DM, Nevitt MC, et al. Contribution of ver- tebral deformities to chronic back pain and disability. The Study of Osteoporotic Fractures Research Group. J Bone Miner Res 1992;7:449-56.
3. Lee YK, Jang S, Jang S, et al. Mortality after vertebral frac- ture in Korea: analysis of the National Claim Registry. Os- teoporos Int 2012;23:1859-65.
4. Damilakis J, Maris TG, Karantanas AH. An update on the assessment of osteoporosis using radiologic techniques.
Eur Radiol 2007;17:1591-602.
5. Liu S, Oguchi Y, Borner JW, et al. Increased canine pancre-
atic acinar cell damage after organophosphate and ace- tylcholine or cholecystokinin. Pancreas 1990;5:177-82.
6. Gregg EW, Kriska AM, Salamone LM, et al. The epidemiol- ogy of quantitative ultrasound: a review of the relation- ships with bone mass, osteoporosis and fracture risk. Os- teoporos Int 1997;7:89-99.
7. Bergot C, Laval-Jeantet AM, Hutchinson K, et al. A compar- ison of spinal quantitative computed tomography with dual energy X-ray absorptiometry in European women with vertebral and nonvertebral fractures. Calcif Tissue Int 2001;68:74-82.
8. Black DM, Bouxsein ML, Marshall LM, et al. Proximal femo- ral structure and the prediction of hip fracture in men: a large prospective study using QCT. J Bone Miner Res 2008;
23:1326-33.
9. Engelke K, Adams JE, Armbrecht G, et al. Clinical use of quantitative computed tomography and peripheral quan- titative computed tomography in the management of os- teoporosis in adults: the 2007 ISCD Official Positions. J Clin Densitom 2008;11:123-62.
10. Lee CY, Chan SH, Lai HY, et al. A method to develop an in vitro osteoporosis model of porcine vertebrae: histologi- cal and biomechanical study. J Neurosurg Spine 2011;14:
789-98.
11. Actis AB, Obwegeser JA, Rupérez C. Influence of different sterilization procedures and partial demineralization of screws made of bone on their mechanical properties. J Biomater Appl 2004;18:193-207.
12. McLean FC, Urist MR. Bone, an introduction to the physi- ology of skeletal tissue. Chicago, IL: The University of Chi- cago Press; 1955.
13. Bayraktar HH, Morgan EF, Niebur GL, et al. Comparison of the elastic and yield properties of human femoral trabec- ular and cortical bone tissue. J Biomech 2004;37:27-35.
14. Nelson HD, Helfand M, Woolf SH, et al. Screening for post- menopausal osteoporosis: a review of the evidence for the U.S. Preventive Services Task Force. Ann Intern Med 2002;137:529-41.
15. Schneider P, Börner W. Indication for bone density mea- surement and critical review. Nuklearmediziner 1993;13:
83-91.
16. Block JE, Smith R, Glueer CC, et al. Models of spinal trabe- cular bone loss as determined by quantitative computed tomography. J Bone Miner Res 1989;4:249-57.
17. Goldstein SA. The mechanical properties of trabecular bone:
dependence on anatomic location and function. J Biomech 1987;20:1055-61.
18. Goulet RW, Goldstein SA, Ciarelli MJ, et al. The relationship between the structural and orthogonal compressive prop- erties of trabecular bone. J Biomech 1994;27:375-89.
19. Lang TF, Keyak JH, Heitz MW, et al. Volumetric quantitative computed tomography of the proximal femur: precision and relation to bone strength. Bone 1997;21:101-8.
20. Lotz JC, Hayes WC. The use of quantitative computed to- mography to estimate risk of fracture of the hip from falls.
J Bone Joint Surg Am 1990;72:689-700.
21. Hayes WC, Piazza SJ, Zysset PK. Biomechanics of fracture risk prediction of the hip and spine by quantitative com- puted tomography. Radiol Clin North Am 1991;29:1-18.
22. Hodgskinson R, Currey JD, Evans GP. Hardness, an indica- tor of the mechanical competence of cancellous bone. J Orthop Res 1989;7:754-8.
23. Schousboe JT, Ensrud KE, Nyman JA, et al. Universal bone densitometry screening combined with alendronate ther- apy for those diagnosed with osteoporosis is highly cost- effective for elderly women. J Am Geriatr Soc 2005;53:1697- 704.
24. Goldhahn J, Neuhoff D, Schaeren S, et al. Osseointegration of hollow cylinder based spinal implants in normal and osteoporotic vertebrae: a sheep study. Arch Orthop Trau- ma Surg 2006;126:554-61.
25. Swartz DE, Wittenberg RH, Shea M, et al. Physical and me- chanical properties of calf lumbosacral trabecular bone. J Biomech 1991;24:1059-68.
26. Akbay A, Bozkurt G, Ilgaz O, et al. A demineralized calf ver- tebra model as an alternative to classic osteoporotic ver- tebra models for pedicle screw pullout studies. Eur Spine J 2008;17:468-73.