AJCPP 2008 March 6-8, 2008, Gyeongju, Korea
Flow Dynamics of Gas Turbine Swirl Nozzle
Hideki Moriai, Yohei Fujimoto, Yoshiaki Miyake Mitsubishi Heavy Industries, Ltd.
1200, Higashi Tanaka, Komaki, Aichi Prefecture, 485-8561 Japan Keywords: Gas Turbine, Combustor, Nozzle, Flow, Recirculation Zone
Abstract
CFD cold-flow analysis results of the air-blast swirl nozzle for the small aircraft engine combustor are shown. Two major recirculation zones are observed near the nozzle. The centerline recirculation zone velocity profile of CFD is compared with the experimental results.
Introduction
In the aircraft gas-turbine engine, the combustor has to meet many requirements such as combustion efficiency, NOx/CO/UHC emission, exit temperature profile, altitude relight capability, and lean blowout limit. To mainly satisfy the combustion efficiency and emission requirements, air-blast swirl nozzle is commonly used. However, this type of nozzle sometimes has issue with altitude relight capability and lean blowout performance. Those performances are closely related with the recirculation zone, which works as a flame holder of the combustor. Therefore, it is very important to understand the relationship between the recirculation flow and swirl design in order to optimize the nozzle performance.
MHI has been working on the research and development of the Rich/Quench/Lean type low emission combustor
1)with the air-blast fuel nozzle.
The combustor concept is shown in Figure 1.
NOx Emission
Stoichiometry Rich Burn Lean Burn
Lean Burn
Lean Rich
Quick Quench Rich Burn
Fuel Nozzle
NOx Emission
Stoichiometry Rich Burn Lean Burn
Lean Burn
Lean Rich
Quick Quench Rich Burn
Fuel Nozzle
Figure 1. Fuel Nozzle and the Rich/Quench/Lean Low Emission Combustor
1)The fuel nozzle is high performance air-blast type.
Conventional pressure type nozzle is another option but pressure type nozzle in general has poor air- mixing characteristics at the nozzle exit because fuel
spray and mixing occurs separately. On the contrary, in the air-blast nozzle, the fuel atomization is assisted by strong airflow, which simultaneously mixes with fine fuel droplets. To achieve uniform rich combustion and to avoid soot formation at the rich burn zone, mixing uniformity between fuel and air is vital in this type of combustor.
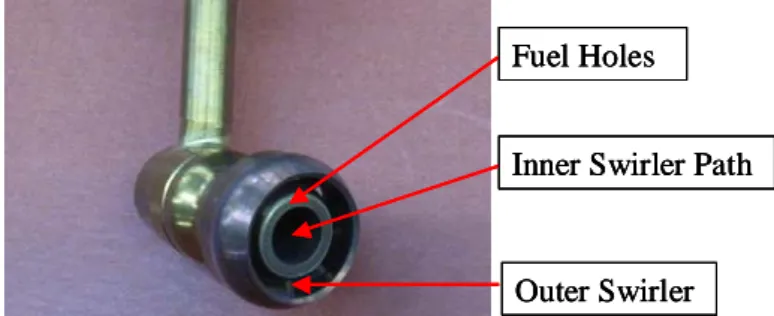
Our air-blast nozzle is composed of inner swirl vanes, outer swirl vanes, and fuel injection holes as shown in Figure 2. The swirl flow directions of the inner and outer are the same (co-rotation flow). For simple nozzle design, there is only one primary fuel line (no secondary fuel line). Fuel is injected from the simple holes machined on the plane surface. The injected fuel flow is air-blasted by inner swirl vanes and outer swirl vanes, into fine droplets and mixed with air before combustion.
Fuel Holes
Inner Swirler Path
Outer Swirler Fuel Holes Fuel Holes
Inner Swirler Path Inner Swirler Path
Outer Swirler Outer Swirler Figure 2. Air-Blast Fuel Nozzle
CFD Analysis
CFD model description
The commercial STAR-CD code, version 3.26, was used in the present studies. The major calculation options and model assumptions:
Reynolds-Averaged Navier-Stokes (RANS) Model k-ε RNG turbulence model
No chemical reaction (cold-flow condition) Rosin-Rammler distribution
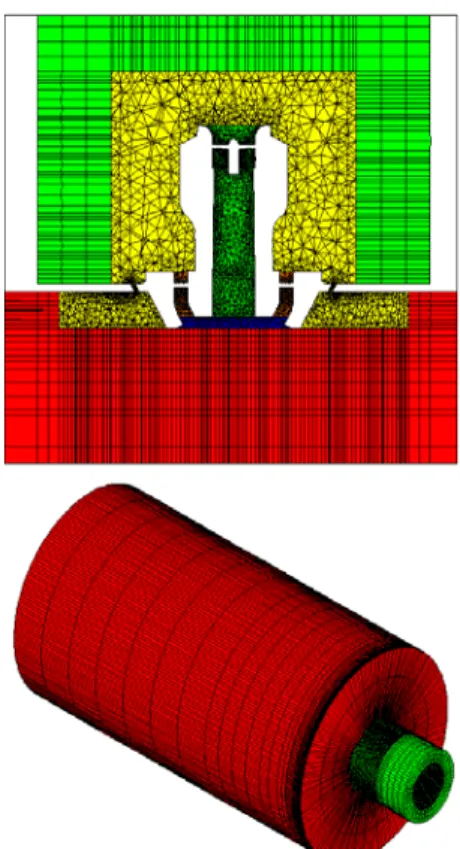
(Spray droplet size distribution of the parcel model) General geometry is shown in Figure 3.
63
AJCPP 2008 March 6-8, 2008, Gyeongju, Korea
Outer Swirler Inner Swirler
Fuel Air
Inner Duct
Outer Duct Outer
Swirler Inner Swirler
Fuel Air
Inner Duct
Outer Duct
Figure 3. General Geometry
Boundary Conditions and Mesh Grids
3D mesh grids are also shown in Figure 4. Number of nodes 295,308, number of cells 872,011.
Boundary conditions:
Air Inlet: 0.299MPa, 384K Air Outlet: 0.279MPa Fuel 288K, 7.46g/s
(Water used for calculation, same as experiment) Non-slip wall
CFD Results
Figure 5 shows the velocity vector map in the vicinity of the nozzle. There are two major recirculation zones, one at the exit of the inner swirl duct (centerline of the nozzle) and one at the outer circumferential root of the nozzle guide (near the soot purge holes). Those recirculation zones are associated with the flame stability or lean blowout limit, altitude relight capability, and NOx emission.
Not enough recirculation zones lead to unstable flame at the low-power conditions and poor altitude relight capability due to the poor flame holder, but too much recirculation zones will result in the considerable NOx emission due to the increase of flow residence time in the combustor. To balance the recirculation zone with the combustor performance is very important.
Recirculation Zones Recirculation Zones Recirculation Zones
Figure 5. Velocity Vector Map
Figure 6 shows the velocity magnitude contour of the same cross-sectional area. The major flow (>10m/s) region is limited within about 5mm downstream of the nozzle. In this nozzle design, because of the high swirl vane angles the swirl flow cone angle is large and this is the reason why the high flow speed zone is very short in the axial direction.
5mm 5mm 5mm
Figure 4. 3-D Mesh Grids
Figure 6. Velocity Magnitude Contour
64
AJCPP 2008 March 6-8, 2008, Gyeongju, Korea
Figure 7 shows the axial velocity magnitude contour map to clearly show the major recirculation zones (thick blue area). It should also be noted that the central part of the nozzle downstream has the very weak recirculation flow according to CFD results.
Figure 7. Axial Velocity Contour (X-direction)
Figure 8 shows the tangential velocity contour map.
From this figure, we can see that the inner swirl flow speed or tangential velocity component is decreased while going through the inner duct (the averaged colors are changing from orange at the exit of the inner swirler to yellow at the exit of the inner duct).
This comes from the friction loss of the inner duct. To keep the strong swirl flow at the inner swirl vanes, the inner duct length should be slightly shortened.
Comparison with Experimental Results
The flow field near the nozzle exit region has been measured using Phase Doppler Particle Analyzer (PDPA). Figure 9 shows the comparison between the PDPA measurement results and the CFD results at the position of 5mm downstream of the nozzle.
It seems that CFD has tendency to overestimate the recirculation zone but the general shape of the recirculation zone and the recirculation velocity near the centerline are similar between experiments and CFD.
To improve the accuracy of CFD analysis, we are currently thinking of applying Large Eddy Simulation (LES) model for more precise turbulent flow and the swirled recirculation flow simulation
2).
-10 0 10 20
0 10 20 30 4
Distance from Center[mm]
Axi al V elo cit y [m/s ]
0