In order to obtain fundamental knowledge of atomization, the three dimensional unsteady phenomenon of pinch off was numerically studied by developed method. Not only liquid shapes but also velocity distributions of numerical results were compared with corresponding experimental ones.
They showed satisfactorily good agreement at least in a qualitative sense. The liquid jet shapes, the pressure and velocity distributions, and the inner flow structures were clarified through the comparisons of distinctly different flow fields due to presence or absence of surface tension. The condition of pinch off, which had close correlation with fluid acceleration at injection, was clearly specified.
Introduction
Combustion of liquid fuels in rocket engines is profoundly dependent on atomization and mixing process of propellants under subcritical pressure conditions. It is thus essential to understand the detailed process of atomization for the desirable combustion systems. Although numerous studies have been conducted since the beginning of 19
thcentury, atomization has been far from thorough understanding. Pinch off phenomenon, which is breakup of round liquid jets due to surface tension, is one of the governing basic processes of liquid atomization. A lot of studies have been made so far on the issue because of its simplicity and importance.
However, since pinch off is associated with very small length and time scales, few quantitative measurements
1)have been reported. Consequently, most of all past numerical results compared only liquid and droplet shapes with experimental results.
Though Pan,Y. and Suga,K.
2)compared velocity distributions with experiments quantitatively, detailed flow filed was not discussed. Therefore, flow characteristics, such as pressure and velocity distributions, and the breakup process have not been fully understood yet. Since pinch off is a surface tension predominant phenomenon, precise prediction of pinch off can contribute to estimation of droplet sizes through secondary atomization.
In the present study, the objective is to clarify the detailed unsteady flow characteristics of pinch off by numerical analysis. Thus, a new numerical method that can handle unsteady two phase flow has been developed so far, in which real fluid effects and compressibility are effectively involved. The
corresponding experimental data. Then, liquid shapes, velocity and pressure distributions were clarified through the comparisons of distinctly different flow fields due to presence or absence of surface tension.
Flow process from nozzle exit to pinch off was also clearly specified by the use of numerical tracer.
Analysis Model and Numerical Method Analysis Model
The present numerical model corresponds to the experimental one in Longmire, E.K. et al.(2001)
1). They not only visualized the flow field in pinch off process, but also measured two-dimensional velocity field. Figure 1 shows their experimental apparatus.
Glycerin/water solution was pumped around the flow loop and was injected into silicon fluid (Dow Corning 200) through a circular nozzle. Flow rate was controlled with the needle valve and was measured by the flow meter. For ensuring periodic pinch off at a specified frequency, a sinusoidal perturbation was superposed on the nozzle exit velocity by the speaker attached to the flow circuit. In the test section, the jet shapes were recorded on a camera and velocity distributions were measured by Particle-Imaging Velocimetry (PIV). The nozzle diameter was 10mm, the average inlet velocity of the injected jet was 25mm/s and the perturbation frequency was 10Hz.
The initial velocity amplitude due to the perturbation was not measured in the experiment. The properties of the working fluids and their dimensionless parameters under the experimental conditions are shown in Table 1 and 2, respectively. As shown in Table 2, all the values of dimensionless parameters are small. The inertia force, surface tension, viscous force and gravity force must therefore be taken into account in the present flow model.
Numerical Method
Flow fields with liquid/liquid interface are described by the following three-dimensional Navier- Stokes equations for homogeneous two-phase flow;
( u )
t
ρ ρ
∂ + ⋅∇ ∂
G = − ∇ ⋅ ρ
uG
(1)
ρ ∂ + ∂ u t G ρ ( u G ⋅∇ ) u G = : ∇
Π+ ρ
gG (2)
ρ ∂ + ∂ e t ρ ( u G ⋅∇ ) e = [
Π: ∇ ⋅ − ∇ ⋅ ]
uG
qG
(3)
where the stress tensor
Πincludes the pressure
tensor
pI, viscous force
Tνand surface force
Tσ.
With the unit vector n G
sperpendicular to the liquid surface, each tensor is written as follows.
Π
= p −
I T+
ν+
Tσ(4)
Tν= λ ( ∇ ⋅
uG ) I + µ ( ∇ + ∇
uG
uG
T) (5)
Tσ
= σδ
S( I −
n nG G
s s) (6)
In order to track motions of the liquid surface and capture the configuration, the Heaviside function
HS
is introduced as an independent variable;
0.5
HS
= + (
ifψ
>0 : Liquid Jet)
0
HS
= (
ifψ
=0 : Interface)
0.5
HS
= − (
ifψ
<0 : Ambient fluid)
In the flow field,
HSfollows the convection equation
( )
S S
H u H
t
∂ + ⋅∇
∂
G = 0 (7)
CIP-LSM (CIP-based Level Set & Mars)
3)was adopted for the analysis of atomization process. In CIP-LSM, the governing equations (1)-(3) are solved with TCUP
4), that is Temperature-based CCUP
5). The convection equation (7) is solved by HLSM (Hybrid LSM & Mars), which is based on LSM (Level-Set Method)
6)and MARS (Multi-interface Advection and Reconstruction Solver)
7). Owing to the complementary combination of LSM and MARS, HLSM can accomplish the volume conservation with capturing the liquid surface distinctly. Surface tension is computed as a body force based on CSF (Continuum Surface Force) model
8).
Numerical Conditions
Figure 2 shows computational domain and grid system. The grid system is composed of orthogonal cross grids with 40x40x196 stencils. Finer grids are arranged around the injected jet and breakup point, while coarse grids are allocated at the surrounding domain. The circular nozzle of 10mm in diameter is located at the top center of the domain. The nozzle is resolved with 32 grids of 0.313mm in width. z axis is defined to downward as the same direction of gravity acceleration. x and y axes are set as shown in Fig.2.
The origin of the coordinate system is set at the center of the nozzle.
The boundary conditions were as follows;
oscillatory velocity was imposed on the nozzle exit at the upper surface of the domain, free outflow conditions were set at the lower surface, and slip conditions were imposed at the side surfaces. The amplitude of the velocity perturbation at the nozzle exit was fixed to be 15% of the average inlet velocity.
The same amplitude was utilized in the numerical study by Pan,Y. and Suga,K.
2), which simulated the same experiments. The inlet velocity was imposed at the nozzle exit as eq.(8). The spacial distribution was assumed to be uniform at the nozzle exit.
= (1+ sin(2 ))
Vo Ve
α π
ft(8) Here, the average velocity Ve was 25mm/s, the frequency f was 10Hz as in the experiment, and the amplitude of the velocity perturbation α was 0.15.
The surface thickness ε, which was introduced to relax the discontinuity and stabilize the computation, was set to be 4cells or ε=4x0.313mm.
Validation of Numerical Method
The unsteady three-dimensional computation of pinch off resulted in axisymmetric flow fields with respect to the z axis. The numerical results are compared with corresponding experimental ones of flow images and velocity distributions. In the periodical pinch off, the moment of the jet breakup is defined as 0degree of phase(φ=0). The net diameter of the nozzle is defined as D≡D
o-2ε.
Fig. 1 Experimental apparatus (Reproduced from Longmire,E.K., et al.
1))
Table 1 Physical properties Fluid ρ
[kg/m
3] µ
[Pa・s] σ [mN/m]
Water/Glycerin 1140 8.33×10
-327.3 Dow Corning 200 970 4.85×10
-3-
Table 2 Dimensionless parameters
Re ρ
i e oV D/ µ
i35
Fr
Ve( / ρ
i gDo∆ ρ )
0.50.21
Bo
gDo2∆ ρ σ / 6.1
density ratio ρ ρ
i/
o1.2 viscosity ratio µ µ
i/
o1.7
Fig. 2 Computational domain and grid system
(40x40x196 stencils)
with oscillations at the upstream end.
Figure 3(b) shows numerical results in the z-x plane. Numerical results can capture corresponding flow images in Fig.3(a) in a qualitative sense. The small sphere at the jet tip is observed at φ=240. After pinch off, the drop is falling down with oscillation at its upper end. Although a satellite drop is observed from φ=0 to φ=80 only in Fig.3(b), formation of satellite drops was also reported in the experiment under the same condition in Fig.3(a).
Comparison of Velocity Distributions
Figure 4 shows numerical and experimental results of axial velocity distributions. In Fig.4(a), the centerline velocities of the liquid jet are shown against axial positions at φ=0 and 280. The velocity is normalized with respect to the average inlet velocity, and axial distance is normalized based on the nozzle diameter. In the experimental results of φ=0, the flow accelerates sharply up to a maximum at z/D=6.4, and it decelerates to a minimum. At φ=280, the flow accelerates to a maximum at z/D=5.5, and it decelerates to a minimum followed by subsequent acceleration. In the numerical results at φ=0 and 280, axial positions of minimum and maximum velocities coincidence with experimental results, and velocity distributions represent experimental tendencies.
In Fig.4(b), axial velocities against radial positions at z/D=6.0 in the z-x plane at φ=60 and 340 are shown. In the experimental results, a maximum occurs at the center of the jet. The magnitudes decrease with distance from the centerline in both cases. The numerical results show similar distributions as the experimental ones.
Numerical results represent experimental ones of flow images and velocity distributions. Hence, it can be evaluated that CIP-LSM can compute inertia force, surface tension, viscous force and gravity force adequately, and it can simulate pinch off satisfactorily. It was also confirmed that almost same numerical results were obtained when inlet velocity was parabolic distributions and also when the numerical domain was extended to 50mm x 50mm x 100mm.
Results and Discussions
Since pinch off is a surface tension dominant phenomenon, it is important to understand the detailed flow characteristics through comparisons of
distinctly different cases due to presence or absence of surface tension.
Shapes of Liquid Jets
Figure 5 and Fig.6 show three-dimensional jet shapes during one cycle of pinch off with and without surface tension, respectively. In Fig.5, the jet shape at
(b) Present numerical results Fig. 3 Phase-locked flow images
(a) Velocity distributions along central axis
(b) Velocity distributions at z/D=6.0
Fig. 4 Comparison of axial velocity profiles
φ=0 and the following ones at every 80 degree of phase are shown. Here, pinch off occurs due to surface tension. Large drops and satellite ones are produced. Each of Fig.6(a)-(e) is at the same perturbation phase of the inlet velocity in Fig.5. In Fig.6, though deformations due to the initial velocity perturbation can be observed, pinch off does not occur because surface tension, which constrict the jet in the axial cross section, does not exist.
Pressure and Velocity Distributions
Figure 7 shows jet radii, pressure distributions and velocity distributions from z/D=0.0 to 8.0 at φ=0 (see Fig.5(a), Fig.6(a)). The solid and dashed lines indicate the results with and without surface tension, respectively. In the upper figure, the jet radii are 5.0mm at z/D=0.0. The radii tend to decrease and the wavelengths of the jet deformations become longer in the downstream field. At the downstream of z/D=4.0, the jet strongly deforms only in the presence of surface tension. Finally, the jet breaks up around z/D=6.0. A satellite drop exists at z/D=7.8. In the absence of surface tension, the deformations of the jet are relatively small.
In the middle figure, distributions of centerline jet pressure are shown. The static pressure p* does not include the hydrostatic pressure ρ
igz, and p*is defined zero at z/D=0.0. The pressure tends to decrease at downstream field with increasing velocity.
At the downstream of z/D=4.0, in the presence of surface tension, it suddenly rises about 30Pa more than in the jet without surface tension. Here, the jet radius is small and surface tension clenches the jet, thus pressure rises inside the jet. At the end of the jet (z/D=7.2), pressure increases again. Inside the satellite drop, pressure increases due to surface tension, while in the absence of surface tension, the pressure continues to decrease.
In the lower figure, distributions of centerline jet velocity are shown. The velocity is normalized by the average inlet velocity. When no surface tension exists, axial velocity is accelerated by gravity force and decelerated by viscous force. Thus, in the downstream field, axial velocity becomes faster and acceleration decreases gradually. When surface
tension exists, however, it works in addition to gravity force and viscous force to cause complex velocity distributions. Until z/D=4.0, the distributions are almost same between the two cases during the radii and the pressures are relatively same. After z/D=4.0, however, centerline velocity changes drastically only in the case with surface tension. At the upstream of z/D=5.7, which is consistent with a maximum pressure, centerline velocity decelerates.
While, at the downstream of z/D=5.7, it sharply accelerates until the pressure reaches a minimum at z/D=6.4. Due to the velocity difference striding over z/D=5.7, the jet radius further shrinks and finally pinch off occurs. At z/D=6.4-7.2, the end of the jet becomes slower with the increase in pressure.
From the above discussion, it is clearly shown that surface tension affects profoundly not only on the jet shapes but also on the pressure and velocity distributions.
(a) (a) (b) (b) (c) (c) (d) (d) (e) (e) (a) (a) (b) (b) (c) (c) (d) (d) (e) (e) Fig. 5 Jet shapes with surface tension Fig. 6 Jet shapes without surface tension ( (a)0deg,(b)80deg,(c)160deg,(d)240deg,(e)320deg) ((a)-(e) are the same times in Fig.5)
Fig. 7 Differences due to presence or absence of
surface tension (upper; jet radius, middle; static
pressure, lower; axial velocity)
acceleration occurs, the tracer color changes from black to white.
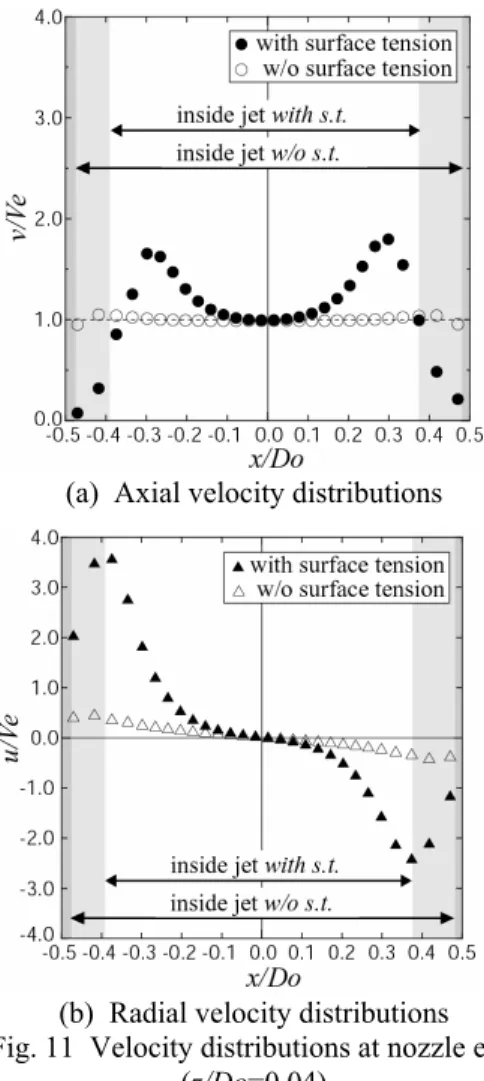
Figure 9 and Fig.10 show tracer distributions inside the liquid jet at z/D=0.0-8.0 in z-x plane. The two figures represent completely different distributions with each other. Hence, surface tension has a profound effect also on inner flow structure of liquid jet. Near the nozzle exit, the black tracer is concave on the centerline in Fig.9(a), while it is flat in Fig.10(a). Since centerline velocity is faster than surrounding part of the jet at the downstream field (see Fig.4(b)), the concave shape near the nozzle exit is recovered to be flattened in Fig.9, while flat shape becomes convex in Fig.10.
The mechanism how the fluid elements inside the jet are constructed at the nozzle exit is discussed.
Figure 11 shows velocity distributions on z-x plane at the nozzle exit in Fig.9(a) and Fig.10(a). Figure 11(a) and Fig.11(b) show axial velocity distributions and radial ones, respectively. In both figures, the velocity is normalized by the average inlet velocity and radial position is normalized by the nozzle diameter.
x/D
o=0.0 in the horizontal axis corresponds to the
Fig.11(a). The tracer shape at the nozzle exit thus becomes flattened.
Fig. 8 Upper: Time variant inlet velocity and tracer’s color, Lower: Time variant inlet acceleration
(a) (b) (c) (d) (e)
(a) (b) (c) (d) (e)
Fig. 9 Inner structures with surface tension Fig. 10 Inner structures without surface tension ( (a)0deg,(b)80deg,(c)160deg,(d)240deg,(e)320deg) ((a)-(e) are the same times in Fig.9)
(a) Axial velocity distributions
(b) Radial velocity distributions
Fig. 11 Velocity distributions at nozzle exit
(z/Do=0.04)
Relation between Inlet Acceleration and Breakup Point
As shown in Fig.9(a), the breakup point almost corresponds to the fluid part where the tracers switch from black to white from downstream. The reason is discussed in this section.
Figure 12 shows time variants of jet diameters at z/D=1.2, 3.5 and 5.5 after their periodical oscillations were observed. No.○ 1 -○ 6 are plotted on the maxima and minima of diameters. The time of each number corresponds to the pinch off phases of 80, 120, 200, 240, 300 and 320 degrees, respectively. The tracer distributions at these phases are shown in Fig.13. In Fig.13, the numbers ○ 1 - ○ 6 are allocated at the corresponding phases and positions of Fig.12. No.○ 1 ,
○ 2 and ○ 6 , which are the minimum diameters in Fig.12, agree with tracers changing from black to white from downstream. On the other hand, No.○ 3 ,
○ 4 and ○ 5 , which are the maximum diameters in Fig.12, agree with tracers changing from white to black. As mentioned previously, the tracer color switches from black to white when the minimum acceleration occurs at the nozzle exit. When the minimum acceleration occurs, the beginning of white tracer does not catch up with the end of black tracer, which was injected just before the white one. As a result, the jet diameter shrinks the most when the acceleration is at minimum. Since surface tension is stronger in cross section of the jet where the diameter is small, the fluid part, which was injected with the minimum acceleration, is constricted at the nozzle exit and also at downstream. Finally, the fluid part breaks up which was injected with the minimum
acceleration, in other words tracer changing from black to white.
Conclusions
To obtain the fundamental knowledge of
atomization, numerical investigations of pinch off was conducted. The conclusions are summarized as follows.
1. Not only the flow images, but also the velocity distributions were compared between numerical results and experimental ones. CIP-LSM can evaluate inertia force, viscous force, gravity and surface tension adequately, and it has potential to simulate and predict pinch off phenomenon.
2. Jet shapes, pressure distributions and velocity distributions were clarified through comparisons between the distinctly different cases with and without surface tension. Pressure distributions induced by surface tension play an important role in determining the flow field of pinch off.
3. Surface tension at the nozzle exit was revealed to induce radial velocity toward central axis and to construct flow structures inside liquid jet. Pinch off was clearly specified to occur at fluid element injected with the minimum acceleration.
Nomenclature
D
onozzle diameter [m]
D net nozzle diameter [m]
e
internal energy [J/kg]
f
perturbation frequency [Hz]
gG
gravity acceleration [m/s
2]
HS
Heaviside function [ - ]
nGs
unit normal vector [ - ]
p
static pressure [Pa]
p
* p-(hydrostatic pressure) [Pa]
qG
heat flux [W/m
2]
t
computational time [s]
u
radial velocity of jet [m/s]
uG
velocity vector [m/s]
v
axial velocity of jet [m/s]
V
eaverage inlet velocity [m/s]
V
oinlet velocity [m/s]
α amplitude of perturbation [ - ]
δ
Sdelta function [1/m]
∆ difference between two fluids [ - ]
ε surface thickness [m]
µ
,
λfirst and second viscosity [Pa・s]
Π
stress tensor [N/m
2]
ρ
density [kg/m
3]
σ
surface tension coefficient [N/m]
Tν
viscous force [N/m
2]
Tσ
surface force [N/m
2] φ phase of pinch off [deg]
ψ Level-Set function [m]
∇
Nabra operator [1/m]
Subscript
i
/
oinjected/ambient fluid Fig. 12 Time variation of jet diameters
φ=320 φ=80 φ=120 φ=200 φ=240 φ=300 z/D =1.2
z/D =3.5 z/D =5.5
φ=320 φ=80 φ=120 φ=200 φ=240 φ=300 z/D =1.2
z/D =3.5 z/D =5.5
φ=320 φ=80 φ=120 φ=200 φ=240 φ=300 z/D =1.2
z/D =3.5 z/D =5.5
φ=320 φ=80 φ=120 φ=200 φ=240 φ=300 z/D =1.2
z/D =3.5 z/D =5.5
Fig. 13 Jet structures at corresponding phases
in Fig.12
surface tension, International Journal of Multiphase Flow, 27, 2001, pp.1735-1752.
2)
Pan,Y. and Suga,K.: Capturing the Pinch-Off of Liquid Jets by the Level Set Method, ASME Journal of Fluids Engineering, 125, 2003, pp.922-927.
3)
Himeno,T., Watanabe,T. and Konno,A.:
Numerical Analysis for Propellant Management in Rocket Tanks, Journal of Propulsion and Power, 21(1), 2005, pp.76-86.
of Computational Physics, 79, 1988, pp.12-49.
7)
Kunugi,T.: Direct Numerical Algorithm for Multiphase Flow with Free Surfaces and Interfaces, Trans. JSME, Ser.B, (in Japanese), 63(609), 1997, pp.88-96.
8)
![Table 1 Physical properties Fluid ρ [kg/m 3 ] µ [Pa・s] σ [mN/m] Water/Glycerin 1140 8.33×10 -3 27.3 Dow Corning 200 970 4.85×10 -3 -](https://thumb-ap.123doks.com/thumbv2/123dokinfo/5359852.401351/2.892.112.417.99.624/table-physical-properties-fluid-water-glycerin-dow-corning.webp)