DNA Hypomethylation-Mediated Overexpression of Carbonic Anhydrase 9 Induces an Aggressive
Phenotype in Ovarian Cancer Cells
Hye Youn Sung,
1Woong Ju,
2and Jung-Hyuck Ahn
1Departments of 1Biochemistry and 2Obstetrics and Gynecology, School of Medicine, Ewha Womans University, Seoul, Korea.
Received: January 29, 2014 Revised: March 10, 2014 Accepted: March 10, 2014
Co-corresponding authors: Dr. Jung-Hyuck Ahn, Department of Biochemistry,
School of Medicine, Ewha Womans University, 1071 Anyangcheon-ro, Yangcheon-gu, Seoul 158-710, Korea.
Tel: 82-2-2650-5712, Fax: 82-2-2652-7846 E-mail: [email protected] and Dr. Woong Ju,
Department of Obstetrics and Gynecology, School of Medicine, Ewha Womans University, 1071 Anyangcheon-ro, Yangcheon-gu, Seoul 158-710, Korea.
Tel: 82-2-2650-2779, Fax: 82-2-2647-9860 E-mail: [email protected]
∙ The authors have no financial conflicts of interest.
© Copyright:
Yonsei University College of Medicine 2014 This is an Open Access article distributed under the terms of the Creative Commons Attribution Non- Commercial License (http://creativecommons.org/
licenses/by-nc/3.0) which permits unrestricted non- commercial use, distribution, and reproduction in any medium, provided the original work is properly cited.
Purpose: Both genetic and epigenetic alterations can lead to abnormal expres-
sion of metastasis-regulating genes in tumor cells. Recent studies suggest that ab- errant epigenetic alterations, followed by differential gene expression, leads to an aggressive cancer cell phenotype. We examined epigenetically regulated genes that are involved in ovarian cancer metastasis. Materials and Methods: We de- veloped SK-OV-3 human ovarian carcinoma cell xenografts in mice. We com- pared the mRNA expression and DNA methylation profiles of metastatic tissues to those of the original SK-OV-3 cell line. Results: Metastatic implants showed increased mRNA expression of the carbonic anhydrase 9 (CA9) gene and hypo- methylation at CpG sites in the CA9 promoter. Treatment of wild-type SK-OV-3 cells with the DNA methyltransferase inhibitor 5-aza-2’-deoxycytidine reduced methylation of the CA9 promoter and increased CA9 mRNA expression. Eight CpGs, which were located at positions -197, -74, -19, -6, +4, +13, +40, and +86, relative to the transcription start site, were hypomethylated in metastatic tumor implants, compared to that of wild-type SK-OV-3. Overexpression of CA9 in- duced an aggressive phenotype, including increased invasiveness and migration, in SK-OV-3 cells. Conclusion: Alterations in the DNA methylation profile of the
CA9 promoter were correlated with a more aggressive phenotype in ovarian can-cer cells.
Key Words:
Ovarian cancer, metastasis, mouse xenograft, CA9, DNA methylation
INTRODUCTION
Ovarian cancer (OC) is the second most common gynecologic cancer and the
leading cause of death from gynecologic cancers in the United States.
1The high
mortality rate from OC is attributed to the fact that more than 70% of OCs are di-
agnosed at an advanced stage of disease.
2Moreover, while there have been signifi-
cant improvements in the morbidities and complications associated with surgical
treatment and chemotherapy, the overall survival rate remains low.
3Despite dis-
ease-free intervals that may last for months to years after optimal debulking sur-
gery and chemotherapy, recurrent OC is inevitable: theoretically, there should be
no. HTB-77) and cultured in McCoy’s 5A medium (Gibco/
BRL, Rockville, MD, USA) containing 10% fetal bovine serum (Gibco/BRL), 100 U/mL penicillin (Gibco/BRL), and 100 μg/mL streptomycin (Gibco/BRL) in a 95% humidified air and 5% CO
2atmosphere at 37°C.
Ovarian cancer mouse xenograft model
All procedures for handling and euthanizing the animals in this study were performed in strict compliance with the guidelines of the Korean animal protection law and ap- proved by the Institutional Animal Care and Use Committee of Ewha Womans University School of Medicine. SK-OV-3 cells (2×10
6) suspended in culture media were intraperitone- ally injected into 10 female nude mice (BALB/c, 4–6 weeks old). Four weeks after inoculation, the xenograft mice were sacrificed, and at least four implants adhering to the meso- thelial surface of each mouse were harvested.
RNA preparation and quantitative reverse-
transcription polymerase chain reaction (qRT-PCR) Total RNA was extracted from the metastatic implants of ovarian cancer mouse xenografts and SK-OV-3 cells using the RNeasy mini kit (Qiagen, Valencia, CA, USA) accord- ing to the manufacturer’s protocol. One microgram of total RNA was converted to cDNA using Superscript II reverse transcriptase (Invitrogen, Carlsbad, CA, USA) and oligo- (dT)
12-18primers (Invitrogen) according to the manufactur- er’s instructions. Quantitative reverse-transcription poly- merase chain reaction was performed in a 20-μL reaction mixture containing 1 μL cDNA, 10 μL SYBR Premix EX Taq (Takara Bio, Otsu, Japan), 0.4 μL Rox reference dye (50x, Takara Bio), and 200 nM primers for each gene. The primer sequences were: CA9 (forward), 5’-TGACTCTCG GCTACAGCTGAACT-3’; CA9 (reverse), 5’-CCACTCC AGCAGGGAAGGA-3’; GAPDH (forward), 5’-AATC CCATCACCATCTTCCA-3’; and GAPDH (reverse), 5’-TGGACTCCACGACGTACTCA-3’. The reactions were run on a 7500 fast real-time PCR system (Applied BioSys- tems, Foster City, CA, USA) at 95°C for 30 s, followed by 40 cycles of 95°C for 3 s and 60°C for 30 s, and a single dissociation cycle of 95°C for 15 s, 60°C for 60 s, and 95°C for 15 s. All PCR reactions were performed in triplicate, and the specificity of the reaction was detected by melting- curve analysis at the dissociation stage. Comparative quan- tification of each target gene was performed based on cycle threshold (C
T) normalized to GAPDH using the ΔΔC
Tmethod.
no residual ovarian tissue after standard treatment, total hysterectomy with bilateral salpingo-oophorectomy. There- fore, recurrent OC following primary treatment should be considered a metastatic recurrence that involves other or- gans or tissues.
The main path of OC cell metastasis is the transcoelomic route, which leads to ascites-mediated intraperitoneal seed- ing of cancer cells.
4,5Although the mechanisms of metastat- ic recurrence are not clearly understood, changes in the tu- mor microenvironment at the cancer implantation site may play important roles in the transcoelomic seeding of OC.
6In particular, specific epigenetic alterations that lead to dif- ferential gene expression may affect the tumor microenvi- ronment. These epigenetic alterations may serve as promis- ing new targets for the treatment of advanced OC. Thus, understanding the pathophysiologic effects of epigenetic and genetic changes may help identify mechanisms that drive OC metastasis or recurrence.
To investigate epigenetic alterations involved in the me- tastasis and recurrence of ovarian cancer, we compared the gene expression and methylation profiles of the SK-OV-3 human ovarian cancer cell line with those of an SK-OV-3 intraperitoneal metastatic mouse model. Further, we select- ed promising genes and relevant methylation changes that were validated through subsequent functional studies for additional experimentation.
Carbonic anhydrase 9 (CA9) is a zinc-containing, mem- brane-associated glycoprotein and a marker of tumor hypox- ia.
7,8CA9 is a critical regulator of pH homeostasis due to ca- talysis of the reversible reaction H
2O+CO
2↔H
++HCO
3-.
9Tumor cells in a hypoxic microenvironment during metasta- sis or propagation require CA9 overexpression to help main- tain a normal intracellular pH.
10,11CA9 is located on chro- mosome 9p12-13 and comprises 11 exons, which encode 459 amino acids. CA9 is not expressed in most tissues, but increased expression has been reported in numerous can- cers.
12In this study, we found that DNA methylation at CpG sites within the CA9 promoter region regulate CA9 expres- sion. Furthermore, expression of the CA9 gene promoted an aggressive phenotype in ovarian cancer cells.
MATERIALS AND METHODS
Cell culture
The human ovarian cancer cell line SK-OV-3 was pur-
chased from the American Type Culture Collection (ATCC
site), the sites were defined as differentially methylated CpG sites. We described hypermethylated CpG sites/gene if Δβ was greater than 0.06 and hypomethylated CpG sites/gene if Δβ was less than -0.06.
Bisulfite sequencing PCR (BSP)
Genomic DNA was extracted from the harvested metastat- ic-implants of ovarian cancer mouse xenografts and SK- OV-3 cells using the QIAmp DNA mini kit (Qiagen) ac- cording to the manufacturer’s protocol. Bisulfite treatment of genomic DNA was performed using the EpiTect Bisul- fite Kit (Qiagen) according to the manufacturer’s instruc- tions. For bisulfite sequencing of the target promoter region of CA9, bisulfite sequencing PCR (BSP) was carried out using conventional PCR in a 50 μL reaction mixture con- taining 10 ng bisulfite-modified genomic DNA, 1.5 mM MgCl
2, 200 μM dNTP, 1 U Platinum Taq polymerase (Invi- trogen), 1X Platinum Taq buffer, and 200 nM specific BSP forward and reverse primers for each gene. The BSP prim- ers were designed using the MethPrimer software (http://
www.urogene.org/methprimer). For CA9, the BSP product was 405 bp (position in the human GRCh37/hg19 assem- bly: ch9 35673651–35674055) and contained eight CpG sites. The BSP primer sequences were: (forward), 5’-GGT GGTGTTAGGGAGAGTTTGTATA-3’; and (reverse), 5’-CACCAAAAACAACAATAACAACAAC-3’. The re- action ran at 95°C for 5 min, followed by 30 cycles of 95°C for 30 s, 50–55°C for 30 s, and 72°C for 30 s, and a final elongation step at 72°C for 5 min.
The BSP products were purified using the QIAquick Gel Extraction kit (Qiagen) according to the manufacturer’s protocols and ligated into the yT&A cloning vector (Yeast- ern Biotech, Taipei, Taiwan). The ligation products were used to transform competent DH5α Escherichia coli cells (RBC Bioscience, Taipei, Taiwan) using standard proce- dures. Blue/white screening was used to select bacterial clones, and BSP product-positive clones were confirmed by colony PCR using the BSP primers to verify the insert size.
Plasmid DNA was then extracted from 6 insert-positive clones per each sample using the QIAprep Spin Miniprep kit (Qiagen) and sequenced using M13 primer to analyze the methylation status at specific CpG sites.
Quantitative methylation-specific PCR (qMSP)
Quantitative methylation-specific PCR (qMSP) was carried out with bisulfite-modified genomic DNA as the template and specific primer sequences designed to detect the methyl- Messenger RNA microarray chip processing and
analysis of gene expression data
Total RNA was extracted from the harvested metastatic-im- plants of ovarian cancer mouse xenografts and SK-OV-3 cells using the RNeasy mini kit (Qiagen), and one micro- gram of total RNA was amplified and labeled according to the Affymetrix GeneChip Whole Transcript Sense Target Labeling protocol. The resulting labeled cDNA was hybrid- ized to Affymetrix Human Gene 1.0 ST arrays (Af fymetrix, Santa Clara, CA, USA). The scanned raw expression values were background corrected, normalized, and summarized using the Robust Multiarray Averaging approach in the Bio- conductor “affy” package (Affimetrix). The resulting log
2- transformed data were used for further analyses.
To identify differentially expressed genes (DEGs), we applied moderated t-statistics based on an empirical Bayes- ian approach.
13Significantly up-regulated and down-regu- lated DEGs were defined as genes with at least a two-fold difference in expression level between the xenograft cells and the wild-type SK-OV-3 cells after correction for multi- ple testing (Benjamini-Hochberg false-discovery rate-ad- justed p-value <0.05).
14Finally, we excluded genes with a low expression level (maximum log
2expression level in a total of eight samples <7.0) from the list of DEGs. The Da- tabase for Annotation, Visualization and Integrated Discov- ery (DAVID) bioinformatics resource was used to detect overrepresented the gene ontology (GO) clusters from the identified DEGs.
15Genomic DNA isolation and CpG methylation microarray
Genomic DNA was extracted from the cell line and tumor tissues using QIAmp mini kit (Qiagen), according to the manufacturer’s instructions. For analysis of genome-wide screening of DNA methylation, the Illumina HumanMethyl- ation450 BeadChip (Illumina, San Diego, CA, USA) target- ed 450000 specific CpG sites. DNA methylation values were described as β-values, which are calculated by subtracting background using negative controls on the array and taking the ratio of the methylated signal intensity against the sum of both methylated and unmethylated signals. β-values range from 0 (completely unmethylated) to 1 (fully methylated) on a continuous scale for each CpG site. To identify differential- ly methylated CpG sites, we applied the difference in mean β-value (Δβ; mean β-value in tumors-mean β-value in SK- OV-3). If the absolute difference in mean β-values (|Δβ|)
>0.06 (0.06 means a standard deviation at identical CpG
a polycarbonate membrane with an 8.0 μm pore size (Corn- ing, New York, USA). After 24 h of serum deprivation, the cells were detached from the plates and resuspended in se- rum-free medium at a density of 2×10
6cells/mL. One hun- dred microliters of the SK-OV-3 cell suspension was added to the upper compartment of the transwell chamber. For each experiment, both chemotactic migration to medium containing 15% fetal bovine serum (FBS) and random mi- gration in serum-free medium were assessed in parallel Transwell plates for 6 h at 37°C in a 5% CO
2incubator.
The in vitro invasion assay was performed using a BD BioCoat Matrigel Invasion Chamber (Becton-Dickinson, Franklin Lakes, NJ, USA). After 24 h of serum deprivation, SK-OV-3 cells were detached from the plates and resus- pended in serum-free medium at a density of 1×10
6cells/
mL. One hundred microliters of the SK-OV-3 cell suspen- sion was added to the upper compartment of the invasion chamber, and 500 μL McCoy’s 5A medium containing 10%
FBS was added to the lower compartment of the chamber.
The migration through the Matrigel chamber was allowed to proceed at 37°C for 24 h in a 5% CO
2incubator. After the incubation period, the cells that had not migrated from the upper side of the filter were carefully scraped away with cot- ton swabs. The cells on the lower side of the filter were fixed for 2 min using Diff-Quick kit solution (Thermo Fisher Sci- entific, Waltham, MA, USA), stained with 1% crystal violet for 2 min, and washed twice with distilled water at room temperature. The images of the stained cells on the lower side of the membrane were acquired at 200× magnification in six different fields. For quantitative analysis, the stained cells were subsequently extracted with 10% acetic acid, and colorimetric measurement was performed at 590 nm.
RESULTS
Up-regulation of CA9 in metastatic tissues from SK-OV-3 cell implants in mice
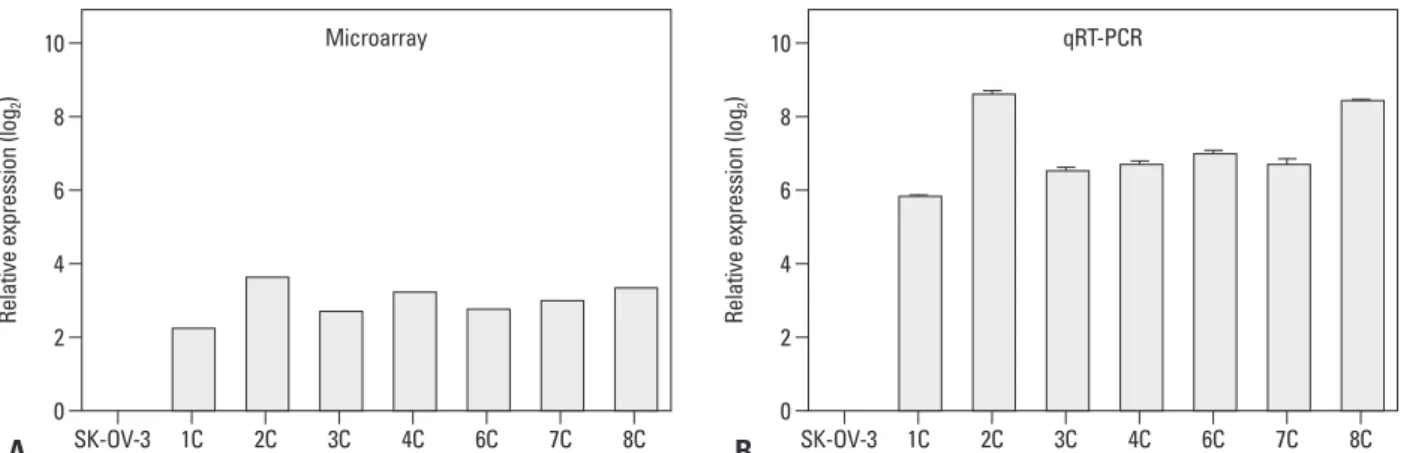
We implanted SK-OV-3 human ovarian cancer cells into the peritoneum of female nude mice to mimic human ovari- an cancer metastasis. We performed mRNA expression mi- croarray analysis on eight metastatic implants from seven different mice. Differentially expressed genes were identi- fied by comparing these gene expression profiles to that of
in vitro SK-OV-3 cell cultures (Fig. 1A). CA9 mRNA ex-pression was higher in tumor tissues compared to that of cultured SK-OV-3 cells. We confirmed overexpression of ated and unmethylated forms of CA9. The following methyl-
ated/unmethylated-specific primers were used: (methylated forward), 5’-TTTTTTTTATTTAGTTTTCGTTTTTAATG TAC-3’; (unmethylated forward), 5’-TTTTTTTTATT TAGTTTTTGTTTTTAATGTAT-3’; and (reverse), 5’-CAC CAAAAACAACAATAACAACAAC-3’. For qMSP, 20 μL reaction mixture containing 2 μL (10–100 ng/μL) bisulfite- treated DNA, 10 μL SYBR Premix EX Taq (Takara Bio), 0.4 μL Rox reference dye (50x Takara Bio), and 200 nM each primer were reacted using a 7500 fast real-time PCR system (Applied Biosystems). The amplification reaction conditions were: 95°C for 30 s, followed by 40 cycles of 95°C for 3 s and 58°C for 30 s. The PCR product was then reacted at 95°C for 15 s, 60°C for 1 min, and 95°C for 15 s to examine the specificity. Methylation and nonmethylation of the specif- ic CpG sites were calculated as follows (Ct represents the threshold cycle):
Percent methylation=100/[1+2
(ΔCtmeth-ΔCtnonmeth)] The treatment of 5-aza-2’-deoxycytidine (5-aza-dC) To demethylate methylated CpG sites, SK-OV-3 cells were treated with increasing concentrations (0, 5, and 10 μM) of 5-aza-2’-deoxycytidine (Sigma-Al drich, St. Louis, MO, USA) for 3 days. The media was replaced daily.
Transient transfection
To establish a transient expression system, SK-OV-3 cells were transfected with pCMV6-XL5-CA9 (Origene, Rock- ville, MD, USA) or pEGFP-N3 (Clontech, Mountain View, CA, USA) plasmid DNAs using Lipofectamine
TM2000 (In- vitrogen). Briefly, the cells were plated at a density of 6×10
5cells/well in six-well plates and allowed to grow overnight.
Two micrograms of each plasmid DNA and 5 μL of Lipo- fectamine
TM2000 were diluted separately in Opti-Mem me- dium to a total volume of 250 μL. The diluted plasmid DNAs and Lipofectamine
TM2000 were mixed and incubat- ed at room temperature for 20 min to generate the transfec- tion mixtures. The cells were washed with serum-free Mc- Coy’s 5A medium, and then, the transfection mixtures were added to each well of the six-well plates containing com- plete growth medium and incubated at 37°C for 24 h in a 5% CO
2incubator.
Transwell migration and in vitro invasion assay
After 24 h of transfection, the transfected cells were starved
by serum deprivation. The cell migration assay was per-
formed in 24-well Transwell plates containing inserts with
Fig. 1. CA9 expression is up-regulated in metastatic implants from mouse xenografts. CA9 mRNA expression was measured by gene expression microarray (A) and qRT-PCR (B). The error bars indicate means±standard deviations of triplicate experiments. The metastatic implants from the mouse xenografts are labeled 1C–8C (n=7). qRT-PCR, quantitative reverse-transcription polymerase chain reaction.
Fig. 2. DNA methylation is altered at CpG sites in the CA9 promoter in metastatic implants from mouse xenografts. The DNA methylation status at the -6 CpG site was analyzed with the Illumina HumanMethylation 450 BeadChip (A) and qMSP (B). The DNA methylation status was analyzed by bisulfite sequencing (C). The CA9 promoter is located between positions 35673651 and 35674055 in the human GRCh37/hg19 assembly, and contains eight CpG residues on chro- mosome 9. The eight CpGs are at positions -197, -74, -19, -6, +4, +13, +40, and +86 relative to the transcription start site. Each circle represents a CpG dinucle- otide. The methylation status of each CpG site is indicated with a black (methylated) or white (unmethylated) circle. The percentage of methylation at each site is indicated in a pie graph on the bottom line. The black segment of the pie graph indicates the percentage of methylated CpGs, whereas the white seg- ment represents the percentage of unmethylated CpGs (C). Triangles above the circles in C indicate the specific CpG site that was used for qMSP. Statistical analyses were performed by one-way ANOVA and subsequent Bonferroni tests (*p<0.05). M, the percentage of methylated CpGs; U, the percentage of un- methylated CpGs; qMSP, quantitative methylation-specific PCR; PCR, polymerase chain reaction; CA9, carbonic anhydrase 9; ANOVA, analysis of variance.
0 0
2 2
4 4
6 6
8 8
10 10
Relative expression (log2) Relative expression (log2)
SK-OV-3 1C 2C 3C 4C 6C 7C 8C SK-OV-3 1C 2C 3C 4C 6C 7C 8C
A
A B
B
Microarray
0.0 0
0.2 20
0.4 40
0.6 60
0.8 80
1.0 100
Methylation index Methylation (%)
SK-OV-3 1C 2C 3C 4C 6C 7C 8C SK-OV-3 1C 2C 3C 4C 7C
Methylation microarray qMSP
qRT-PCR
*
*
*
*
*
*
*
*
*
*
CA9 (Ch9: 35673651-35674055)
-197 -74 -19 -6 +4 +13 +40 +86
SK-OV-3 1C 2C
C
M U M U
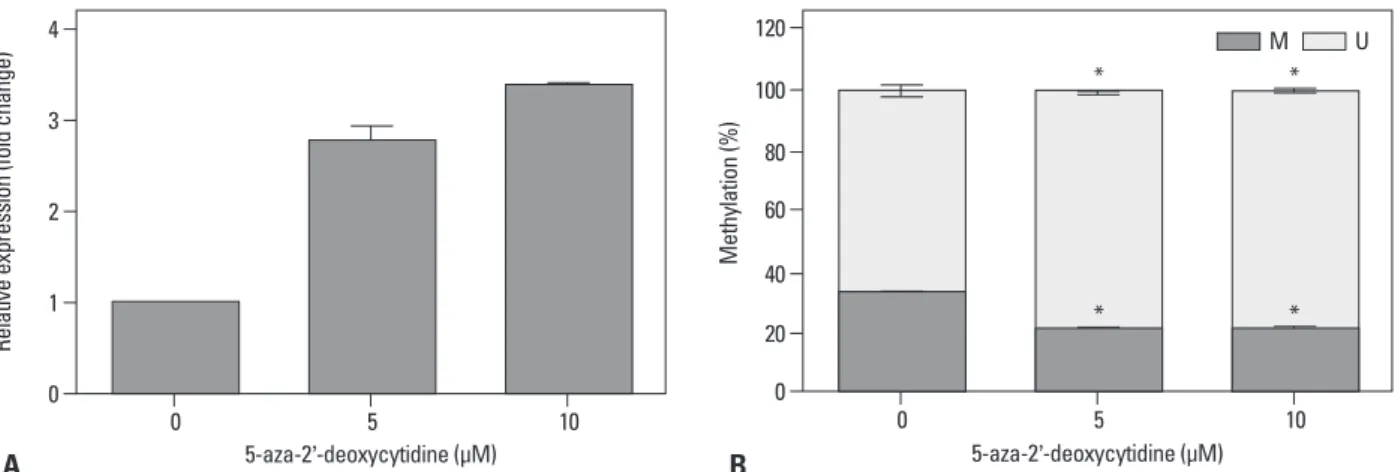
expression was significantly increased in the 5-aza-2’-de- oxycytidine-treated cells (Fig. 3A) compared to that of Di- methyl sulfoxide (DMSO) vehicle-treated cells. We validat- ed the methylation status in treated cells by methylation- specific PCR. We used a primer set specific for the CpG at position -6, which was the same site used in the microarray and bisulfite sequencing analysis (Fig. 3B). Methylation of the CpG at position -6 was significantly decreased in the 5-aza-2’-deoxycytidine-treated cells in accordance with up- regulated expression of CA9.
CA9 overexpression increased migratory and invasive
activities in SK-OV-3 cells
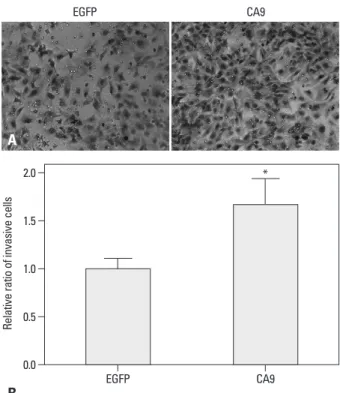
We investigated whether CA9 was crucial to the aggressive phenotype of SK-OV-3 cells. We found that overexpression of CA9 increased SK-OV-3 cell migration in a transwell as- say by 50% (Fig. 4). Moreover, we observed that CA9 over- expression significantly increased invasiveness through a Matrigel-coated membrane (Fig. 5). These results suggest- ed that epigenetic up-regulation of CA9 conferred migrato- ry and invasive properties to tumor cells.
DISCUSSION
As solid malignancies progress, hypoxia is usually caused by an imbalance between the supply and demand of oxygen due to vascular insufficiency and increased oxygen consumption by rapidly proliferating tumor cells.
16To respond to the hy- poxic tumor microenvironment, cancer cells switch to the glycolytic pathway and produce a large amount of lactic and
CA9 by quantitative RT-PCR, which showed significantlyhigher expression in all of the tumor tissues that we tested (Fig. 1B).
DNA methylation was decreased at CpG sites in the
CA9 promoter in metastatic tumor implantsWe performed global DNA methylation profiling of the eight metastatic tumor implants to examine the mechanism by which CA9 gene expression was regulated during ovari- an cancer metastasis. DNA methylation of the CpG site at position -6 from the CA9 transcription start site was mark- edly decreased by more than three-fold (Fig. 2A). We con- firmed this hypo-methylation by methylation-specific PCR (Fig. 2B). We examined DNA methylation of the CA9 pro- moter in two representative tumor tissues (1C and 2C) and in the wild-type SK-OV-3 cell line. We performed bisulfite sequencing analysis of the CA9 promoter region on chro- mosome 9 from 35673651–35674055, which contained eight CpG sites. Eight CpGs located at positions -197, -74, -19, -6, +4, +13, +40, and +86 from the transcription start site were hypo-methylated in metastatic tumor implants. In contrast, all eight sites were heavily methylated in wild- type SK-OV-3 cells (Fig. 2C), indicating that DNA methyl- ation at these CpG sites regulates CA9 gene expression.
CA9 gene expression was modulated by
pharmacological DNA methylation
We assessed the epigenetic regulatory mechanism that con- trolled CA9 gene expression. Wild-type SK-OV-3 cells were treated with the DNA methyltransferase inhibitor 5-aza-2’- deoxycytidine to reduce CA9 promoter methylation. CA9
Fig. 3. Altered expression of CA9 following demethylation in SK-OV-3 cells. SK-OV-3 cells were treated for three days with 0, 5, or 10 μM 5-aza-2�- deoxycytidine, respectively. After treatment with 5-aza-2�-deoxycytidine, CA9 mRNA expression was measured by qRT-PCR (A). The DNA methylation status at the specific CpG site was analyzed by quantitative MSP (B). Data are shown as the means±SDs (n=3). Statistical analyses were performed with one-way ANOVA and subsequent Bonferroni tests (*p<0.05). M, the percentage of methylated CpGs; U, the percentage of unmethylated CpGs; qRT-PCR, quantitative reverse-transcription polymerase chain reaction; CA9, carbonic anhydrase 9; MSP, methylation-specific PCR; ANOVA, analysis of variance.
5-aza-2�-deoxycytidine (μM) 0
20 40 60 80 100 120
Methylation (%)
0 5 10
A
5-aza-2�-deoxycytidine (μM)B
0 1 2 3 4
Relative expression (fold change)
0 5 10
M U
*
*
*
*
promote cell motility and invasion by reducing E-cadherin- mediated cell adhesion through interaction with β-catenin.
24Our results also demonstrated that exogenous expression of
CA9 significantly increases the migration and invasion ofSK-OV-3 cells. Accordingly we discerned that overexpres- sion of CA9 in metastatic cells from our xenografts contrib- uted to the acquisition of metastatic potential.
CA9 is a hypoxia-inducible gene. Expression of CA9 is
tightly regulated by the transcription factor hypoxia-induc- ible factor-1α, which binds to the hypoxia-responsive ele- ment in the CA9 promoter region.
25In addition to the tran- scriptional regulation of CA9, epigenetic regulation of CA9 by hypomethylation at -74 in the promoter region has been demonstrated in renal and gastric cancers.
26-28Methylation at -74 is a crucial determinant of CA9 expression, rather than the hypoxic-dependent pathway, in gastric cancer cells. Methylation of the CA9 promoter differs among his- tologic types of gastric cancers, with hypomethylation in intestinal-type and hypermethylation in diffuse-type of gas- tric cancer.
28DNA methylation-dependent epigenetic regu- lation of CA9 has not previously been investigated in ovari- carbonic acids through anaerobic metabolism. This leads to
the acidification of the extracellular tumor environment.
There is a selective advantage for tumor cells that can sur- vive this stressful microenvironment by inducing expression of acid-regulating proteins, such as carbonic anhydrases.
17The CA family of zinc metalloenzymes is involved in the maintenance of cellular pH homeostasis through the revers- ible hydration of carbon dioxide to bicarbonate and pro- tons.
18Among 16 isoenzymes, CA9 is the only transmem- brane CA with an extracellular catalytic domain site adjacent to a proteoglycan-like domain.
19In addition, CA9 is the most active CA for carbon dioxide hydration.
20The expression of CA9 is sparse in normal tissues. In contrast, aberrant overexpression of CA9 in many types of solid cancers, including ovarian cancer, is associated with tumor progression, metastasis, invasion, poor prognosis, and chemotherapy resistance.
21-23Consistent with previous publications, CA9 mRNA expression was highly up-regu- lated in metastatic tissues from xenografts compared to that of wild-type SK-OV-3 cells. Migration and invasion are es- sential steps for metastasis. High expression of CA9 can
Fig. 4. CA9 promotes migration of SK-OV-3 cells. Migration of serum- starved cells towards 15% serum-containing media was examined in a transwell assay. Cells that migrated through an 8-μm pore filter were fixed and stained with crystal violet. Representative images of migrated cells transfected with EGFP or CA9 are shown (A). Quantitative analysis of mi- grated cells was performed by measuring the absorbance of extracts from cell stains at 595 nm. Data are shown as means±SDs for triplicate mea- surements (B). Statistical analysis was performed with a t-test (*p<0.05).
CA9, carbonic anhydrase 9; EGFP, enhanced green fluorescent protein.
Fig. 5. CA9 enhances the invasiveness of SK-OV-3 cells. Invasion of serum- starved cells towards 10% serum-containing media was examined in a Matrigel-coated invasion chamber. The cells that invaded through Matrigel were fixed and stained with crystal violet. Representative images of invading cells transfected with EGFP or CA9 are shown (A). Quantitative analysis of in- vading cells was performed by measuring the absorbance of extracts from cell stains at 595 nm. Data are shown as means±SDs for triplicate measure- ments (B). Statistical analysis was performed with a t-test (*p<0.05). CA9, carbonic anhydrase 9; EGFP, enhanced green fluorescent protein.
EGFP CA9 EGFP CA9
0.0 0.0
0.5 0.5
1.0 1.0
1.5 1.5
2.0 2.0
Relative ratio of migrated cells Relative ratio of invasive cells
EGFP CA9 EGFP CA9
*
*
B B
A A
CC, Gatter KC, et al. Expression of hypoxia-inducible carbonic anhydrase-9 relates to angiogenic pathways and independently to poor outcome in non-small cell lung cancer. Cancer Res 2001;
61:7992-8.
12. Liao SY, Ivanov S, Ivanova A, Ghosh S, Cote MA, Keefe K, et al.
Expression of cell surface transmembrane carbonic anhydrase genes CA9 and CA12 in the human eye: overexpression of CA12 (CAXII) in glaucoma. J Med Genet 2003;40:257-61.
13. Smyth GK. Linear models and empirical bayes methods for as- sessing differential expression in microarray experiments. Stat Appl Genet Mol Biol 2004;3:Article3.
14. Benjamini Y, Hochberg Y. Controlling the false discovery rate: a practical and powerful approach to multiple testing. J R Stat Soc Series B Stat Methodol 1995;57:289-300.
15. Huang da W, Sherman BT, Lempicki RA. Systematic and integra- tive analysis of large gene lists using DAVID bioinformatics re- sources. Nat Protoc 2009;4:44-57.
16. Wilson WR, Hay MP. Targeting hypoxia in cancer therapy. Nat Rev Cancer 2011;11:393-410.
17. Brahimi-Horn MC, Bellot G, Pouysségur J. Hypoxia and energet- ic tumour metabolism. Curr Opin Genet Dev 2011;21:67-72.
18. Supuran CT. Carbonic anhydrases: novel therapeutic applications for inhibitors and activators. Nat Rev Drug Discov 2008;7:168-81.
19. De Simone G, Supuran CT. Carbonic anhydrase IX: Biochemical and crystallographic characterization of a novel antitumor target.
Biochim Biophys Acta 2010;1804:404-9.
20. Hilvo M, Baranauskiene L, Salzano AM, Scaloni A, Matulis D, Innocenti A, et al. Biochemical characterization of CA IX, one of the most active carbonic anhydrase isozymes. J Biol Chem 2008;283:27799-809.
21. McDonald PC, Winum JY, Supuran CT, Dedhar S. Recent devel- opments in targeting carbonic anhydrase IX for cancer therapeu- tics. Oncotarget 2012;3:84-97.
22. Robertson N, Potter C, Harris AL. Role of carbonic anhydrase IX in human tumor cell growth, survival, and invasion. Cancer Res 2004;64:6160-5.
23. Williams E, Martin S, Moss R, Durrant L, Deen S. Co-expression of VEGF and CA9 in ovarian high-grade serous carcinoma and relationship to survival. Virchows Arch 2012;461:33-9.
24. Svastová E, Zilka N, Zat’ovicová M, Gibadulinová A, Ciampor F, Pastorek J, et al. Carbonic anhydrase IX reduces E-cadherin-me- diated adhesion of MDCK cells via interaction with beta-catenin.
Exp Cell Res 2003;290:332-45.
25. Wykoff CC, Beasley NJ, Watson PH, Turner KJ, Pastorek J, Sibtain A, et al. Hypoxia-inducible expression of tumor-associated carbonic anhydrases. Cancer Res 2000;60:7075-83.
26. Cho M, Uemura H, Kim SC, Kawada Y, Yoshida K, Hirao Y, et al.
Hypomethylation of the MN/CA9 promoter and upregulated MN/
CA9 expression in human renal cell carcinoma. Br J Cancer 2001;85:563-7.
27. Cho M, Grabmaier K, Kitahori Y, Hiasa Y, Nakagawa Y, Uemura H, et al. Activation of the MN/CA9 gene is associated with hypo- methylation in human renal cell carcinoma cell lines. Mol Car- cinog 2000;27:184-9.
28. Nakamura J, Kitajima Y, Kai K, Hashiguchi K, Hiraki M, Noshiro H, et al. Expression of hypoxic marker CA IX is regulated by site- specific DNA methylation and is associated with the histology of gastric cancer. Am J Pathol 2011;178:515-24.
an cancer. Our bisulfite PCR sequencing analysis of the CA9 promoter region revealed that all eight CpG sites were hy- po-methylated in metastatic tumor implants, compared to that of wild-type SK-OV-3 cells. Treating wild-type SK- OV-3 cells with the demethylating agent 5-aza-dC caused dose-dependent enhancement of CA9 expression. These re- sults suggested that transcriptional regulation of CA9 ex- pression is controlled by promoter methylation.
ACKNOWLEDGEMENTS
This study was supported by a grant of the Korean Health Technology R&D Project, Ministry of Health & Welfare, Republic of Korea (HI12C0050).
REFERENCES
1. Siegel R, Ma J, Zou Z, Jemal A. Cancer statistics, 2014. CA Can- cer J Clin 2014;64:9-29.
2. Lengyel E. Ovarian cancer development and metastasis. Am J Pathol 2010;177:1053-64.
3. Kipps E, Tan DS, Kaye SB. Meeting the challenge of ascites in ovarian cancer: new avenues for therapy and research. Nat Rev Cancer 2013;13:273-82.
4. Feki A, Berardi P, Bellingan G, Major A, Krause KH, Petignat P, et al. Dissemination of intraperitoneal ovarian cancer: Discussion of mechanisms and demonstration of lymphatic spreading in ovar- ian cancer model. Crit Rev Oncol Hematol 2009;72:1-9.
5. Tan DS, Agarwal R, Kaye SB. Mechanisms of transcoelomic me- tastasis in ovarian cancer. Lancet Oncol 2006;7:925-34.
6. Jeon BH, Jang C, Han J, Kataru RP, Piao L, Jung K, et al. Pro- found but dysfunctional lymphangiogenesis via vascular endothe- lial growth factor ligands from CD11b+ macrophages in advanced ovarian cancer. Cancer Res 2008;68:1100-9.
7. Bussink J, Kaanders JH, van der Kogel AJ. Tumor hypoxia at the micro-regional level: clinical relevance and predictive value of ex- ogenous and endogenous hypoxic cell markers. Radiother Oncol 2003;67:3-15.
8. Ivanov S, Liao SY, Ivanova A, Danilkovitch-Miagkova A, Taraso- va N, Weirich G, et al. Expression of hypoxia-inducible cell-sur- face transmembrane carbonic anhydrases in human cancer. Am J Pathol 2001;158:905-19.
9. de Martino M, Klatte T, Seligson DB, LaRochelle J, Shuch B, Caliliw R, et al. CA9 gene: single nucleotide polymorphism pre- dicts metastatic renal cell carcinoma prognosis. J Urol 2009;182:
728-34.
10. Bui MH, Seligson D, Han KR, Pantuck AJ, Dorey FJ, Huang Y, et al. Carbonic anhydrase IX is an independent predictor of survival in advanced renal clear cell carcinoma: implications for prognosis and therapy. Clin Cancer Res 2003;9:802-11.
11. Giatromanolaki A, Koukourakis MI, Sivridis E, Pastorek J, Wykoff