P Perfusion Imaging of the Brain UsingZ-Score and Dynamic Images Obtained bySubtracting Images from before and afterContrast Injection
6
0
0
전체 글
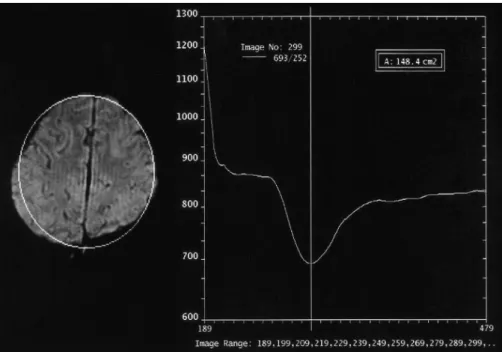
(2) Choi et al.. due to their poor spatial resolution, these modalities are unsatisfactory for clinical use. Perfusion studies using MRI has increased recently. The perfusion images can be obtained using arterial spinlabeling without the need for the injection of a contrast medium (4, 5). However, this method has some clinical limitations. The most frequently used method of perfusion MRI, which measures various parameters, such as cerebral blood flow (CBF), cerebral blood volume (CBV), and mean transit time (MTT), involves the post-processing of a susceptibility-contrast echo-planar image (EPI) after injecting a contrast medium (6). This method provides good temporal and spatial resolution, shows real-time perfusion patterns, and provides information on the collateral circulation, even though it has limitations that depend on the modality and software programs used. The Z-score is the ratio of the difference between the mean values of the activated and non-activated signals to the standard deviation of the signal. Therefore, it can be used as a threshold value to illustrate the difference between the signal intensity before and after the tasks in functional MRI (fMRI) (7, 8). In addition, it can be used to observe the changes in the signal intensity with the degree of perfusion throughout the brain, if the pre- and postcontrast images are processed using a low Z-score threshold. This study assessed the feasibility of perfusion imaging of the brain using the Z-score and dynamic images obtained by subtracting the images taken before from those taken after contrast medium injection.. MATERIALS AND METHODS Initially, 105 cases with different brain conditions (84 suspicious ischemic-infarctions, 13 post-trauma syndromes, 5 Moya-moyas and 3 brain tumors) were studied. This report present one patient with a normal MRI, and 4 patients each with Moya-moya, middle cerebral artery (MCA) occlusion, post-trauma syndrome, and a metastatic brain tumor, respectively. A susceptibility-contrast EPI was acquired after a routine MRI (Magnetom Vision, Siemens Medical Systems, Erlangen, Germany) after a rapid manual injection of 0.1 mmol/kg Gd-DTPA. The parameters used for the EPI sequences are as follows: TR/TE: 0.8/29 msec, slice thickness: 6 mm, slice numbers: 10 per study, matrix: 128 128, FOV: 215 215 mm, acquisition: one, scan time: 1.32 sec per study, study numbers: 30, and total scan time: 40 sec. The standard program with the Magnetom Vision (VB33D, Numaris Application Manual) was used to postprocess the perfusion images. The inflow and washout patterns were observed from the time-signal intensity curve of the region of interest (ROI) in 30 serial scans (Fig. 1). Repeated Z-score images of the peak and late phases were produced using the threshold Z-score values between 1.4 and 2.0 for four or five studies of the pre-contrast, peak, and late phases. The best image was selected as the perfusion image. The dynamic images were produced by subtracting the sequential post-contrast images from the pre-contrast image, and rearranging the levels in the same order. The sequential signal changes in the brain Fig. 1. The time-signal intensity curve (right) shows markedly decreased signal intensity during the peak arrival of the contrast agent, followed by the recovery of the signal intensity according to the washout of the contrast media as a function of time at the region of interest (left).. 144. Korean J Radiol 5(3), September 2004.
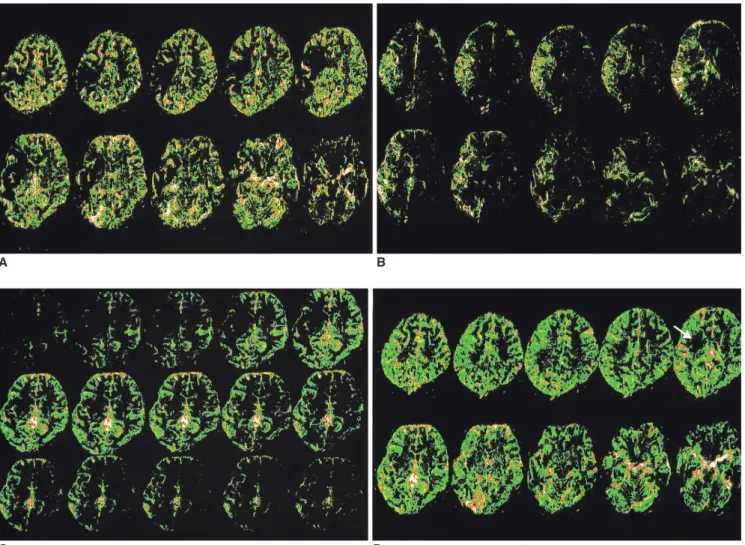
(3) Brain Perfusion Imaging Using Z-Score and Dynamic Subtracting Technique. parenchyma were observed as a function of time, and the image were determined to be a perfusion image in the case of showing sequential signal changes. The dynamic changes in perfusion were observed on a video display. In addition, color mapping was performed on a personal computer using the pseudocolor mapping method in the view software (Medison, Seoul, Korea). The reconstruction times for both methods were approximately 10 min each.. RESULTS Perfusion images could be obtained easily using the Zscore, and the subtraction dynamic methods from the susceptibility contrast EPI before and after the contrast injection in all 105 cases, and one case from each different. A. brain condition showing typical signal changes was selected. A 10-year-old girl with a headache showed no abnormal findings on the routine MRI. The peak Z-score image showed good perfusion in the cortex, and the late Z-score image showed that the cortical perfusion had washed-out with perfusion in the deep white matter, periventricular area, and cortical veins. The subtraction dynamic images revealed an even wash-in and washout of the contrast medium from the cortex to the deep white matter through the peak to late phases with no background noise. A 26-year-old female with an arrhythmia showed a right MCA occlusion on magnetic resonance angiography (MRA) and high signal intensity in the right basal ganglia on the diffusion-weighted images. The peak Z-score image. B. C D Fig. 2. A 26-year-old female with arrhythmia showed a right middle cerebral artery occlusion on the magnetic resonance angiography and high signal intensity at the right basal ganglia on the diffusion weighted image (not shown) 3 hours after developing a left hemiplegia. A. The peak Z-score image shows perfusion defects at the right posterior frontal, temporal area and the basal ganglia. B. The late Z-score image shows delayed perfusion at the perfusion defect areas in A. C. The subtraction dynamic image of a level show initially decreased perfusion with delayed and persisted perfusion at the right frontal, temporal area and the basal ganglia. Images from the top left to the bottom right show the sequential changes in the signal intensity (perfusion) every 1.32 seconds. D. Added images of a peak and a late phase subtraction image show a perfusion defect only at the right basal ganglia (arrow), which is consistent with a diffusion weighted image (not shown). Korean J Radiol 5(3), September 2004. 145.
(4) Choi et al.. indicated perfusion defects in the right posterior frontal and temporal lobes as well as in the basal ganglia (Fig. 2A). The late Z-score image showed delayed perfusion in these same areas, except for the basal ganglia (Fig. 2B). The subtraction dynamic images revealed an initial decrease in perfusion with delayed and persistent perfusion in the right frontal, temporal, and basal ganglia areas (Fig. 2C). The subtraction images from the peak and late phases were added in order to observe the extent of the perfusion defect, which appeared only in the right basal ganglia (Fig. 2D) and was consistent with the diffusion-weighted image. In a 7-year-old girl with Moya-moya disease, the T2-, T1-, and diffusion-weighted images showed no evidence of an infarction, but did show a marked narrowing of the distal internal carotid artery as well as many collateral vessels bilaterally on MRA. The peak Z-score image indicated a perfusion defect in the MCA territory of the left frontal and parietal areas, and the late Z-score image showed delayed perfusion in those areas. The subtraction dynamic images revealed markedly delayed perfusion in the left MCA territory after the peak phase with no background noise. A 20-year-old female who suffered a diffuse axonal injury one year prior displayed mild brain atrophy and marked signal loss in the body of the corpus callosum on the T2-weighted images due to a previous hemorrhage. The peak and late Z-score images showed a generalized decreased perfusion in the brain as well as inhomogeneously decreased perfusion in the frontal area and corpus callosum. The subtraction dynamic images indicated decreased perfusion in the frontal deep white matter and corpus callosum. A 60-year-old male who suffered a metastatic brain tumor from lung cancer had a rim-enhanced mass in the right occipital area. The peak Z-score image showed increased perfusion, and the late Z-score image indicated persistent perfusion along the tumor wall. The subtraction dynamic images also indicated increased, persistent perfusion along the tumor wall with no background noise.. DISCUSSION Brain perfusion studies are helpful for evaluating ischemic disease by providing information on the perfusion state, and various diagnostic modalities with several parametric variables have been used (2, 3). However, the resulting perfusion images are confusing due to differences in the mechanisms used to acquire the image, the distribution compartments of the contrast medium, the contrast injection time, and the interval between the contrast injection and the start of the scan, which depend on the 146. modalities and software programs provided by the venders. Therefore, it is essential to develop new, more standardized, clinically useful perfusion imaging methods for different diseases that can cause perfusion abnormalities. Of the modalities used for perfusion studies, MRI is the most appropriate because it has a short acquisition time (about 1 sec), which allows for frequent repeated scans, and the capability of scanning the whole brain simultaneously to observe each compartment and the wash-out process during the first pass of the contrast. The most widely used perfusion study is the T2* or EPI sequence after injecting the contrast medium, which causes local susceptibility differences that affect the signal intensity. Although a contrast enhancement is not equivalent to a perfusion abnormality (9), the perfusion images thus obtained provide important supplementary information about the brain tissue with impaired perfusion (10), and can help in predicting the risk of lesion enlargement in the case of a perfusion/diffusion mismatch (11). Perfusion studies are also useful in predicting the pathological grade of a brain tumor (6, 12, 13) and in assessing the tumor activity during anti-angiogenic treatment (14) or radiation therapy (15). A perfusion study combined with MR spectroscopy can distinguish between high-grade gliomas and solitary metastases (16) and can detect residual or recurrent tumors in patients with treated gliomas (17). These quantitative perfusion studies involve a first-pass bolus tracking of the contrast medium based on the dephasing effect of the extravascular protons by a blood pool agent. Perfusion can be quantified by measuring the concentration of the contrast medium in the ROI using the indicator dilution theory, which analyzes the MR signal from the tissues and numerical simulations (2, 18), and by calculating the gamma-variate curve from the time-signal intensity curve (9) and the arterial input function from the MCA (3). The relationship between the concentration of the contrast and the accompanying changes in the transverse relaxation rate shows different patterns in the tissues studied as well as in the reference artery, which can be used to measure the CBF, CBV, and residue function. The error depends on the nature of the microvasculature, the properties of the contrast agent, and the weights of the compartments in the total signal (18). It is also necessary to use a correction process with a two-compartment kinetic model in order to account for the extravasation of the contrast during bolus passage (19). In a single-shot EPI sequence, an iron-induced susceptibility effect may lead to an underestimation of the rCBF or regional cerebral blood volume in the basal ganglia (20), and the CBV and MTT values can show differences in precision and accuracy Korean J Radiol 5(3), September 2004.
(5) Brain Perfusion Imaging Using Z-Score and Dynamic Subtracting Technique. according to the post-processing methods used for the perfusion imaging (21). Consequently, there are many fundamental limitations in quantifying the flow. Of the parameters examined, the CBF and MTT were more sensitive to the areas with a perfusion defect in a hyperacute infarction than was the CBV (22). The flow heterogeneity (FH) was more helpful in estimating the permanent infarction area as a consequence of the high false-positive rate of the MTT (23). In addition, the relative recirculation (rR) might serve as a surrogate marker in trials of antiangiogenic therapy in gliomas (24). The Z-score is used as a threshold for detecting the activation area in fMRI (7, 8). Therefore, the Z-score image represents the all-or-none pattern signals on a pixel-bypixel basis by showing only the signals that exceed a certain threshold value. The quality of the perfusion image depends on the Z-score value and might not clearly express the perfusion difference if it is not prominent. The first pass of the contrast lasts for 10 to 20 sec from the time of arrival to the washout of the contrast medium, depending on the patient’s age and condition. Therefore, images for a specific period cannot represent the pattern and degree of perfusion. For that reason, Z-score images will be of poor quality, and if the grouping is inappropriate or if delayed perfusion is not considered, the portion or degree of the perfusion defect can differ from the true perfusion status. The subtraction dynamic images derived from the preand post-contrast EPI were of sufficient quality with no background noise and clearly showed the temporal changes in the perfusion, particularly the delayed perfusion through the collateral circulation. Moreover, adding the peak and late subtraction images revealed the true extent of the perfusion defect (Fig. 2D). In the near future, the development of a simplified computer program will allow these methods to be used to simplify a study of perfusion. The aim of this study was not to compare these methods with others, but rather to evaluate the potential of uses of these methods in order to obtain perfusion images. Therefore, these methods and the resulting images were presented in order to suggest that they can be used as perfusion images in the absence of available commercial programs. In summary, perfusion images of the brain were obtained easily using the Z-scores and the subtraction dynamic method from the susceptibility-contrast EPI sequence. The peak and late Z-score images showed the degree of local perfusion well. However, the image quality depended on the threshold value of the Z-score, and the perfusion pattern changed with the grouping of the studies. Moreover, multiple post-processing was sometimes Korean J Radiol 5(3), September 2004. required either with different threshold values or with different groupings, and the perfusion defect could be exaggerated if delayed perfusion was not considered. The subtraction dynamic images revealed the area and the degree of the delayed perfusion well with no background noise, showing the dynamic sequential changes in the perfusion more clearly. The precise area of the perfusion defect also could be observed accurately by adding the peak and late subtraction images. These methods were not quantitative, but it is believed that these images showed a better anatomic and contrast resolution than the reported perfusion studies, and they showed the perfusion status well in the different brain diseases examined. In conclusion, the Z-score and subtraction dynamic images showed the degree of perfusion and the sequential changes in the perfusion pattern, respectively. These methods should be adopted as new complimentary methods for observing the perfusion patterns in various brain diseases. Acknowledgment The authors acknowledge Mr. Stefan Domalski of Siemens MRM for useful discussions and for preparing of some documents.. References 1. Bihan DL, Turner R. Diffusion and perfusion. In: Stark DD, Bradley WG, eds. Magnetic resonance imaging, 2nd ed. St. Louis, Mo: Mosby, 1999:335-371 2. Hagen T, Bartylla K, Piepgras U. Correlation of cerebral blood flow measured by stable xenon CT and perfusion MRI. J Comput Assist Tomogr 1999;23:257-264 3. Lythgoe DJ, Ostergaard L, William SC, et al. Quantitative perfusion imaging in carotid artery stenosis using dynamic susceptibility contrast-enhanced magnetic resonance imaging. Magn Reson Imaging 2000;18:1-11 4. Barbier EL, Lamalle L, Decorps M. Methodology of brain perfusion imaging. J Magn Reson Imaging 2001;13:496-520 5. Gibby WA. Magnetic resonance angiography and flow imaging. In: Zimmerman RA, Gibby WA, Carmody RF, eds. Neuroimaging, clinical and physical principles. New York; Springer-Verlag, 2000:212-219 6. Cha S, Knopp EA, Johnson G, Wetzel SG, Litt AW, Zagzag D. Intracranial mass lesions: dynamic contrast-enhanced susceptibility-weighted echo-planar perfusion MR imaging. Radiology 2002;223:11-29 7. Forman SD, Cohen JD, Fitzgerald M, Eddy WF, Mintun MA, Noll DC. Improved assessment of significant activation in functional magnetic resonance imaging (fMRI): use of a clustersize threshold. Magn Reson Med 1995;33:636-647 8. Weiger M, Pruessmann KP, Osterbauer R, Bornert P, Boesiger P, Jezzard P. Sensitivity-encoded single-shot spiral imaging for reduced susceptibility artifacts in BOLD fMRI. Magn Reson Med 2002;48:860-866 9. Knopp EA, Cha S, Johnson G, et al. Glial neoplasms: Dynamic contrast-enhanced T2* weighted MR imaging. Radiology. 147.
(6) Choi et al. 1999;211:791-798 10. Wittsack HJ, Ritzl A, Fink GR, et al. MR imaging in acute stroke: diffusion-weighted and perfusion imaging parameters for predicting infarct size. Radiology 2002;222:397-403 11. Neumann-Haefelin T, Wittsack HJ, Wenserski F, et al. Diffusion- and perfusion-weighted MRI. The DWI/PWI mismatch region in acute stroke. Stroke 1999;30:1591-1597 12. Roberts HC, Roberts TPL, Brasch RC, Dillon WP. Quantitative measurement of microvascular permeability in human brain tumors achieved using dynamic contrast-enhanced MR imaging: correlation with histologic grade. AJNR Am J Neuroradiol 2000;21:891-899 13. Provenzale JM, Wang GR, Brenner T, Petrella JR, Sorensen AG. Comparison of permeability in high-grade and low-grade brain tumors using dynamic susceptibility contrast MR imaging. AJR Am J Roentgenol 2002;178:711-716 14. Cha S, Knopp EA, Johnson G, et al. Dynamic contrast-enhanced T2*-weighted MR imaging of recurrent malignant gliomas treated with thalidomide and carboplatin. AJNR Am J Neuroradiol 2000;21:881-890 15. Sugahara T, Korogi Y, Tomiguchi S, et al. Posttherapeutic intraaxial brain tumor: the value of perfusion-sensitive contrastenhanced MR imaging for differentiating tumor recurrence from nonneoplastic contrast-enhancing tissue. AJNR Am J Neuroradiol 2000;21:901-909 16. Law M, Cha S, Knopp EA, Johnson G, Arnett J, Litt AW. Highgrade gliomas and solitary metastases: differentiation by using perfusion and proton spectroscopic MR imaging. Radiology 2002;222:715-721 17. Henry RG, Vigneron DB, Fischbein NJ, et al. Comparison of relative cerebral blood volume and proton spectroscopy in patients with treated gliomas. AJNR Am J Neuroradiol. 148. 2000;21:357-366 18. Kiselev VG. On the theoretical basis of perfusion measurements by dynamic susceptibility contrast MRI. Magn Reson Med 2001;46:1113-1122 19. Vonken EP, van Osch MJ, Bakker CJ, Viergever MA. Simultaneous quantitative cerebral perfusion and Gd-DTPA extravasation measurement with dual-echo dynamic susceptibility contrast MRI. Magn Reson Med 2000;43:820-827 20. Yamada K, Gonzalez RG, Ostergaard L, et al. Iron-induced susceptibility effect at the globus pallidus causes underestimation of flow and volume on dynamic susceptibility contrastenhanced MR perfusion images. AJNR Am J Neuroradiol 2002;23:1022-1029 21. Perkio J, Aronen H, Kangasmaki A, et al. Evaluation of four postprocessing methods for determination of cerebral blood volume and mean transit time by dynamic susceptibility contrast imaging. Magn Reson Med 2002;47:973-981 22. Smith AM, Grandin CB, Duprez T, Mataigne F, Cosnard G. Whole brain quantitative CBF, CBV, and MTT measurements using MRI bolus tracking: implementation and application to data acquired from hyperacute stroke patients. J Magn Reson Imaging 2000;12:400-410 23. Simonsen CZ, Rohl L, Vestergaard-Poulsen P, Gyldensted C, Anderson G, Ostergarrd L. Final infarct size after acute stroke: prediction with flow heterogeneity. Radiology 2002;225:269275 24. Jackson A, Kassner A, Annesley-Williams D, Reid H, Zhu XP, Li KL. Abnormalities in the recirculation phase of contrast agent bolus passage in cerebral gliomas: comparison with relative blood volume and tumor grade. AJNR Am J Neuroradiol 2002;23:7-14. Korean J Radiol 5(3), September 2004.
(7)
수치
관련 문서
Output of the developed EAR system on sample images (a) Original input player images (Player and face not detected) (b) Player image enhancement using the MSR (c)
웹 표준을 지원하는 플랫폼에서 큰 수정없이 실행 가능함 패키징을 통해 다양한 기기를 위한 앱을 작성할 수 있음 네이티브 앱과
_____ culture appears to be attractive (도시의) to the
이하선의 실질 속에서 하악경의 후내측에서 나와 하악지의 내측면을 따라 앞으로 간다. (귀밑샘 부위에서 갈라져 나와
1 John Owen, Justification by Faith Alone, in The Works of John Owen, ed. John Bolt, trans. Scott Clark, "Do This and Live: Christ's Active Obedience as the
The purpose of this study was to examine the effect of shadowing using English movies on listening and speaking skills, learning interest, and attitudes
Therefore, the aim of this study was to investigate the morphologic characteristics of the interalveolar foramen and to analyze according to sex and age using cone
As the results from this study, it proved the usefulness of color psychological counseling through the effect of color stimuli on brain waves to
