Impact of skeletal divergence on oral health-related quality of life and self-reported jaw function
Objective: To investigate the differences in oral health-related quality of life (OHRQoL) and self-reported jaw function between patients with hyperdivergent and normodivergent facial types. Methods: Eighty patients with a distinctively hyperdivergent facial type (mandibular plane angle greater than 2 standard deviations, or 42
o) and 80 controls were individually matched according to age, sex, ethnicity, and treatment stage. Data were collected using self-report questionnaires such as the Oral Health Impact Profile (OHIP-14) and Jaw Functional Limitation Scale (JFLS-8). Results: The mean age of the patients was 17.2 ± 4.6 years (range, 12–49 years), with most (65.0%) being female and of New Zealand European origin (91.3%). Individuals with hyperdivergent facial types had higher overall and social domain scores on the OHIP-14 ( p < 0.05) than did the ones with normodivergent facial types. However, the intergroup differences in JFLS-8 scores were not significant (p > 0.05). Conclusions: Jaw function appears to be similar in individuals with hyperdivergent and normodivergent facial morphologies. However, those with hyperdivergent facial types are more likely to self-report poorer OHRQoL than are those with normal faces, especially in relation to social aspects. .
[Korean J Orthod 2017;47(3):186-194]
Key words: Vertical facial morphology, Hyperdivergence, Oral health-related quality of life, Jaw function
Joseph Safwat Antoun
aWilliam Murray Thomson
aTony Raymond Merriman
bRoberto Rongo
cMauro Farella
aa
Department of Oral Sciences, Sir John Walsh Research Institute, Faculty of Dentistry, University of Otago, Dunedin, New Zealand
b
Department of Biochemistry, School of Medical Sciences, University of Otago, Dunedin, New Zealand
c
Department of Neuroscience, Reproductive Science and Oral Science, University of Naples “Federico II”, Naples, Italy
Received July 14, 2016; Revised September 27, 2016; Accepted October 17, 2016.
Corresponding author: Joseph Safwat Antoun.
Senior Lecturer, Discipline of Orthodontics, Department of Oral Sciences, Sir John Walsh Research Institute, Faculty of Dentistry, University of Otago, North Dunedin, Dunedin 9016, New Zealand.
Tel +64-3-479-7071 e-mail [email protected]
*This study was supported by grants from the New Zealand Dental Association’s Research Foundation (NZDARF), the Health Research Council (HRC) of New Zealand, the Education and Research Development Group (ERDG) of the New Zealand Association of Orthodontists (NZAO), and the Foundation for Orthodontic Research and Education, NZAO (FORENZAO) Charitable Trust.
© 2017 The Korean Association of Orthodontists.
The authors report no commercial, proprietary, or financial interest in the products or companies described in this article.
This is an Open Access article distributed under the terms of the Creative Commons Attribution Non-Commercial License (http://creativecommons.org/licenses/by-nc/4.0) which permits unrestricted non-commercial use, distribution, and reproduction in any medium, provided the original work is properly cited.
pISSN 2234-7518 • eISSN 2005-372X
https://doi.org/10.4041/kjod.2017.47.3.186
INTRODUCTION
Most patients seek orthodontic treatment for esthetic reasons,
1although those with severe dentofacial de- formities may also report functional problems.
2Acco- rdingly, malocclusions may have a significant impact on oral health-related quality of life (OHRQoL) and, particularly, on emotional and social wellbeing.
3,4In addition to the nature and severity of malocclusions,
5their type and location might play a part in this.
For instance, significantly higher Child Perceptions Questionnaire (CPQ) scores have been reported for several dental anomalies located in the esthetic zone, including multiple missing teeth,
6greater overjet, and anterior spacing.
7Individuals with hyperdivergent facial types (or long faces) also have esthetically sensitive characteristics, with anterior open bite, gummy smile, and excessive lower facial height being common findings.
8Specific features of the long face, such as anterior open bite, have been associated with greater impacts on OHRQoL.
9However, few studies have investigated the relationship between OHRQoL and the hyperdivergent facial type as a distinct craniofacial anomaly. Individuals with hyperdivergent facial types are reported to have less attractive profiles,
10,11poorer masticatory performance, and a slower chewing rate than do normal or short- faced individuals.
12These functional differences have been attributed to their lower bite force, which typically leads to greater muscular effort and associated rapid fatiguing.
12Individuals with other facial morphologies may not necessarily experience this combination of esthetic and functional problems; therefore, we assume that these factors may have some additional impact on one’s quality of life.
A large number of self-report instruments have been used in orthodontics to evaluate the impact of malocclusion on OHRQoL. Of these, the short-form Oral Health Impact Profile (OHIP-14)
13is the most frequently used to assess the impact of orthodontic problems
9and the effect of treatment on OHRQoL.
14Despite its popularity, differentiation among the various dimensions of the OHIP-14 can often be difficult because of the limited number of items used to characterize each domain.
15Functional limitations, in particular, may be more comprehensively assessed using condition-specific instruments such as the short-form Jaw Functional Limitation Scale (JFLS-8),
16which has been reported to be a useful self-report instrument for individuals with functional problems.
17The objective of the present study was to investigate the differences in OHRQoL and jaw function between individuals with hyperdivergent and normodivergent facial types by using the OHIP-14 and JFLS-8, respectively. We
hypothesized that individuals with hyperdivergent facial types would have relatively poorer OHRQoL, especially in the functional and psychosocial domains, than do individuals with normodivergent facial types.
MATERIALS AND METHODS
The study included orthodontic patients with hy- perdivergent and normodivergent facial types (n = 80 in each group), individually matched according to age, sex, ethnicity, and orthodontic treatment stage.
Study participants were recruited by systematically screening the lateral cephalograms of previous and existing patients treated in the orthodontic clinic at the University of Otago (Dunedin, New Zealand). Since this study was part of a broader research project, the sample size was estimated using an outcome measure (minor allele frequency for single-nucleotide polymorphisms) not reported in this article. The study was approved by the University of Otago Ethics Committee (reference, 11/196).
The inclusion criteria were a willingness to participate, provision of informed consent, and a good-quality pre- treatment cephalogram. Patients were excluded from the study if they had more than four extracted permanent teeth (excluding third molars), orofacial clefts, crani- ofacial syndromes, or a history of facial fractures.
Classification of vertical facial morphology
Facial morphology was evaluated by screening pre- treatment lateral cephalograms for the mandibular plane angle (sella-nasion to mandibular plane). Participants with hyperdivergent facial types (cases) were selected on the basis of having an SN-MP angle greater than 2 standard deviations from the norm, or 42
o. Individuals with normodivergent facial types (controls) were selected if the mandibular plane angle was within 1 standard deviation of the norm, or between 27
oand 37
o. The cut-off values used to define the study groups were independent of age or sex, and were those commonly used in Caucasian populations.
18Evaluation of OHRQoL
Study participants were asked to complete the 14-item
OHIP-14 questionnaire based on their experiences over
the previous 4 weeks.
13The 14 items of the OHIP-14 re-
present the seven domains of function, pain, physical
disability, psychological discomfort, psychological
disability, social disability, and handicap. The parti-
cipants reported the impact on each item by using a
5-point Likert-type response format (4 = very often, 3 =
fairly often, 2 = occasionally, 1 = hardly ever, and 0 =
never). An individual’s overall score could range from 0
to 56, while the domain scores could range from 0 to
8. A higher OHIP-14 score indicated a greater impact on OHRQoL. The OHIP-14 scores were computed and reported as follows: (1) the prevalence or proportion of participants reporting more than one impact (defined as
“very often” or “fairly often”, code 3 or 4); and (2) the severity or total OHIP-14 score (calculated by adding the scores of all 14 items).
Concurrent validity of the OHIP-14 was investigated by observing the mean OHIP-14 scores across the ordinal response categories of a global question included in the study questionnaire (i.e., “How would you describe the health of your teeth or mouth?”).
19Responses to the global question were recorded as either “excellent,” “very good,” “good,” “fair,” or “poor.”
Evaluation of jaw function
Study participants were also asked to complete the JFLS-8 based on their experiences over the previous 4 weeks.
16The 8-item questionnaire sought information on the degree of limitation involved in carrying out normal daily tasks including chewing tough food, chewing chicken prepared in an oven, eating soft food not requiring chewing, opening the mouth wide enough to drink from a cup, swallowing, yawning, talking, and smiling. The participants reported the extent of functional limitation for each item by using an unmarked 10-cm visual analogue scale (VAS). They
were asked to place a vertical mark on the scale that was anchored by “no limitation” at one end and “severe limitation” at the other end. They were also instructed not to respond to an item if they avoided that specific activity for reasons other than a physical limitation (such as a vegetarian who does not normally eat chicken—
item 2). The VAS score for each item was recorded as a continuous variable.
Statistical analysis
Data were analyzed using conventional descriptive methods. Bivariate analysis was performed using the chi-square test, Fisher’s exact test, and one-way analysis of variance as appropriate. Non-parametric tests (such as the Kruskal-Wallis and Mann-Whitney U tests) were used whenever a continuous dependent variable was not normally distributed. Data were analyzed using IBM SPSS Statistics for Macintosh (version 22.0; IBM Co., Armonk, NY, USA).
RESULTS
The mean age of the participants was 17.2 ± 4.6 years (range, 12–49 years), with most participants being female (65.0%) and of New Zealand European origin (91.3%; Table 1). Approximately 25% of the participants had not received any orthodontic care, while 45% had
Table 1. Sociodemographic characteristics of the study participants
Variable Study group
Total (n = 160) Hyperdivergent (n = 80) Normodivergent (n = 80)
Age (yr) 17.1 ± 4.5 17.3 ± 4.6 17.2 ± 4.6
Sex
Male 28 (35.0) 28 (35.0) 56 (35.0)
Female 52 (65.0) 52 (65.0) 104 (65.0)
Ethnicity*
European 73 (91.3) 73 (91.3) 146 (91.3)
Maori 2 (2.5) 2 (2.5) 4 (2.5)
Polynesians 2 (2.5) 2 (2.5) 4 (2.5)
Asian 1 (1.3) 2 (2.5) 3 (1.9)
Latin American 1 (1.3) 0 (0.0) 1 (0.6)
African 1 (1.3) 1 (1.3) 2 (1.3)
Treatment stage
†Before 18 (22.5) 19 (23.8) 37 (23.1)
During 25 (31.3) 26 (32.5) 51 (31.9)
After 37 (46.3) 35 (43.8) 72 (45.0)
Values are presented as mean ± standard deviation or number (%).
*One Latin American case (long face) was matched with an Asian control (normal face);
†two case-control pairs were not
matched according to treatment stage.
completed treatment. The two groups differed primarily in hyperdivergence, but not in sagittal characteristics.
For instance, the A point-nasion-B point angle in the cases (3.8
o± 2.7
o) was similar to that in the controls (3.1
o± 3.1
o; p > 0.05).
The majority of the participants rated the overall health of their teeth and mouth as either “very good” (39.4%) or “good” (35.6%), with very few rating it as “poor”
(2.5%). In general, a gradient was observed in the OHIP- 14 scores across the five categories of the self-rated oral health global question (Table 2). Participants who rated their overall oral health as either “fair” or “poor” had the highest mean OHIP-14 scores and greatest prevalence of OHIP-14 impacts.
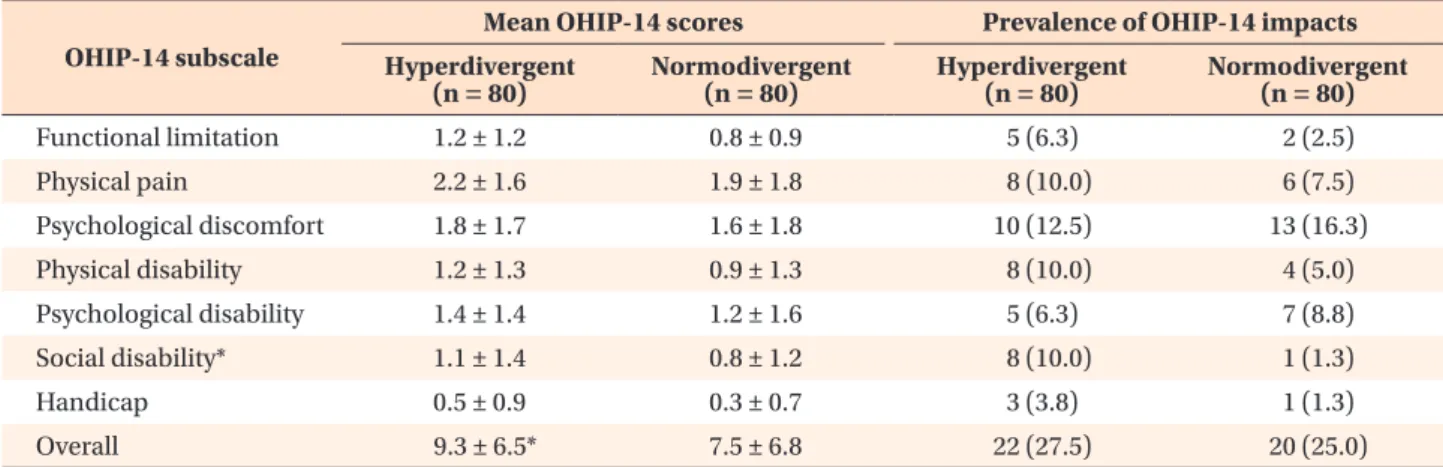
The prevalence of impacts and the mean score for each of the seven domains are presented in Table 3.
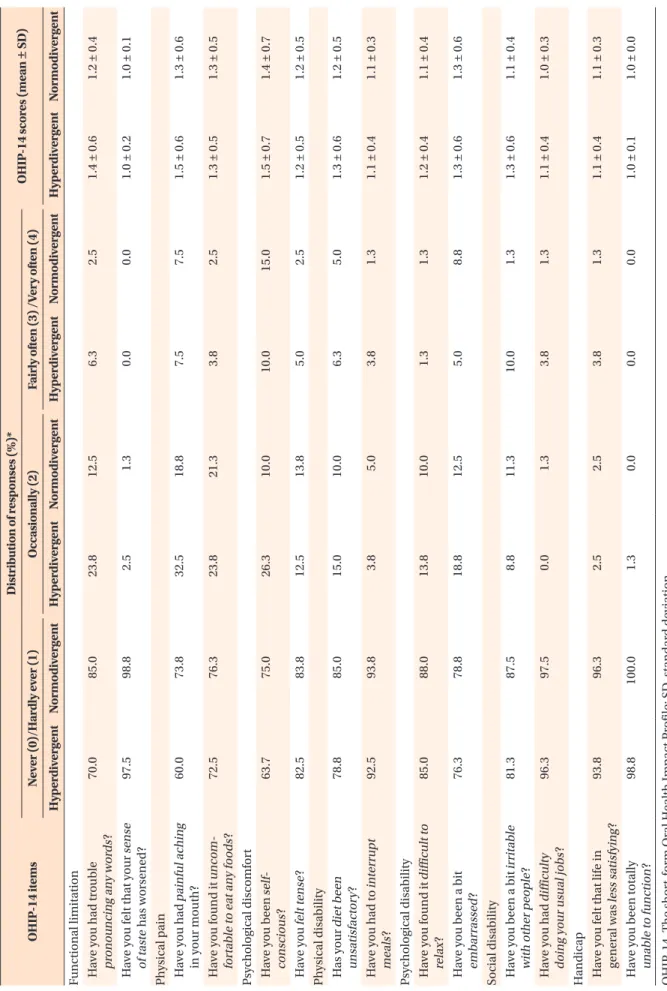
No statistically significant differences were observed in the prevalence of OHIP-14 impacts or in the mean item score for any of the 14 items between the two study groups (Table 4). Approximately 10% of the participants
with hyperdivergent facial types reported experiencing at least one impact related to social disability (p <
0.05). These participants also had consistently higher mean OHIP-14 scores in all seven domains, even though these did not differ significantly from those of the controls. The overall OHIP-14 score was higher in the hyperdivergent group than in the normodivergent group (p < 0.05).
The participants with hyperdivergent facial types had a slightly higher mean score than did the controls for most of the JFLS-8 items, but these differences were not statistically significant (Table 5). The greatest limitation in the hyperdivergent group was reported for
“chewing chicken prepared in an oven” and “chewing tough food,” while the least discomfort occurred while
“talking.” Moreover, the mean score for “eating soft food not requiring chewing” in the hyperdivergent group was identical to that for “chewing tough food” in the normodivergent group.
Table 2. Mean OHIP-14 scores and prevalence of OHIP-14 impacts according to self-rated oral health (global question) Global question* Frequency Severity (OHIP-14 score)
†Prevalence
‡Excellent 11 (6.9) 7.9 ± 6.3 4/11 (36.4)
Very good 63 (39.4) 6.9 ± 5.8 14/63 (22.2)
Good 57 (35.6) 7.7 ± 6.6 9/57 (15.8)
Fair 25 (15.6) 12.2 ± 7.1 12/25 (48.0)
Poor 4 (2.5) 18.8 ± 4.1 3/4 (75.0)
Values are presented as mean ± standard deviation or number (%).
OHIP-14, the short-form Oral Health Impact Profile.
*“How would you describe the health of your teeth or mouth?”
Prevalence indicates proportion of participants reporting more than one impact.
†