JPNT 9(3), 191-205 (2020)
https://doi.org/10.11003/JPNT.2020.9.3.191
Copyright © The Institute of Positioning, Navigation, and Timing
JPNT
Journal of Positioning, Navigation, and Timinghttp://www.ipnt.or.kr Print ISSN: 2288-8187 Online ISSN: 2289-0866
1. INTRODUCTION
A Radio Navigation Satellite Service (RNSS) is a Radio Determination Satellite Service used for the purpose of radio navigation including Global Navigation Satellite Service (GNSS) (ITU 2016a). As Position, Navigation, and Timing (PNT) services have become a critical and essential component of national infrastructure and civil and commercial applications, the RNSS system is becoming increasingly important to modern society. According to Esper et al. (2020), the U.S. Global Positioning System (GPS) is a cornerstone of the national PNT architecture, and the GPS modernization effort are underway to improve positioning and timing accuracy, availability, and integrity monitoring support capability. The other space powers such as Russia, Europe, China, Japan, and India recognize the importance of the RNSS system and are steadily working on building their own RNSS systems or modernizing existing
Investigation on Figures-of-Merit of Signal Performance for Next Generation RNSS Signal Design
Kahee Han
1, Jong-Hoon Won
2†1
Autonomous Navigation Lab., Inha University, Incheon 22212, Korea
2
Department of Electrical Engineering, Inha University, Incheon 22212, Korea
ABSTRACT
Designing a new signal is essential in the development of a new Radio Navigation Satellite Service (RNSS) system. This paper introduces the signal design parameters and the figures of merit (FoMs) to be considered in designing a new RNSS signal, and then reviews their relationship in details. In addition, we show examples of the trade-off analysis between FoMs according to the signal design scenarios using an analytical simulation tool based on the relationship between the signal design parameters and the FoMs.
Keywords: RNSS, GNSS, figure of merit, signal design parameters, analytical simulation
systems. Recently, South Korea also begins internally to discuss on a development plan for its own RNSS system, so called Korean Positioning System (KPS), with the goal of 2035 (Park & Heo 2019), and the signal design team began its operation earlier in 2018.
Designing a new RNSS signal is essential in developing a new RNSS system or modernizing the existing system.
The RNSS space powers are using their own RNSS signals and steadily working on designing new signals for a better performances as a part of system modernization. There are many challenges in the RNSS signal design, such as signal performance improvements versus resource limitations, compatibility and interoperability between the existing RNSS signals, and trade-offs between various signal performances. In addition, the signal performances are determined by the channel and the receiver resources as well as the signal design parameters, so we have to take into account the receiving environment and the RNSS receiver specifications. However, it is impossible to consider these challenges using real measurements of signals in space from the satellites at the initial signal design phase.
For this reason, we suggest to use the RNSS signal design simulation tool in order to evaluate the designed RNSS signal performance, and to analyze the trade-offs between signal performances. To implement the RNSS signal design
Received Jul 28, 2020 Revised Jul 29, 2020 Accepted Jul 31, 2020†Corresponding Author E-mail: [email protected]
Tel: +82-32-860-7406 Fax: +82-32-863-5822 Kahee Han https://orcid.org/0000-0001-8804-5120 Jong-Hoon Won https://orcid.org/0000-0001-5258-574X
192
JPNT 9(3), 191-205 (2020)https://doi.org/10.11003/JPNT.2020.9.3.191
simulation tool, we need to select appropriate figures-of-merit (FoMs) to represent the signal performance quantitatively and investigate the relationship between the signal design parameters and the FoMs. Therefore, this paper reviews the basic concept of the RNSS signal and the FoMs according to the RNSS signal transmission/reception chain and shows examples of trade-off analysis using the simulation tool.
The remainder of this paper is organized as follows.
Section 2 briefly describes the basic concept of the RNSS signal. In Section 3, we review the FoMs according to each part of the RNSS signal transmission/reception chain and describe the relationship between the signal design parameters and each FoM. Section 4 presents examples of the trade-off analysis between FoMs using the developed RNSS signal design simulation tool with several scenarios.
Finally, we conclude the paper in Section 5 by outlining the trade-off analysis results.
2. RNSS SIGNALS
The transmitted RF RNSS signal can be represented using complex envelope notation as follows:
For this reason, we suggest to use the RNSS signal design simulation tool in order to evaluate the designed RNSS signal performance, and to analyze the trade-offs between signal performances. To implement the RNSS signal design simulation tool, we need to select appropriate figures-of-merit (FoMs) to represent the signal performance quantitatively and investigate the relationship between the signal design parameters and the FoMs. Therefore, this paper reviews the basic concept of the RNSS signal and the FoMs according to the RNSS signal transmission/reception chain and shows examples of trade-off analysis using the simulation tool.
The remainder of this paper is organized as follows. Section 2 briefly describes the basic concept of the RNSS signal. In Section 3, we review the FoMs according to each part of the RNSS signal transmission/reception chain and describe the relationship between the signal design parameters and each FoM. Section 4 presents examples of the trade-off analysis between FoMs using the developed RNSS signal design simulation tool with several scenarios. Finally, we conclude the paper in Section 5 by outlining the trade-off analysis results.
2. RNSS SIGNALS
The transmitted RF RNSS signal can be represented using complex envelope notation as follows:
( ) { ( )
} (1)
where ( ) is a real-valued RF signal, ( ) is the complex envelope (also called complex baseband signal) of the RF signal, and is the carrier frequency.
The complex envelope contains information to be transmitted and can be expressed in complex forms as follows:
( ) ( )
( )( ) ( ) (2)
where ( ) and ( ) is the magnitude and the phase of the complex envelope, respectively. It is noted here that the subscripts I and Q represent in-phase and quadrature components, so that and ( ) and ( ) are the in-phase and quadrature components of the complex envelope, respectively.
The RNSS signals are generated using the direct sequence spread spectrum technique except for conventional GLONASS signals. Therefore, the RNSS signal can be obtained by modulating the data bit sequence, i.e., the navigation message bits, with the spreading code. The spreading code is also called pseudo-random noise (PRN) code transforming the data bit sequence to a noise-like signal.
Using the signal transmission power, data bit sequence, and spreading code, we can rewrite the complex envelope in Eq. (2) as follows.
( ) √ ∑ ∑
(
) (
)
√ ∑ ∑
(
) (
)
(3)
where, is the total transmit power of the complex envelope, and are power split coefficients between in-phase and quadrature component (i.e. ),
and
are the data bit duration,
and
are the spreading code chip duration, {
} and {
} are the spreading codes with
* + and
* +, {
} and {
} are the data
(1)
where s(t) is a real-valued RF signal, x(t) is the complex envelope (also called complex baseband signal) of the RF signal, and f
cis the carrier frequency.
The complex envelope contains information to be transmitted and can be expressed in complex forms as follows:
For this reason, we suggest to use the RNSS signal design simulation tool in order to evaluate the designed RNSS signal performance, and to analyze the trade-offs between signal performances. To implement the RNSS signal design simulation tool, we need to select appropriate figures-of-merit (FoMs) to represent the signal performance quantitatively and investigate the relationship between the signal design parameters and the FoMs. Therefore, this paper reviews the basic concept of the RNSS signal and the FoMs according to the RNSS signal transmission/reception chain and shows examples of trade-off analysis using the simulation tool.
The remainder of this paper is organized as follows. Section 2 briefly describes the basic concept of the RNSS signal. In Section 3, we review the FoMs according to each part of the RNSS signal transmission/reception chain and describe the relationship between the signal design parameters and each FoM. Section 4 presents examples of the trade-off analysis between FoMs using the developed RNSS signal design simulation tool with several scenarios. Finally, we conclude the paper in Section 5 by outlining the trade-off analysis results.
2. RNSS SIGNALS
The transmitted RF RNSS signal can be represented using complex envelope notation as follows:
( ) { ( )
} (1)
where ( ) is a real-valued RF signal, ( ) is the complex envelope (also called complex baseband signal) of the RF signal, and is the carrier frequency.
The complex envelope contains information to be transmitted and can be expressed in complex forms as follows:
( ) ( )
( )( ) ( ) (2)
where ( ) and ( ) is the magnitude and the phase of the complex envelope, respectively. It is noted here that the subscripts I and Q represent in-phase and quadrature components, so that and ( ) and ( ) are the in-phase and quadrature components of the complex envelope, respectively.
The RNSS signals are generated using the direct sequence spread spectrum technique except for conventional GLONASS signals. Therefore, the RNSS signal can be obtained by modulating the data bit sequence, i.e., the navigation message bits, with the spreading code. The spreading code is also called pseudo-random noise (PRN) code transforming the data bit sequence to a noise-like signal.
Using the signal transmission power, data bit sequence, and spreading code, we can rewrite the complex envelope in Eq. (2) as follows.
( ) √ ∑ ∑
(
) (
)
√ ∑ ∑
(
) (
)
(3)
where, is the total transmit power of the complex envelope, and are power split coefficients between in-phase and quadrature component (i.e. ),
and
are the data bit duration,
and
are the spreading code chip duration, {
} and {
} are the spreading codes with
* + and
* +, {
} and {
} are the data
(2) where A(t) and ϕ(t) is the magnitude and the phase of the complex envelope, respectively. It is noted here that the subscripts I and Q represent in-phase and quadrature components, so that and x
I(t) and x
Q(t) are the in-phase and quadrature components of the complex envelope, respectively.
The RNSS signals are generated using the direct sequence spread spectrum technique except for conventional GLONASS signals. Therefore, the RNSS signal can be obtained by modulating the data bit sequence, i.e., the navigation message bits, with the spreading code. The spreading code is also called pseudo-random noise (PRN) code transforming the data bit sequence to a noise-like signal. Using the signal transmission power, data bit sequence, and spreading code, we can rewrite the complex envelope in Eq. (2) as follows.
For this reason, we suggest to use the RNSS signal design simulation tool in order to evaluate the designed RNSS signal performance, and to analyze the trade-offs between signal performances. To implement the RNSS signal design simulation tool, we need to select appropriate figures-of-merit (FoMs) to represent the signal performance quantitatively and investigate the relationship between the signal design parameters and the FoMs. Therefore, this paper reviews the basic concept of the RNSS signal and the FoMs according to the RNSS signal transmission/reception chain and shows examples of trade-off analysis using the simulation tool.
The remainder of this paper is organized as follows. Section 2 briefly describes the basic concept of the RNSS signal. In Section 3, we review the FoMs according to each part of the RNSS signal transmission/reception chain and describe the relationship between the signal design parameters and each FoM. Section 4 presents examples of the trade-off analysis between FoMs using the developed RNSS signal design simulation tool with several scenarios. Finally, we conclude the paper in Section 5 by outlining the trade-off analysis results.
2. RNSS SIGNALS
The transmitted RF RNSS signal can be represented using complex envelope notation as follows:
( ) { ( ) } (1)
where ( ) is a real-valued RF signal, ( ) is the complex envelope (also called complex baseband signal) of the RF signal, and is the carrier frequency.
The complex envelope contains information to be transmitted and can be expressed in complex forms as follows:
( ) ( ) ( )
( ) ( ) (2)
where ( ) and ( ) is the magnitude and the phase of the complex envelope, respectively. It is noted here that the subscripts I and Q represent in-phase and quadrature components, so that and ( ) and ( ) are the in-phase and quadrature components of the complex envelope, respectively.
The RNSS signals are generated using the direct sequence spread spectrum technique except for conventional GLONASS signals. Therefore, the RNSS signal can be obtained by modulating the data bit sequence, i.e., the navigation message bits, with the spreading code. The spreading code is also called pseudo-random noise (PRN) code transforming the data bit sequence to a noise-like signal.
Using the signal transmission power, data bit sequence, and spreading code, we can rewrite the complex envelope in Eq. (2) as follows.
( ) √ ∑ ∑ ( ) ( )
√ ∑ ∑ ( ) ( )
(3)
where, is the total transmit power of the complex envelope, and are power split coefficients between in-phase and quadrature component (i.e. ), and
are the data bit duration, and are the spreading code chip duration, { } and { } are the spreading codes with * + and * +, { } and { } are the data
(3)
where, P
Tis the total transmit power of the complex envelope, γ
Iand γ
Qare power split coefficients between in-phase and quadrature component (i.e. γ
I+γ
Q=2 and γ
I, γ
Q≥0), T
d,land T
d,Qare the data bit duration, T
c,land T
c,Qare the spreading code chip duration, {c
I,l} and {c
Q,n} are the spreading codes with c
I,l∈{-1,+1} and c
Q,n∈{-1,+1}, {d
I,k} and {d
Q,m} are the data bit sequences with d
I,k∈{-1,+1} and d
Q,m∈{- 1,+1}, p
Td,I(t) and p
Td,Q(t) are waveform generation functions for the data bit sequence, and g
I( t) and g
Q( t) are waveform generation functions for the spreading code of the in-phase and the quadrature component.
Most of RNSS signal uses the phase shift keying (PSK) modulation with a rectangular shape of pulse (non-return to zeros), so we can define waveform generation functions in Eq. (3) as follows.
bit sequences with
* + and
* +,
( ) and
( ) are waveform generation functions for the data bit sequence, and ( ) and ( ) are waveform generation functions for the spreading code of the in-phase and the quadrature component.
Most of RNSS signal uses the phase shift keying (PSK) modulation with a rectangular shape of pulse (non-return to zeros), so we can define waveform generation functions in Eq. (3) as follows.
( ) {
( ) {
(4)
Meanwhile, some of the modernized RNSS signals use the binary offset carrier (BOC) modulation to minimize spectral overlap with the existing RNSS signals. The BOC signal can be generated by multiplying the subcarrier with the BPSK signal. In general, we use a sequence of a sign of sinusoidal with a frequency as a subcarrier. Therefore, the subcarrier can be expressed as follows.
, ( )- (for BOC
sin)
, ( )- (for BOC
cos) (5) As shown in Eqs. (1-5), the RNSS signal basically consists of the carrier, the spreading code, and the navigation data. Therefore, the characteristics of the RNSS signal are determined according to how to set the parameters for each component. For example, we have to make a decision on which data rate and message structure we will use as to the navigation message. Fig. 1 shows the RNSS signal design parameters for each component.
3. FIGURES OF MERIT
When we design a new RNSS signal, we must consider the system-level accuracy requirements.
The system-level accuracy requirements can be translated into signal measurement accuracy requirements, such as pseudorange accuracy. In addition to this, the RNSS signal should have the following properties (Spilker 1996a):
Multiple access capability
Robustness to some level of multipath interference
Anti-jamming and anti-spoofing capability
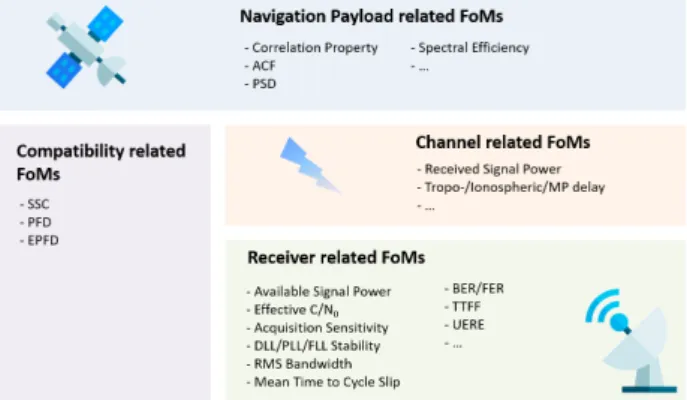
The RNSS signal performance, which indicates how good the signal measurement quality and the signal properties are, can be quantified using various FoMs. Meanwhile, the signal performance depends not only on the signal characteristics but also on the satellite navigation payload as well as the receiver hardware and how to process the signal in the receiver. In this paper, we focus on the FoMs, which are mainly determined by the signal characteristics. The FoMs can be categorized by the related part of the RNSS signal transmission/reception chain as shown in Fig. 2.
3.1 Navigation Payload Related FoMs
The RNSS signal is generated and transmitted by the navigation payload. The payload of the navigation satellite is basically composed of a clock unit, a navigation signal generation unit, a
(4)
Meanwhile, some of the modernized RNSS signals use the binary offset carrier (BOC) modulation to minimize spectral overlap with the existing RNSS signals. The BOC signal can be generated by multiplying the subcarrier with the BPSK signal. In general, we use a sequence of a sign of sinusoidal with a frequency f
sas a subcarrier. Therefore, the subcarrier can be expressed as follows.
bit sequences with
* + and
* +,
( ) and
( ) are waveform generation functions for the data bit sequence, and ( ) and ( ) are waveform generation functions for the spreading code of the in-phase and the quadrature component.
Most of RNSS signal uses the phase shift keying (PSK) modulation with a rectangular shape of pulse (non-return to zeros), so we can define waveform generation functions in Eq. (3) as follows.
( ) {
( ) {
(4)
Meanwhile, some of the modernized RNSS signals use the binary offset carrier (BOC) modulation to minimize spectral overlap with the existing RNSS signals. The BOC signal can be generated by multiplying the subcarrier with the BPSK signal. In general, we use a sequence of a sign of sinusoidal with a frequency as a subcarrier. Therefore, the subcarrier can be expressed as follows.
, ( )- (for BOC
sin)
, ( )- (for BOC
cos) (5) As shown in Eqs. (1-5), the RNSS signal basically consists of the carrier, the spreading code, and the navigation data. Therefore, the characteristics of the RNSS signal are determined according to how to set the parameters for each component. For example, we have to make a decision on which data rate and message structure we will use as to the navigation message. Fig. 1 shows the RNSS signal design parameters for each component.
3. FIGURES OF MERIT
When we design a new RNSS signal, we must consider the system-level accuracy requirements.
The system-level accuracy requirements can be translated into signal measurement accuracy requirements, such as pseudorange accuracy. In addition to this, the RNSS signal should have the following properties (Spilker 1996a):
Multiple access capability
Robustness to some level of multipath interference
Anti-jamming and anti-spoofing capability
The RNSS signal performance, which indicates how good the signal measurement quality and the signal properties are, can be quantified using various FoMs. Meanwhile, the signal performance depends not only on the signal characteristics but also on the satellite navigation payload as well as the receiver hardware and how to process the signal in the receiver. In this paper, we focus on the FoMs, which are mainly determined by the signal characteristics. The FoMs can be categorized by the related part of the RNSS signal transmission/reception chain as shown in Fig. 2.
3.1 Navigation Payload Related FoMs
The RNSS signal is generated and transmitted by the navigation payload. The payload of the navigation satellite is basically composed of a clock unit, a navigation signal generation unit, a
(5)
As shown in Eqs. (1-5), the RNSS signal basically consists of the carrier, the spreading code, and the navigation data. Therefore, the characteristics of the RNSS signal are determined according to how to set the parameters for each component. For example, we have to make a decision on which data rate and message structure we will use as to the navigation message. Fig. 1 shows the RNSS signal design parameters for each component.
3. FIGURES OF MERIT
When we design a new RNSS signal, we must consider
the system-level accuracy requirements. The system-
Kahee Han & Jong-Hoon Won Investigation on FoMs of Signal Performance
193
http://www.ipnt.or.kr level accuracy requirements can be translated into signal
measurement accuracy requirements, such as pseudorange accuracy. In addition to this, the RNSS signal should have the following properties (Spilker 1996a):
• Multiple access capability
• Robustness to some level of multipath interference
• Anti-jamming and anti-spoofing capability
The RNSS signal performance, which indicates how good the signal measurement quality and the signal properties are, can be quantified using various FoMs. Meanwhile, the signal performance depends not only on the signal characteristics but also on the satellite navigation payload as well as the receiver hardware and how to process the signal in the receiver. In this paper, we focus on the FoMs, which are mainly determined by the signal characteristics.
The FoMs can be categorized by the related part of the RNSS signal transmission/reception chain as shown in Fig. 2.
3.1 Navigation Payload Related FoMs
The RNSS signal is generated and transmitted by the navigation payload. The payload of the navigation satellite is basically composed of a clock unit, a navigation signal generation unit, a frequency generation and modulation unit, a high power amplifier (HPA), a output multiplexer, and an antenna (Rebeyrol et al. 2006). The following subsection covers the FoMs related to the navigation payload.
3.1.1 Correlation property
Each satellite is identified by the allocated PRN code.
In ideal case, the PRN code needs to have orthogonality
with any other PRN code in the same family. Also, the PRN code should have to be distinguishable from its time- shifted version. According to Wallner et al. (2011), these requirements can be checked by calculating the correlation percentile. The lower correlation value at the same percentile, except for 100 percent (i.e. the autocorrelation value with itself), means that this PRN code family has a better correlation property than others.
Related signal design parameters: PRN code family, code length 3.1.2 Autocorrelation function
In the acquisition process, we use the ambiguity function, which is a two-dimensional function of the code delay and the Doppler frequency, to determine whether the desired signal exists. Assuming a zero Doppler frequency , the ambiguity function is equal to the correlation function in the code delay domain. The correlation function is performed on the received RNSS signal and the local replica, so the output of the correlation function is dominantly affected by the adopted modulation method.
The shape of the autocorrelation function is related to its acquisition and tracking complexity and ranging error performance (Fine & Wilson 1999, Betz 1999). The autocorrelation function of the BPSK signal has very small side lobe peaks with respect to the main lobe peak, but the BOC signal has non-negligible side lobe peaks. These non-negligible side lobe peaks may cause false detection in a noisy environment, and the false detection causes tracking and reacquisition meaningless, so they need a longer integration time to compensate the noise effect. To reduce false detection, the difference between the main lobe and side lobe peaks of the autocorrelation function should be large. Also, the non-negligible side lobe peaks cause multiple zero-crossing points in the delay lock loop
Fig. 1. RNSS signal design parameters (Han & Won 2018).Fig. 2. Figures of merit in signal transmission/reception chain (Han & Won 2018).
194
JPNT 9(3), 191-205 (2020)https://doi.org/10.11003/JPNT.2020.9.3.191
(DLL) discriminator output, which may cause a false lock.
Therefore, the shape of the autocorrelation function and the ratio of the autocorrelation main lobe peak with respect to the biggest sidelobe peak can be used to evaluate the signal performance (Won et al. 2011).
Related signal design parameters: PRN code family, chipping rate, modulation
3.1.3 Power spectral density
One of the main characteristics of the RNSS signal is the power spectral density (PSD) that can be obtained by the Fourier transform of the autocorrelation function. The PSD indicates how the signal power is distributed in the frequency domain. The shape of the PSD directly affects tracking accuracy, multipath mitigation performance, and compatibility with other RNSS signals (Xue et al. 2015).
The PSD with the large main lobe width has good tracking accuracy and multipath mitigation performance but may be widely overlapped with other RNSS signals in the same band, which induces a poor compatibility of the signal. On the other hand, the signal with a wide main lobe or separated two main lobes requires a wide front-end bandwidth, which inevitably increases the receiver implementation cost. That is, the signal should be designed to have a PSD suitable for the purpose of the signal.
Related signal design parameters: chipping rate, modulation, transmit power
3.1.4 Spectral efficiency
The RNSS signal is transmitted at the antenna through the HPA of the satellite payload, and various problems are introduced by the distortion caused by the nonlinearity of the HPA, and the out-of-band emission (OOBE) may be a critical problem depending on the frequency band.
According to ITU (2015), the OOBE is the emission on a frequency or frequencies immediately outside the necessary bandwidth which is resulted by the modulation process. The RNSS signals share the same frequency band or adjacent band with other systems. Therefore, a strict restriction on the OOBE of the RNSS signals is required based on the following facts for the compatibility with other signals (Xue et al. 2015):
• signals with relatively low OOBE power significantly mitigate signal distortion due to non-ideal filter characteristics, and
• signals with relatively low OOBE power have low noise levels that meet stringent constraints. It also contributes to reducing the complexity and cost of designing satellite filters.
Meanwhile, the energy efficiency of the satellite is a key consideration because of their finite power source.
Therefore, to minimize power loss caused by OOBE, a proper modulation method should be selected in consideration of the necessary frequency bandwidth. The power loss due to OOBE can be quantified by calculating the spectral efficiency η:
3.1.4 Spectral efficiency
The RNSS signal is transmitted at the antenna through the HPA of the satellite payload, and various problems are introduced by the distortion caused by the nonlinearity of the HPA, and the out-of-band emission (OOBE) may be a critical problem depending on the frequency band. According to ITU (2015), the OOBE is the emission on a frequency or frequencies immediately outside the necessary bandwidth which is resulted by the modulation process. The RNSS signals share the same frequency band or adjacent band with other systems. Therefore, a strict restriction on the OOBE of the RNSS signals is required based on the following facts for the compatibility with other signals (Xue et al. 2015):
signals with relatively low OOBE power significantly mitigate signal distortion due to non-ideal filter characteristics, and
signals with relatively low OOBE power have low noise levels that meet stringent constraints. It also contributes to reducing the complexity and cost of designing satellite filters.
Meanwhile, the energy efficiency of the satellite is a key consideration because of their finite power source. Therefore, to minimize power loss caused by OOBE, a proper modulation method should be selected in consideration of the necessary frequency bandwidth. The power loss due to OOBE can be quantified by calculating the spectral efficiency :
∫
( )
(6)
where is the necessary frequency bandwidth (or receiver front end bandwidth in terms of the RNSS receiver), and ( ) is the normalized PSD.
Low spectral efficiency means that the power of the signal is distributed in the out-of-band region. Therefore, in signal design, spectral efficiency must be maximized to efficiently use the frequency resource and ensure compatibility with other services in the adjacent band.
Related signal design parameters: center frequency, chipping rate, modulation 3.2 Channel Related FoMs
In this part, we introduce the FoMs related to the transmission channel.
3.2.1 User received power
The RNSS signal transmitted from the satellite suffers from power loss due to the long transmission distance, the antenna polarization mismatch, the antenna de-pointing, and the atmospheric effects by the ionosphere and the troposphere. Considering these loss factors, the received power at the user receiver antenna can be calculated as follows:
( )
(
)
(7)
where is the transmitted power, is the transmit antenna gain, is the receiver antenna gain,
is the free space loss, is the loss due to the troposphere, is the loss due to the ionosphere, (6)
where B is the necessary frequency bandwidth (or receiver front end bandwidth in terms of the RNSS receiver), and G
s(f) is the normalized PSD.
Low spectral efficiency means that the power of the signal is distributed in the out-of-band region. Therefore, in signal design, spectral efficiency must be maximized to efficiently use the frequency resource and ensure compatibility with other services in the adjacent band.
Related signal design parameters: center frequency, chipping rate, modulation
3.2 Channel Related FoMs
In this part, we introduce the FoMs related to the transmission channel.
3.2.1 User received power
The RNSS signal transmitted from the satellite suffers from power loss due to the long transmission distance, the antenna polarization mismatch, the antenna de-pointing, and the atmospheric effects by the ionosphere and the troposphere. Considering these loss factors, the received power at the user receiver antenna can be calculated as follows:
3.1.4 Spectral efficiency
The RNSS signal is transmitted at the antenna through the HPA of the satellite payload, and various problems are introduced by the distortion caused by the nonlinearity of the HPA, and the out-of-band emission (OOBE) may be a critical problem depending on the frequency band. According to ITU (2015), the OOBE is the emission on a frequency or frequencies immediately outside the necessary bandwidth which is resulted by the modulation process. The RNSS signals share the same frequency band or adjacent band with other systems. Therefore, a strict restriction on the OOBE of the RNSS signals is required based on the following facts for the compatibility with other signals (Xue et al. 2015):
signals with relatively low OOBE power significantly mitigate signal distortion due to non-ideal filter characteristics, and
signals with relatively low OOBE power have low noise levels that meet stringent constraints. It also contributes to reducing the complexity and cost of designing satellite filters.
Meanwhile, the energy efficiency of the satellite is a key consideration because of their finite power source. Therefore, to minimize power loss caused by OOBE, a proper modulation method should be selected in consideration of the necessary frequency bandwidth. The power loss due to OOBE can be quantified by calculating the spectral efficiency :
∫
( )
(6)
where is the necessary frequency bandwidth (or receiver front end bandwidth in terms of the RNSS receiver), and ( ) is the normalized PSD.
Low spectral efficiency means that the power of the signal is distributed in the out-of-band region. Therefore, in signal design, spectral efficiency must be maximized to efficiently use the frequency resource and ensure compatibility with other services in the adjacent band.
Related signal design parameters: center frequency, chipping rate, modulation 3.2 Channel Related FoMs
In this part, we introduce the FoMs related to the transmission channel.
3.2.1 User received power
The RNSS signal transmitted from the satellite suffers from power loss due to the long transmission distance, the antenna polarization mismatch, the antenna de-pointing, and the atmospheric effects by the ionosphere and the troposphere. Considering these loss factors, the received power at the user receiver antenna can be calculated as follows:
( )
(
)
(7)
where is the transmitted power, is the transmit antenna gain, is the receiver antenna gain,
is the free space loss, is the loss due to the troposphere, is the loss due to the ionosphere, 3.1.4 Spectral efficiency
The RNSS signal is transmitted at the antenna through the HPA of the satellite payload, and various problems are introduced by the distortion caused by the nonlinearity of the HPA, and the out-of-band emission (OOBE) may be a critical problem depending on the frequency band. According to ITU (2015), the OOBE is the emission on a frequency or frequencies immediately outside the necessary bandwidth which is resulted by the modulation process. The RNSS signals share the same frequency band or adjacent band with other systems. Therefore, a strict restriction on the OOBE of the RNSS signals is required based on the following facts for the compatibility with other signals (Xue et al. 2015):
signals with relatively low OOBE power significantly mitigate signal distortion due to non-ideal filter characteristics, and
signals with relatively low OOBE power have low noise levels that meet stringent constraints. It also contributes to reducing the complexity and cost of designing satellite filters.
Meanwhile, the energy efficiency of the satellite is a key consideration because of their finite power source. Therefore, to minimize power loss caused by OOBE, a proper modulation method should be selected in consideration of the necessary frequency bandwidth. The power loss due to OOBE can be quantified by calculating the spectral efficiency :
∫
( )
(6)
where is the necessary frequency bandwidth (or receiver front end bandwidth in terms of the RNSS receiver), and ( ) is the normalized PSD.
Low spectral efficiency means that the power of the signal is distributed in the out-of-band region. Therefore, in signal design, spectral efficiency must be maximized to efficiently use the frequency resource and ensure compatibility with other services in the adjacent band.
Related signal design parameters: center frequency, chipping rate, modulation 3.2 Channel Related FoMs
In this part, we introduce the FoMs related to the transmission channel.
3.2.1 User received power
The RNSS signal transmitted from the satellite suffers from power loss due to the long transmission distance, the antenna polarization mismatch, the antenna de-pointing, and the atmospheric effects by the ionosphere and the troposphere. Considering these loss factors, the received power at the user receiver antenna can be calculated as follows:
( )
(
)
(7)
where is the transmitted power, is the transmit antenna gain, is the receiver antenna gain,
is the free space loss, is the loss due to the troposphere, is the loss due to the ionosphere,
(7)
where P
Tis the transmitted power, G
Tis the transmit
antenna gain, G
Ris the receiver antenna gain, L
FSLis the free
space loss, L
Tis the loss due to the troposphere, L
Iis the loss
due to the ionosphere, L
Pis the polarization mismatch loss,
and L
Dis the antenna de-pointing loss.
Kahee Han & Jong-Hoon Won Investigation on FoMs of Signal Performance
195
http://www.ipnt.or.kr The RNSS signals are vulnerable to the RF interference
due to their weak signal power. Also, if the received signal power is too weak, the receiver has a poor positioning accuracy. Therefore, in order to have a good robustness against the RF interference and high positioning accuracy, the RNSS signal must be designed to have high enough user received power in the same transmission channel.
Related signal design parameters: center frequency, transmit power, polarization
3.2.2 Tropospheric error
The lowest layer of the Earth's atmosphere, called the troposphere, consists of dry gas and water vapor. The RNSS signals are delayed by refraction by them, and the degree depends on the refraction index n of the atmosphere in the signal transmission path. The signal delays due to troposphere can be divided into drying delays due to dry air and wet delays due to water vapor. Wet delay and dry delay can be obtained by multiplying the mapping function (or obliquity factor) and the zenith delay. The total tropospheric delay can be obtained as shown in Eq. (8) and the detailed process for calculating it is explained in Spilker (1996b).
is the polarization mismatch loss, and is the antenna de-pointing loss.
The RNSS signals are vulnerable to the RF interference due to their weak signal power. Also, if the received signal power is too weak, the receiver has a poor positioning accuracy. Therefore, in order to have a good robustness against the RF interference and high positioning accuracy, the RNSS signal must be designed to have high enough user received power in the same transmission channel.
Related signal design parameters: center frequency, transmit power, polarization 3.2.2 Tropospheric error
The lowest layer of the Earth's atmosphere, called the troposphere, consists of dry gas and water vapor. The RNSS signals are delayed by refraction by them, and the degree depends on the refraction index of the atmosphere in the signal transmission path. The signal delays due to troposphere can be divided into drying delays due to dry air and wet delays due to water vapor. Wet delay and dry delay can be obtained by multiplying the mapping function (or obliquity factor) and the zenith delay.
The total tropospheric delay can be obtained as shown in Eq. (9) and the detailed process for calculating it is explained in Spilker (1996b).
( )
∫ ( )
∫ (8) where subscripts and refers to the dry and wet term, respectively, ( ) is the mapping function with respect to the elevation angle, and is the refractivity.
In the frequency band where navigation signals exist, since the troposphere is a non-dispersive medium, the refractivity is constant regardless of frequency and causes the same delay for code and phase. That is, the tropospheric delay has no dependency on the RNSS signal design parameters but the atmospheric condition of the transmission channel and the constellation of the satellites of the system.
Related signal design parameters: None 3.2.3 Ionospheric error
Unlike the troposphere, the ionosphere is a dispersive medium at several GHz. Therefore, the ionosphere has a different refractive index depending on the frequency. The ionospheric refractive index is determined by the carrier frequency and the polarization of the RNSS signal, and the process of calculating it is detailed in Hoque & Jakowski (2012). According to Klobuchar (1996), the ionospheric refractive index can be expressed simply as a function of and the total ionosphere delay considering the slant distance using the mapping function can be written as follows:
( ) (9)
where is the carrier frequency, is the total electron content.
Related signal design parameters: center frequency, polarization
(8) where subscripts d and w refers to the dry and wet term, respectively, M(E) is the mapping function with respect to the elevation angle, and N is the refractivity.
In the frequency band where navigation signals exist, since the troposphere is a non-dispersive medium, the refractivity is constant regardless of frequency and causes the same delay for code and phase. That is, the tropospheric delay has no dependency on the RNSS signal design parameters but the atmospheric condition of the transmission channel and the constellation of the satellites of the system.
Related signal design parameters: None 3.2.3 Ionospheric error
Unlike the troposphere, the ionosphere is a dispersive medium at several GHz. Therefore, the ionosphere has a different refractive index depending on the frequency. The ionospheric refractive index is determined by the carrier frequency and the polarization of the RNSS signal, and the process of calculating it is detailed in Hoque & Jakowski (2012). According to Klobuchar (1996), the ionospheric refractive index can be expressed simply as a function of 1/f
2and the total ionosphere delay considering the slant distance using the mapping function can be written as follows:
is the polarization mismatch loss, and is the antenna de-pointing loss.
The RNSS signals are vulnerable to the RF interference due to their weak signal power. Also, if the received signal power is too weak, the receiver has a poor positioning accuracy. Therefore, in order to have a good robustness against the RF interference and high positioning accuracy, the RNSS signal must be designed to have high enough user received power in the same transmission channel.
Related signal design parameters: center frequency, transmit power, polarization 3.2.2 Tropospheric error
The lowest layer of the Earth's atmosphere, called the troposphere, consists of dry gas and water vapor. The RNSS signals are delayed by refraction by them, and the degree depends on the refraction index of the atmosphere in the signal transmission path. The signal delays due to troposphere can be divided into drying delays due to dry air and wet delays due to water vapor. Wet delay and dry delay can be obtained by multiplying the mapping function (or obliquity factor) and the zenith delay.
The total tropospheric delay can be obtained as shown in Eq. (9) and the detailed process for calculating it is explained in Spilker (1996b).
( )
∫ ( )
∫ (8) where subscripts and refers to the dry and wet term, respectively, ( ) is the mapping function with respect to the elevation angle, and is the refractivity.
In the frequency band where navigation signals exist, since the troposphere is a non-dispersive medium, the refractivity is constant regardless of frequency and causes the same delay for code and phase. That is, the tropospheric delay has no dependency on the RNSS signal design parameters but the atmospheric condition of the transmission channel and the constellation of the satellites of the system.
Related signal design parameters: None 3.2.3 Ionospheric error
Unlike the troposphere, the ionosphere is a dispersive medium at several GHz. Therefore, the ionosphere has a different refractive index depending on the frequency. The ionospheric refractive index is determined by the carrier frequency and the polarization of the RNSS signal, and the process of calculating it is detailed in Hoque & Jakowski (2012). According to Klobuchar (1996), the ionospheric refractive index can be expressed simply as a function of and the total ionosphere delay considering the slant distance using the mapping function can be written as follows:
( ) (9)
where is the carrier frequency, is the total electron content.
Related signal design parameters: center frequency, polarization
(9) where f is the carrier frequency, TEC is the total electron content.
Related signal design parameters: center frequency, polarization 3.2.4 Multipath error
The multipath refers to a phenomenon in which the desired signal is reflected or diffracted to reach a receiver through two or more paths. The effects of the multipath depend on the amplitude, the delay, the phase, and the rate of change of the phase of the reflected signal with respect to the direct signal. The multipath signals can distort the correlation function of the direct signal, therefore the distorted discriminator output induces the pseudorange error. From this, we know that if the correlation function of the multipath is separated enough from the correlation function of the direct signal, there is no pseudorange error caused by the multipath. According to Misra & Enge (2012), if the multipath delay is greater than T
c(1+
d2), where T
cis the chip width in meters and d is the correlator spacing in chips, there is no distortion of the discriminator output and pseudorange error caused by the multipath. The pseudorange error E(τ
MP) caused by the multipath can be calculated as follows.
3.2.4 Multipath error
The multipath refers to a phenomenon in which the desired signal is reflected or diffracted to reach a receiver through two or more paths. The effects of the multipath depend on the amplitude, the delay, the phase, and the rate of change of the phase of the reflected signal with respect to the direct signal. The multipath signals can distort the correlation function of the direct signal, therefore the distorted discriminator output induces the pseudorange error. From this, we know that if the correlation function of the multipath is separated enough from the correlation function of the direct signal, there is no pseudorange error caused by the multipath. According to Misra & Enge (2012), if the multipath delay is greater than ( ), where is the chip width in meters and is the correlator spacing in chips, there is no distortion of the discriminator output and pseudorange error caused by the multipath. The pseudorange error (
) caused by the multipath can be calculated as follows.
(
)
(
) (10)
where
is the multipath delay and
is the discriminator output from a composite correlation function
( ). The composite correlation function is expressed as follows (Ward &
Betz 2006b):
( ) ( ) (
) ( ) (11) where is the code delay of the direct signal,
is the multipath delay, is the multipath to direct signal ratio (MDR), and is the relative phase difference between the direct signal and the multipath.
Related signal design parameters: chipping rate, modulation 3.3 Receiver Related FoMs
The received analog RF RNSS signal is converted to a digital IF signal through the front end of the receiver. The digital IF signal is used for the signal acquisition, the signal tracking, and the data demodulation, and finally the processing results are used to calculate the receiver's position. Therefore, it is required to analyze signal performance considering the front end and digital signal processing of the receiver.
3.3.1 Available signal power
The received RNSS signal at the receiving antenna on the surface of the Earth has a high frequency and a weak signal power. In addition, analog components are sensitive to the operating environment, so the RNSS receiver uses the front end to condition the incoming analog signal for digital signal processing (Misra & Enge 2012). The signal conditioning chain at the front end consists of filters, amplifiers, and an analog-to-digital converter (ADC), which induces a power loss called implementation loss in the received signal due to band-limiting, sampling, and quantization. The available signal power
, that is the signal power at the ADC output, can be calculated as follows:
(10)
where τ
MPis the multipath delay and Disc
compis the discriminator output from a composite correlation function R
comp(∙). The composite correlation function is expressed as follows (Ward & Betz 2006b):
3.2.4 Multipath error
The multipath refers to a phenomenon in which the desired signal is reflected or diffracted to reach a receiver through two or more paths. The effects of the multipath depend on the amplitude, the delay, the phase, and the rate of change of the phase of the reflected signal with respect to the direct signal. The multipath signals can distort the correlation function of the direct signal, therefore the distorted discriminator output induces the pseudorange error. From this, we know that if the correlation function of the multipath is separated enough from the correlation function of the direct signal, there is no pseudorange error caused by the multipath. According to Misra & Enge (2012), if the multipath delay is greater than ( ), where is the chip width in meters and is the correlator spacing in chips, there is no distortion of the discriminator output and pseudorange error caused by the multipath. The pseudorange error (
) caused by the multipath can be calculated as follows.
(
)
(
) (10)
where
is the multipath delay and
is the discriminator output from a composite correlation function
( ). The composite correlation function is expressed as follows (Ward &
Betz 2006b):