DOI : http://dx.doi.org/10.5394/KINPR.2011.35.9.729
Analysis of marine accident probability in Mokpo waterways
Kwang il Kim*, Gye-Kark Park**, †Jung Sik Jeong
* Graduate School, Division of Marine Transportation system, Mokpo Maritime University, Republic. of Korea
†, ** Division of Marine Transportation system, Mokpo Maritime University, Mokpo 530-729, Republic. of Korea
Abstract : The maritime risk assessment is important not only to evaluate the safety level of the ports and waterways but also to reduce potential maritime accidents at sea in terms of the proactive measures of the maritime accidents. In this paper, the collision risk assessment in Mokpo waterways has been carried out based on the IALA recommended model, IWRAP. To evaluate the accident probabilities in Mokpo waterways, all data of vessels were collected from AIS and Radar observations data and the computer simulations were carried out.
To assess the risk on the traffic, the scenario-base approach has been applied to the Mokpo waterway by using the maritime accident statics over the past 5 years.
Key words : accident probability, geometrical probability, causation probability, collision risk, AIS
* [email protected] 061)240-7550
** [email protected] 061)240-7164
†Corresponding author, [email protected] 061)240-7173
1. Introduction
The Mokpo waterways are geographically surrounded by many islands. Many fishing vessels and tugs across the waterways disturb the safe passage of vessels on the route.
The maritime risk assessment is important not only to evaluate the safety level of the ports and waterways but also to reduce maritime accidents at sea in terms of the proactive measures of the maritime accidents. However there are no quantitative risk assessment methods in Korea. The maritime safety assessment has been dependent on the qualitative method by some stakeholders including pilots, mariners.
Recently, the risk assessment for the maritime traffic in waterways has been carried out several researchers(Kim et al, 2010; Yim and Kim, 2010). Fujii and Macduff modelled systematically the maritime accident probabilities which were based on the geometrical approaches among the vessels on collision and grounding courses(Fujii Y, et.al., 1974; Macduff T, 1974). With minor modification of Fujii’s work, Pedersen evaluated the safety of navigation in many European waters(Pedersen P.T, 1995). Basically the IALA risk management tool, IWRAP(IALA Waterway Risk Assessment Programme), is theoretically based on Fujii and Macduff, and then evaluates quantitatively both collision and grounding risk in waterways(Peter Friis-Hansen, 2008; IALA, 2009). It is reported that the risk assessment by the IWRAP MK II agrees with the real situations in the European Waters
(Kujala P. et al, 2009; Ylitalo J., 2009).
In this paper, the collision risk of the maritime traffic in Mokpo waterways was evaluated based on the Pedersen model(Pedersen P.T, 1995) which also consist of a part of IWRAP model. Taking the maritime accidents statistics into account, the frequency of collisions is computed for crossing situations and head-on situations. Especially, all the traffic data are collected from AIS as well as Radar observations.
The accident probabilities are analyzed to determine the collision risk by the maritime traffic in the Mokpo waterways.
2. The traffic characteristics of Mokpo waterways
The vessels less than 100m including passenger ships, and towing vessels occupy more than 80% of maritime traffic in Mokpo waterways. Many fishing vessels navigate across the Mokpo waterways which are spatially restricted. In spring and autumn, the visibility of the waterways may be severely reduced. Fishing nets around the waterways may also be severe obstracles for the inbound and outbound vessels.
Those vessels may be frequently exposed a dangerous situation on the Mokpo port entrance route.
Figure 1 represents Mokpo waterways and the locations of the collision/grounding accidents for the last 5 years. As shown in Fig. 1, many vessels are encountered with crossing situations around Bulmugido.
Fig. 1 Mokpo waterways and the collision/grounding accident locations.
3. Risk modeling using ship traffic data
Marine accident probabilities are often modeled on basis of the works of Fujii and Macduff(Fujii Y et. al., 1974; Macduff T, 1974). Generally, the frequency of the collisions , is defined as Eq.(1).
× (1)
where is the geometrical number of collision candidates that are on a collision course. In other words, accidents would occur if no the manoeuvres for collision were ever made. is the causation factor that is the probability of failing to avoid the accident while being on a collision course.
From Eq.(1), it follows that corresponds to the number of vessels to be probably in collision among . Eq.(1) may be also used to calculate the frequency of grounding with where corresponds to the geometrical number of grounding candidates. In this paper, Eq.(1) is used to compute the frequency of collisions.
3.1 Determination of collision candidates in crossing
It is known that the number of crossing collision candidates is determined by Eq.(2)(Peter Friis-Hansen, 2008).
sin
(2)
for
where is the number of movements of ship class over the period of interest in waterway 1, is the number of
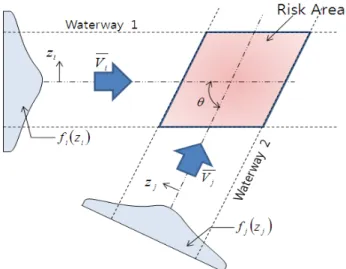
movements of ship class over the period of interest in waterway 2. In Fig. 2, the two vessels arriving from waterway 1 and waterway 2 are expected to be encountered.
The ship from waterway 1 approaches the ship on waterway 2 with the relative velocity, of crossing as Eq.(3).
cos (3)where is the velocity of vessel for ship class in waterway 1, is the velocity of ship class in waterway 2 and stands for the crossing angle between the two waterways.
Fig. 2 Crossing waterways with risk area of ship-ship collision
is the geometric collision diameter as illustrated in Fig. 3 and calculated by Eq.(4).
sin
sin
(4)
Fig. 3 Definition of geometrical collision diameter
where is the length of vessel in ship class in the waterway 1, is the length of vessel in ship class in the waterway 2. and are the breadth of vessel of ship class and , respectively.
3.2 Determination of collision candidates in head-on
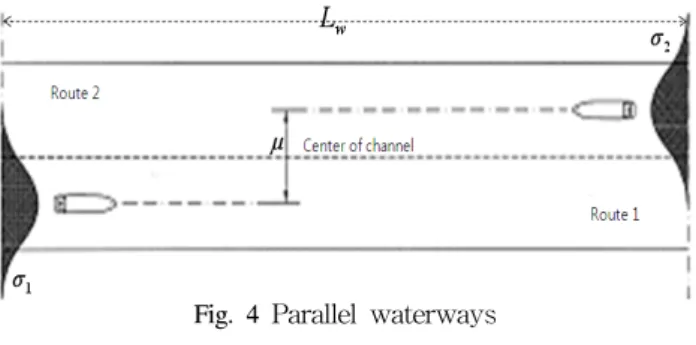
The number of head-on collision candidates is computed by Eq.(5).
(5)
where is the length of the waterway as shown in Fig. 4.
Fig. 4 Parallel waterways
is the probability that two ships will collide in a head on situation. This probability is expressed as Eq.(6).
(6) where is the standard normal distribution function of the random variable , is the mean sailing distance between the two vessels, is the standard deviation of the joint distribution, and
is the average vessel breadth.
3.3 Determination of causation factor
The causation factor, is the reduction factor with which the number of accident candidates has to be multiplied to get the estimated frequency of marine accidents. However,
is uncountable and then not tractable to calculate.
can be estimated by the scenario-based approach which is based on actual accidents or the synthesis approach which is calculated by Bayesian Belief Network(BBN) (Trucco et al, 2008). For simplicity, herein the scenario
approach is applied to obtain . Using the actual accidents over the last 5 years as shown in Table 1, the can be calculated as Eq.(7).
(7)
where is the number of maritime accidents calculated for the past 5 years and is the number of maritime traffic for the same period.
Table 1 Causation probability by scenario-based approach
Year
2006 35,857 3 ×
2007 37,241 3 ×
2008 42,408 3 ×
2009 42,958 4 ×
2010 58,646 1 ×
total 217,110 14 ×
On the other hand, it is found that , from the results of IWRAP, is higher than those estimated by the scenario-based approach. Table 2 shows the default causation factors in IWRAP for the encounter type. Actually the IWRAP uses the synthesis approach based on BBN.
Table 2 Default causation factors in IWRAP
Type of encounter
Head-on ×
Overtaking ×
Crossing ×
Bend ×
Merging ×
Grounding – forget to turn ×
4. Collision probability of Mokpo waterways
To evaluate the maritime accident probabilities in Mokpo waterways, the computer simulation using matlab has been carried out. The data of all vessels were collected from AIS and Radar observations for crossing and head-on situations.
were calculated from Eq.(2) and Eq.(5), respectively.
4.1 Crossing section : Around Bulmugido
As shown in Fig.5, many vessels are crossing the West-East passage.
Fig. 5 Crossing section in Mokpo Waterway
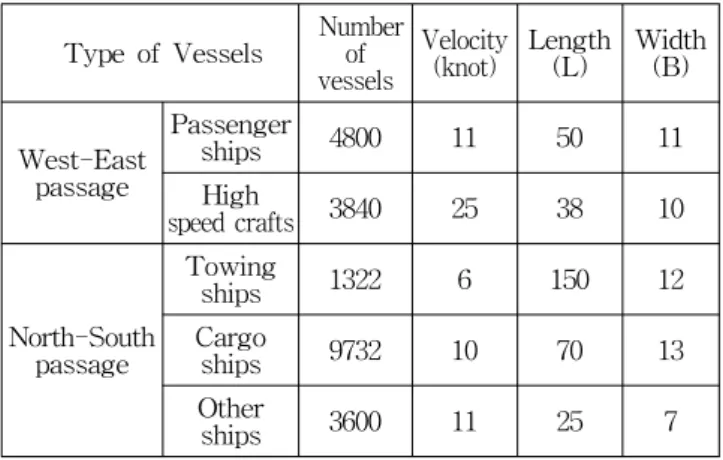
Mainly passenger ships and high speed crafts over 20knots are navigating on the route. Half of passenger ships from Mokpo-Gu are passing this fairway. The cargo ships occupy more than 60% of the vessels which are navigating northward or southward, and the towing ships 10%, otherships 30%. For West-East passage, most ships consist of passenger ships and encounter in crossing with North-South bound vessels. The number of vessels, average velocity, length, width of crossing section for a year are presented in Table 3.
Table 3 Vessels distribution observed in Mokpo Waterway
Type of Vessels Number of vessels
Velocity
(knot) Length (L) Width
(B)
West-East passage
Passenger
ships 4800 11 50 11
High
speed crafts 3840 25 38 10
North-South passage
Towing
ships 1322 6 150 12
Cargo
ships 9732 10 70 13
Other
ships 3600 11 25 7
The collision candidates, are calculated by Eq.(2) then
for the cross section in Fig. 5 is presented in Table 4.
Table 4 Collision candidates of crossing section sorted by ship types
West-East passage North-South passage Passenger
ships
High speed crafts
Towing ships
Cargo ships
Other ships
64 38 23 66 14
in the crossing section is calculated by Eq.(1). The results are presented in Table 5. From Eq.(1) and Table 5,
stands for the frequency of collisions among . Using the scenario based , is two times as high as the IWRAP default one. It is questionable for the reason why has big difference between the scenario-based approach and the synthetic approach adopted in the IWRAP. However, it should be noted that considers human elements and other environmental factors when it is calculated by BBN (Trucco P. et al, 2008). As mentioned in section 3.3, the IWRAP uses BBN to calculate .
Table 5 Frequency of collision for crossing situations in Mokpo Waterways
205
×
(scenario-based approach) 0.013
×
(synthesis approach : IWRAP) 0.027
4.2 Head-on section : around Mokpo bridge
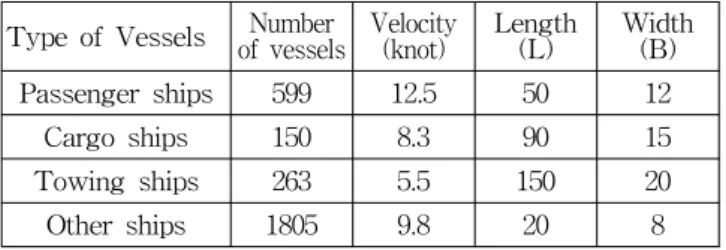
Figure 6 shows the head-on section around Mokpo bridge, the passenger ships occupy 20%, the towing ships 10%, cargo ship 5%, other ships 65%. The number of vessels, velocity, length, width of crossing section for 1 year also are presented in Table 6. The daily data was collected for the traffic peak time, 08:00~12:00 hours.
Fig. 6 Head-on section of Mokpo waterway Table 7 shows , which is calculated by Eq.(5) and represents the collision candidates in the head-on section sorted by ship types. Using , the frequency of collisions
in Mokpo waterway is calculated by Eq.(1). and presented in Table 8.
Table 6 Ships navigating around head-on section Type of Vessels Number
of vessels Velocity
(knot) Length
(L) Width (B)
Passenger ships 599 12.5 50 12
Cargo ships 150 8.3 90 15
Towing ships 263 5.5 150 20
Other ships 1805 9.8 20 8
Table 7 Collision candidates in the head-on section sorted by ship types
Passenger
ships Cargo ships Towing ships Other ships
50 23 34 534
Table 8 Frequency of Collisions for head-on situations in Mokpo Waterways
714
×
(scenario-based ) 0.046
×
(IWRAP default ) 0.036
5. Conclusions
It is expected that the maritime risk assessment in Mokpo waterway contributes to the improvement of the safety and environment protection at sea by taking the proactive measures against potential risks at sea. Our approach is based on the IALA model-IWRAP. However, we used the collision accident statistics to compute the causation factor and then the collision frequency, while the IWRAP uses the BBN. Our approach was applied to assess the collision risk in Mokpo waterways. The causation factor is a key parameter to determine the collision frequency for a certain waterway, even though the collision candidates are apparently affected by the number of movements of ships due to its geometric model. It is not tractable to obtain the accurate causation factor due to human elements which affects vessel maneuver. Regardless of this, our approach helps to decide the potential risk for a collision in the Mokpo waterway by using the statistical data of the past accidents.
The frequency of collisions by the scenario based approach has been found to be less than IWRAP default value. To increase the reliability of the collision frequency, the casuation factor should be modelled by considering not only the vessel velocity, vessel traffic density, but also sea conditions, weather conditions, other human elements.
Acknowledgement
This research was a part of the project titled
"Development of the Intelligent Technology for Marine Accident Protection & Salvage" funded by the Ministry of Land, Transport and Maritime Affairs, Republic of Korea.
References
[1] Fujii Y, Yamanouchi H, Mizuki N(1974). "Some factors affecting the frequency of accidents in marine traffic.", Journal of Navigation, Vol.27, pp.239-247.
[2] IALA(2009), IALA Risk Management Tool for Ports and Restricted Waterways, IALA Recommendation O-134, Ed.1.1, pp.18-22.
[3] Kim, D. W., Park, J. S., Park, Y. S.(2010), "Comparison Analysis between the IWRAP and the ES Model in Ulsan Waterway," Journal of Navigation and Port Research, Vol.35, No.4, pp.281-287.
[4] Kujala P, Hanninen M, Arola T, Ylitalo Jutta, (2009),
"Analysis of Maritime Traffic Safety in the Gulf of Finland," Reliability Engineering and System Safety 94, pp.1349-1357.
[5] Macduff T(1974). "The probability of vessel collisions.", Ocean Industry, pp.144-148.
[6] Pedersen P.T(1995), "Collision and Grounding Mechanics,"
Proc. WEMT, Copenhagen, vol.1, pp.125-157.
[7] Peter Friis-Hansen (2008), "Basic Modelling Principles for Prediction of Collision and Grounding Frequencies,"
IWRAP MK II, working document, pp.1-59.
[8] Trucco P, Cagno E, Ruggeri F, Grande O(2008), "A Bayesian Belief Network modelling of organizational factors in risk analysis: A case study in maritime transportation," Reliability Engineering and System Safety 93, pp.823-834.
[9] Yim, J. B. and Kim, D. H.(2010), "Statistical Parameter Estimation to Calculate Collision Probability Between Mokpo Harbour Bridge and Passing Vessels," Journal of Navigation and Prot Research, Vol.34, No.8, pp.609-614.
[10] Ylitalo Jutta(2009), “Modelling Marine Accident Frequency” Aalto University the degree of Master of Science in Technology.
Received 27 September 2011 Revised 1 November 2011 Accepted 8 November 2011