• 검색 결과가 없습니다.

The growth and yield changes of foxtail millet (Setaria italic L.), proso millet (Panicum miliaceum L.), sorghum (Sorghum bicolor L.), adzuki bean (Vigna angularis L.), and sesame (Sesamum indicum L.) as affected by excessive soil-water

N/A
N/A
Protected

Academic year: 2021

Share "The growth and yield changes of foxtail millet (Setaria italic L.), proso millet (Panicum miliaceum L.), sorghum (Sorghum bicolor L.), adzuki bean (Vigna angularis L.), and sesame (Sesamum indicum L.) as affected by excessive soil-water"

Copied!
13
0
0

로드 중.... (전체 텍스트 보기)

전체 글

(1)

OPEN ACCESS

Citation: Chun HC, Jung KY, Choi YD, Lee SH, Kang HW. 2016. The growth and yield changes of foxtail millet (Setaria italic L.), proso millet (Panicum miliaceum L.), sorghum (Sorghum bicolor L.), adzuki bean (Vigna angularis L.), and sesame (Sesamum indicum L.) as affected by excessive soil-water. Korean Journal of Agricultural Science 43:547-559.

DOI: https://doi.org/10.7744/kjoas.20160056 Editor: Taek-Keun Oh, Chungnam National University, Korea

Received: June 14, 2016 Revised: September 2, 2016 Accepted: September 13, 2016 Copyright: ©2016 Korean Journal of Agricultural Science.

This is an Open-Access article distributed under the terms of the Creative Commons Attribution Non- Commercial License which permits unrestricted non- commercial use, distribution, and reproduction in any medium, provided the original work is properly cited.

PLANT & FOREST

The growth and yield changes of foxtail millet (Setaria italic L.), proso millet (Panicum miliaceum L.), sorghum (Sorghum bicolor L.), adzuki bean (Vigna angularis L.), and sesame (Sesamum indicum L.) as affected by excessive soil-water

Hyen Chung Chun*, Ki Yuol Jung, Young Dae Choi, Sang Hun Lee, Hang Won Kang

Crop Production Technology Research Division, National Institute of Crop Science, RDA, Miryang 50424, Korea

*Corresponding author: [email protected]

Abstract

The objectives of this study were to investigate the effects of excessive soil-water on crop growth and to predict decrease of yields caused by excessive soil-water. The following five crops were selected for investigation: foxtail millet, proso millet, sorghum, adzuki bean, and sesame. These were planted in pots and a soil-water table was set to 10cm for 10 days. Crop susceptibility (CS) factors and stress-day indexes (SDI) were calculated for each crop to estimate effects of excessive soil-water. SDI models were calculated using CS and SDI data for each crop and predicted the yields of crops cultivated in paddy fields. All crops were cultivated in paddy fields with different soil water contents to evaluate the yield-SDI models.

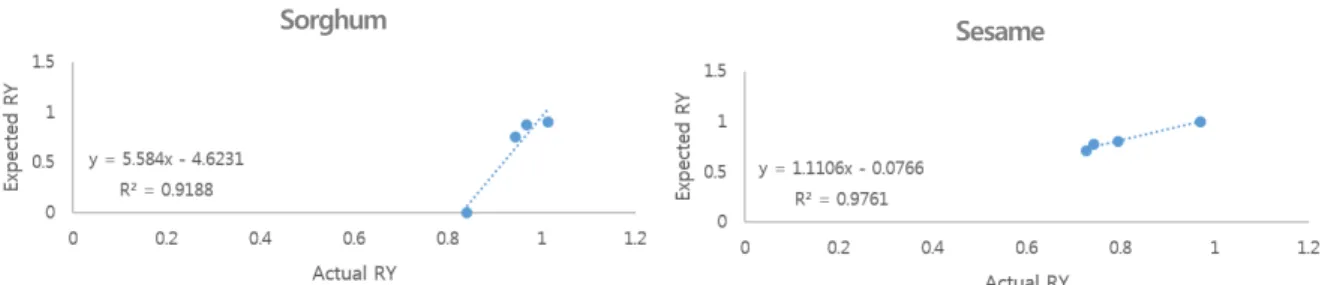
Results showed that yields decreased most when crops were affected by excessive soil-water at the early development stage. Decrease of yields was the greatest when the excessive soil-water treatment was applied at early growth stage. In the field experiment, crops from soils with the greatest soil-water content had the smallest yield, while ones from soils with the smallest soil water contents showed the greatest yields. Observed yields from the field and predicted yields from SDI models showed the least correlation for proso millet, foxtail millet, and adzuki bean and the greatest correlation for sesame . In conclusion, proso millet, foxtail millet, and adzuki bean were more susceptible to soil water than other crops, while sorghum and sesame were more suitable to cultivation in paddy fields.

Keywords: crop susceptibility, excessive soil-water, stress-day index

Introduction

Accurate and optimal water supply to cereal crops is critical in growing and producing maximum

yields. Excessive soil-water can cause nutrient and oxygen deficiency (Cannel et al., 1980), limit

the germination of seeds (Fausey et al., 1985), induce the dying of young plants (Lee et al., 2010),

reduce root growth/plant height (Lee et al., 2010), reduce yields (Belford et al., 1985), and increase

(2)

susceptibility to disease (Belford et al., 1992). These effects are caused by the depletion of oxygen or oxygen diffusion in soils. In addition, microbial growth increases, which can cause the formation of sulfides and butyric acid that are toxic to plants, and the potential for root diseases is increased (Ashraf and Rehman, 1999). These negative effects by excessive soil-water result in a reduced yield reliability and suboptimal production.

In Korea, many paddy fields have generally high groundwater levels or greater soil-water contents compared to general uplands because rice requires flooded conditions during cultivation. The area of paddy fields in Korea is 934,000 ha, which is more than 55% of total arable lands (NSO, 2015). Most of these paddy field soils have low infiltration rates and poor drainage properties (Jung et al., 2011). Recently, the Korean government decided to support cereal crop cultivation in paddy fields to reduce overproduction of rice. Crops cultivated in paddy fields have shown physiological stress caused by excessive soil-water or high groundwater level (Jo et al., 1996; Ji et al., 2009). There is a need to overcome excessive soil-water problems for cereal crops. Therefore, it is necessary to fully understand crop responses to excessive soil-water conditions in paddy field soils.

In case of excessive soil-water conditions, Hiler (1969) introduced the stress day index (SDI) to quantify the cumulative stresses imposed on crops by water. Researchers studied yield-SDI relationships in several crops: corn (Hiler and Clark, 1971; Ahmad and Kanwar, 1989; Mallikarjunaswamy et al., 1999), soybean (Purwanto et al., 1993), and cotton/wheat (Kandil et al., 2001). This yield-SDI relationship is based on crop susceptibility (CS) factors (Lewis et al., 1974; Howell and Hiler, 1975; Hardjoamidjojo et al., 1982). CS factors describe the plant’s susceptibility (or response) to environmental stresses and depend upon the species and the stage of development of a given crop. CS factors have been investigated for various physiological growth stages of corn and soybean under excessive soil-water or flooded conditions in various studies (Evans and Skaggs, 1984; Mukhtar et al., 1990; Evans et al., 1990; Purwanto et al., 1993). Evans et al. (1990) proposed the concept of NCS (Normalized Crop Susceptibility) factors to eliminate the effects of environmental elements other than flooding, such as, genotype, soil type, fertility, and temperature. NCS values were applied to yield-SDI relationships instead of CS factors and determined the reduction degree of corn and soybean yields and effects on crop growth under excessive soil water stress (Evans et al., 1990). CS and SDI concepts have been applied to soybean cultivated in paddy fields in Korea (Jung et al., 2011), but there has been no attempt to use the yield-SDI model to predict yields under excessive soil-water conditions.

The objectives of this study were to evaluate excessive soil-water stress to cereal crops by using CS factors at various growth stages and evaluate the use of the yield-SDI model to predict cereal crop yield from paddy fields with various soil-water contents or groundwater table levels.

Materials and Methods

Yield-SDI (Stress-Day Index) model

The SDI concept is determined from the stress day (SD) factor and the CS factor. The SD factor is a measure of the intensity and duration of stress. The CS factor is a measure of the crop susceptibility to a unit of stress and is a function of the crop species and its stage of development. Hiler (1969) defined the SDI as

SDI  

i   n

SD

× CS

(1)

where n is the number of growth stages and SD and CS are the stress day and crop susceptibility factors, respectively,

(3)

for period i. The SD values can be replaced by SEW

30

values. SEW

30

(cm-day) represents the sum of groundwater level differences when it exceeds a depth of 30 cm, because Sieben (1964) considered the depth of 30 cm to be the critical excessive groundwater level for crops.

Sieben (1964) proposed crop yields to changes of groundwater table depths as

SEW



 

i   n

  X

i

 (2)

where x

i

is the groundwater table depth below the soil surface on day i, and n is the number of days in the period being considered. The CSi is defined as the yield reduction ratio per unit of SDi at a given excessive soil water stress in i –the growth stage. Hiler (1969) expressed CSi as

CS

  x x  x

(3)

where Xi is the yield from a treatment subjected to a unit water stress during i –the growth stage, and X is yield when a crop is kept under no water stress throughout the season. Later, Evans and Skaggs (1984) suggested the concept of NCS factor by normalizing CS factors to reduce the sensitivity of the CS factors to stress duration.

NCS

 

i   n

CS

CS

(4)

where n is the number of growth stages. The relationship between crop yield and SDI can be determined based on CS factors using regression analysis. The generalized yield-SDI relationship determined from simple linear regression by

Y

 Y

 a × SDI

(5)

where Yj is the absolute yield (kg·ha-1) observed in year j, Yp is the potential or base maximum yield that would occur in the absence of any soil-water related stress, a is the yield reduction per unit of SDI (slope of regression line), and SDIj is computed from eq.(1) using CS or NCS values. The relative yield (RY) was calculated by

RY

  Y

Y

   b× SDI

(6)

where RYj is the relative yield, which is expressed as a percent of potential yield and b is the RY reduction per unit of SDI. Experimental site

The pot and field experiments were conducted to investigate responses of five crops to excessive soil-water conditions at National Institute of Crop Science, Crop Production Technology Research Division in Miryang, Gyeongnam, Korea. Foxtail millet (Setaria italica L.), proso millet (Panicum miliaceum L.), adzuki bean (Vigna angularis L.), and sorghum (Sorghum bicolor L.) were tested in 2013, and sesame (Sesamum indicum L.) was tested in 2015.

1) CS factor experiments

The CS experiments were conducted to investigate the response of excessive soil-water at five growth stages;

tillering, booting, flowering, milk development, and ripening (Zadoks growth scale, Zadoks et al., 1974). Each crop was

planted in a wagner pot (1·5000

-1

) filled with silt loam soils with chemical fertilizer as a basal manure. Each crop was

(4)

planted in a pot with five replicates for each growth stage. A total of 30 pots for one crop were prepared including five pots with no stress treatments. All pots were managed with adequate watering, and growth stages were observed. Five pots were placed in bigger pots (1·2000-1) filled with water when the plants achieved each growth stage. Excessive soil-water treatment was applied by keeping the water level in these pots at a 10 cm depth for 10 days (Fig. 1). After 10 days, pots with crops were pulled out from water and the crops grew until harvest. The growth characteristics and yield components were measured from every pot.

Fig. 1. Pictures of a CS experiment with groundwater level of 10 cm in wagner pots: (A) A diagram of the CS experiment, and (B) An actual picture of the CS experiment with sesame.

2) Field experiments

The field experiments were performed in paddy fields in Miryang, Gyeonam. The soil of the experimental field was classified as Gagog series (fine silty, mixed, nonacid, mesic family of Aeric Endoaquepts). The paddy fields were divided into two plots by drainage class; poorly and somewhat poorly drained (Fig. 2). The size of each plot was 30 m by 50 m. The characteristics of the soils from the two plots are shown in Table 1. Two different drainage systems were applied to alleviate effects of excessive soil-water in a plot: open ditch and pipe drainage system (Fig. 2). The open ditch was a 30 cm wide and 30 cm deep trench along one side of the plot and the pipe drainage was buried 50 cm deep along a side of the plot. A total of 4 subplots were placed in the site.

In 2013, sorghum, foxtail millet, proso millet, and adzuki bean were cultivated in each subplot of the experimental site as shown in Fig. 2. Sesame was cultivated in 2015 in each subplot. In each subplot, soil-water contents were measured by soil moisture probe (Easy AG, Sentek Pty. Ltd., Stepney, Australia) at 20 cm depth from the soil surface.

Levels of groundwater were measured by sensors with automatic water level recorders (Remote Data Systems, Inc, NC, USA) from 0 cm to 150 cm. All measurements were applied for all four subplots and measured every hour during the growing seasons.

A B

(5)

Fig. 2. Layout of drainage systems and measuring points of soil water content and groundwater level at each plot.

Table 1. Soil properties of the experimental field by soil horizon.

Horizon Depth

(cm)

Bulk density (Mgm

-3

)

Porosity

(%) Texture class

Ap1 0 - 10 1.18 55.5 loam

Ap2 10 - 20 1.55 41.4 loam

Ag 20 - 24 1.62 38.8 loam

Bg 24 - 35 1.60 39.7 sandy loam

BCg 35- 1.60 39.6 sandy loam

Statistical analyses

All data from experiments were analyzed statistically by analysis of variance (ANOVA) and Duncan’s multiple range test at 90% using SPSS v20 (SPSS Inc., Chicago, IL, USA).

Results and Discussions

CS and NCS factors

The CS and NCS factors were determined from the yields of sorghum, foxtail millet, proso millet, adzuki bean, and sesame according to the controlled excessive soil-water condition (Table 2). The crops had the greatest decreases in yields when the excessive soil-water was applied at the tillering stage and the least yield decrease when the excessive soil-water was applied at the ripening stage. The CS and NCS factors from the five crops were calculated from Equations (3) and (4) and the results are shown in Table 2 & 3. The CS and NCS factors had similar trends across growth stages for all the crops, except sesame. The yields decreased statistically less than the yields in no water stress treatments (p < 0.1) where the excessive soil-water was applied at the later growth stage. The yields and CS factors of sesame from the milk development and ripening stages showed opposite results to other crops’. However, there was no statistical difference in the values between the milk development and ripening stages (p > 0.1).

Evans et al. (1986) discussed that NCS factors are more insensitive to crop variety or to environmental factors. NCS

(6)

factors reduced variations of the CS factor values across growth stages and crops. Therefore, the NCS factors were applied instead of CS factors in this study. The SDI values for five crops were calculated by Equation (1) (Table 4). The RY values were calculated using yields with no water stress and yields at each growth stage. Previous studies calculated the yield-SDI model from field data, but model accuracy was lower than 80% (Ahmad and Kanwar, 1989; Evans et al., 1991; Purwanto et al., 1993; Kandil et al., 2001). In this study, CS factors and yield-SDI models were calculated from the indoor and fully controlled experiment (pot experiments) to improve the precision of model predictions. All data from CS experiments were applied to the yield-SDI models using Equation (5) and. (6). The fit and results of model calculations are shown in Fig. 3. The r

2

values of the models were greater than 80% except the one for adzuki bean. This result showed better fit results than the previous studies that calculated the yield-SDI models from actual field data.

Shaw (1974) and Sudar et al. (1979) proposed zero threshold stress levels which means no yield from crops under drought condition. Evans et al. (1991) applied this concept to yield-SDI model under excessive soil-water condition and Table 2. Yields of five crops with excessive water stress at five growth stages (Zadoks growth scale) and no water stress.

Relative yields (RY) were calculated using yields from each growth stage and yields from no water stress.

Crop Growth stage Yield (g·pot

-1

) RY

Sorghum Tillering 18.94 ± 3.87f 0.43 ± 0.09f

Booting 24.84 ± 0.50e 0.56 ± 0.01d

Flowering 27.71 ± 0.64d 0.63 ± 0.01c

Milk development 34.33 ± 0.77c 0.77 ± 0.02b

Ripening 37.22 ± 0.02b 0.84 ± 0.04a

No stress 44.32 ± 1.77a 1

Foxtail millet Tillering 10.64 ± 1.71f 0.27 ± 0.04f

Booting 15.17 ± 2.36e 0.39 ± 0.06d

Flowering 19.58 ± 0.64d 0.50 ± 0.02c

Milk development 27.48 ± 1.65c 0.71 ± 0.04b

Ripening 33.20 ± 0.82b 0.85 ± 0.02a

No stress 38.96 ± 0.82a 1

Proso millet Tillering 2.72 ± 0.36f 0.16 ± 0.02c

Booting 4.99 ± 0.52e 0.30 ± 0.03b

Flowering 5.82 ± 0.40d 0.35 ± 0.02b

Milk development 7.85 ± 1.43c 0.47 ± 0.09b

Ripening 12.05 ± 0.83b 0.72 ± 0.05a

No stress 16.63 ± 2.62a 1

Adzuki bean Tillering 1.67 ± 0.81b 0.29 ± 0.14

Booting 2.78 ± 1.35b 0.48 ± 0.23

Flowering 3.13 ± 0.79b 0.54 ± 0.14

Milk development 3.44 ± 0.50a 0.60 ± 0.26

Ripening 4.14 ± 0.85a 0.72 ± 0.15

No stress 5.76 ± 0.46 1

Sesame Tillering 2.19 ± 0.61c 0.61 ± 0.03d

Booting 2.81 ± 0.39c 0.71 ± 0.02c

Flowering 3.18 ± 0.26b 0.87 ± 0.05b

Milk development 3.48 ± 0.23b 0.95 ± 0.01a

Ripening 3.70 ± 0.28a 0.94 ± 0.08a

No stress 3.75 ± 0.54a 1

Different letters within the same column are statistically different at 90%.

(7)

Table 3. CS and NCS factors of five crops with excessive water stress at five growth stages and no water stress.

Crop Growth stage CS NCS

Sorghum Tillering 0.57 ± 0.09a 0.32 ± 0.05a

Booting 0.44 ± 0.01b 0.25 ± 0.01b

Flowering 0.37 ± 0.01c 0.21 ± 0.01c

Milk development 0.23 ± 0.02d 0.12 ± 0.01d

Ripening 0.16 ± 0.04e 0.09 ± 0.02e

Foxtail millets Tillering 0.84 ± 0.02a 0.28 ± 0.01a

Booting 0.70 ± 0.03b 0.23 ± 0.01b

Flowering 0.65 ± 0.02c 0.22 ± 0.01b

Milk development 0.53 ± 0.09d 0.18 ± 0.03b

Ripening 0.28 ± 0.05e 0.09 ± 0.02c

Proso millets Tillering 0.73 ± 0.04a 0.32 ± 0.02a

Booting 0.61 ± 0.06b 0.27 ± 0.03a

Flowering 0.50 ± 0.02c 0.22 ± 0.01b

Milk development 0.29 ± 0.04d 0.13 ± 0.02c

Ripening 0.15 ± 0.02e 0.06 ± 0.01d

Adzuki bean Tillering 0.71 ± 0.14 0.30 ± 0.06

Booting 0.52 ± 0.23 0.22 ± 0.10

Flowering 0.46 ± 0.14 0.19 ± 0.06

Milk development 0.40 ± 0.26 0.17 ± 0.09

Ripening 0.28 ± 0.15 0.12 ± 0.06

Sesame Tillering 0.41 ± 0.02a 0.39 ± 0.02a

Booting 0.28 ± 0.04b 0.27 ± 0.04b

Flowering 0.18 ± 0.02c 0.17 ± 0.02c

Milk development 0.08 ± 0.03d 0.07 ± 0.03d

Ripening 0.11 ± 0.02d 0.10 ± 0.02d

Different letters within the same column are statistically different at 90%.

Fig. 3. Yield-SDI models from five crops: a. sorghum, b. foxtail millet, c. proso millet, d. adzuki bean, and e. sesame.

(8)

set the SDI value at yield = 0 (SDI

0

) as a threshold of excessive water stress in yields. Evans et al. (1991) suggested the SDI

0

value for corns was 141 cm-day and SDI

0

value of soybeans was 154 cm-day. If SDI values for corn were greater than 141 cm-day, yield-SDI model were set as y = 0. In this study, SDI

0

values were calculated from the yield-SDI model (Fig. 3). The sorghum SDI

0

values was 112 cm-day, proso millet was 67 cm-day, foxtail millet was 87 cm-day, adzuki bean was 78.6 cm-day, and sesame was 270 cm-day. This result meant that proso millet was more vulnerable to excessive soil-water compared to other cereal crops, followed by Foxtail millet. On the other hand, sesame was most tolerant to the excessive soil-water condition.

Evaluation of the yield-SDI model

Jung et al. (2014) reported the same results from their wet injury tests of crop cereals in paddy fields. They concluded that the degree of wet injury of five cereal crops were proso millet > foxtail millet > adzuki bean > sorghum. In this study, proso millet was most vulnerable to wet injury followed by adzuki bean.

The yield-SDI model from each crop was applied to actual yields from paddy fields for evaluation. Average values of groundwater levels and soil-water from the paddy field of all treatments are shown in Table 5. In 2013 and 2015, somewhat poorly drained paddy fields with a pipe drainage treatment had the lowest groundwater level and soil-water throughout the growing seasons. The poorly drained paddy field with an open drainage treatment had the highest Table 4. Stress-day indexes (SDI) of five crops with excessive water stress at five growth stages and no water stress.

Crop Growth stage SDI

Sorghum Tillering 64.60

Booting 49.57

Flowering 42.29

Milk development 25.45

Ripening 18.09

Foxtail millets Tillering 63.83

Booting 53.61

Flowering 43.69

Milk development 25.88

Ripening 12.99

Proso millets Tillering 56.00

Booting 46.87

Flowering 43.34

Milk development 35.35

Ripening 18.43

Adzuki bean Tillering 59.97

Booting 43.74

Flowering 38.54

Milk development 33.96

Ripening 23.78

Sesame Tillering 116.34

Booting 80.72

Flowering 50.88

Milk development 21.63

Ripening 30.41

(9)

groundwater level and soil-water (Fig. 4). These conditions led to the greatest stress of excessive soil-water to crops in the poorly drained paddy field with an open drainage treatment while they led to the smallest stress to crops in the somewhat poorly drained paddy field with a pipe treatment.

Table 5. Hydrological properties from paddy fields of two drainage classes and two drainage treatments.

Drainage class

Drainage treatment

Groundwater Level (-cm)

Soil-water (mm·m

-1

)

2013 Poorly open 14.08 ± 7.45ab 34.0 ± 5.59ab

pipe 42.19 ± 29.37a 29.7 ± 3.25a

Somewhat poorly

open 31.94 ± 12.30b 30.4 ± 4.24b

pipe 76.15 ± 22.38ab 26.7 ± 2.57ab

2015 Poorly open 28.80 ± 24.36ab 31.98 ± 7.37a

pipe 58.37 ± 23.84a 29.43 ± 9.25a

Somewhat poorly

open 37.03 ± 27.00ab 24.23 ± 6.69ab

pipe 68.33 ± 22.97a 23.54 ± 5.57ab

Different letters within the same column are statistically different at 90%.

(a) (b)

Fig. 4. Groundwater levels from paddy fields for all treatment in 2013 (a) and 2015 (b); poorly drained-open was a poorly drained field with open ditch drainage treatment, poorly drained-pipe was a poorly drained field with pipe drainage treatment, somewhat poorly drained-open was a somewhat poorly drained field with open ditch drainage treatment, and somewhat poorly drained-pipe was a somewhat poorly drained field with pipe drainage treatment.

There was no significant difference across drainage treatments in crop yields from foxtail millet, proso millet, and

adzuki bean (p > 0.1, Table 6). Sorghum and sesame showed a significant difference between poorly drained fields with

open drainage and somewhat poorly drained fields with pipes (p < 0.1). The average yield of each crop from no water

stress cultivation in uplands was 330 kg·10 a

-1

for sorghum, 298 kg·10 a

-1

for foxtail millet, 257 kg·10 a

-1

for proso

millet, 104 kg·10 a

-1

for adzuki bean, and 90 kg·10 a

-1

for sesame (NSO, 2013). Foxtail millet from paddy fields resulted

in a 20% to 50% reduction of yields and proso millet to a 40 % to 60% reduction compared to the average yields from

uplands. However, sorghum and sesame did not show a reduction in yields compared to the average yields from

uplands. As discussed above, foxtail millet and proso millet were more vulnerable to excessive soil-water conditions

than sesame and sorghum. In table 7, SDI values for each crop were calculated as per Equation (1). Proso millet and

adzuki bean from all drainage classes and drainage treatments had greater SDI values than the SDI

0

value. Foxtail millet

had only one SDI value which was greater than SDI

0

. Therefore, the yield-SDI model of proso millet, foxtail millet, and

adzuki bean expected no yield under this condition. Based on SDI values, proso millet, foxtail millet, and adzuki bean

(10)

had the most significant damage from excessive soil-water. The yield results also confirmed that there was no difference from proso millet, foxtail millet, and adzuki bean (p > 0.1). They all had wet injury across all treatments. Sorghum and sesame yield data were applied to calculate the relative yield (actual RY) and the yield-SDI models calculated expected relative yield (expected RY).

Table 6. Average and standard deviation values of yields from five crops from all treatments.

Drainage class

Drainage treatment

Yield (kg·10a

-1

)

Sorghum Foxtail millet Proso millet Adzuki bean Sesame Poorly open 277.46 ± 18.30b 235.66 ± 63.58 148.43 ± 62.58 133.96 ± 73.8 83.5.02 ± 19.89b

pipe 319.41 ± 13.67 272.05 ± 30.97 178.19 ± 39.05 212.52 ± 58.04 91.73 ± 17.86 Somewhat

poorly

open 331.16 ± 20.21 242.70 ± 39.52 158.72 ± 65.50 139.26 ± 36.78 85.59 ± 17.05 pipe 334.48 ± 16.96a 279.21 ± 47.97 183.80 ± 36.57 197.56 ± 32.78 106.10 ± 20.32a Different letters within the same column are statistically different at 90%.

Table 7. Stress-day indexes (SDI) calculated from Eq. (1) for sorghum, foxtail millet, proso millet, and adzuki bean in 2013 and sesame in 2015. Relative yields (RY) were calculated from actual yields and optimum yields of sorghum, foxtail millet, proso millet, adzuki bean, and sesame grown in the experimental site.

Drainage class

Drainage treatment

SDI (cm-day)

Sorghum Foxtail millet Proso millet Adzuki bean Sesame

Poorly open 119.74 677.09 1064.80 1388.56 116.14

pipe 14.03 173.28 230.23 190.31 71.02

Somewhat poorly

open 27.68 254.14 304.20 342.01 36.76

pipe 11.07 74.56 87.03 98.75 0

Drainage class

Drainage treatment

RY

Sorghum Foxtail millet Proso millet Adzuki bean Sesame

Poorly open 0.84 0.50 0.45 0.58 0.83

pipe 0.96 0.76 0.54 0.91 0.85

Somewhat poorly

open 0.93 0.53 0.48 0.59 0.91

pipe 1.11 0.78 0.55 0.84 1.11

Sorghum and sesame showed a fit with r

2

> 90% between actual RY and the expected RY (Fig. 5). Evans et al. (1991)

and Purwanto et al. (1993) evaluated the yield-SDI models of corns and soybeans compared to actual field yields. Their

best fitting results were found to range between r

2

values of 60 and 80%. Both studies determined their models based on

field data instead of controlled experiment data. Previous studies reported that sorghum is one of the most tolerant crops

to excessive soil-water compared to other cereal crops (Jung et al., 2013). Wei et al. (2013) reported that sesame has a

severe sensitivity to waterlogging condition. But in this study, sesame had a slope value of 0.0039 from yield-SDI

model while sorghum had one of 0.0146. In other word, yield decrease of sesame was less than that of sorghum as SDI

increased. This result meant that sesame was more tolerant to wet injury than sorghum.

(11)

Fig. 5. Relations between expected yields calculated using Eq. (6) and actual RY (Table 7) of sorghum (top) and sesame (bottom).

Conclusions

This study evaluated the effect of excessive soil-water or high groundwater level conditions on yields of five cereal crops. The yield-SDI model was adopted to evaluate the effect of excessive soil-water and predict yields under excessive soil-water or high groundwater conditions. The model was useful for certain crops such as sorghum and sesame, which had relatively greater tolerance to excessive soil-water. However, the model was unable to predict yields of proso millet, foxtail millet, and adzuki bean from paddy fields in excessive soil-water condition. These results concluded that these three crops may not be suitable for cultivation in paddy fields. On the other hand, sorghum and sesame were more suitable to paddy filed cultivation and their yields can be easily predicted under various soil-water conditions or groundwater levels. More studies will be performed to obtain additional field data for cereal crops with various groundwater tables to test yield-SDI models and improve the models for proso millet, foxtail millet, and adzuki bean. This study may contribute to more precise water management for cereal crops in paddy fields and provide a guideline to manage water conditions in paddy field soils to cultivate cereal crops.

Acknowledgements

This research was performed and funded by an Agenda project of Rural Development Administration (project number: PJ 01163802).

References

Ahmad N, Kanwar RS. 1989. Crop susceptibility factors for corn and their effect on the stress-day index. Transactions of the ASAE 32:1979-1986.

Ashraf M, Rehman H. 1999. Mineral nutrient status of corn in relation to nitrate and long-term waterlogging. Journal of Plant Nutrition.

22:1253-1268.

Belford RK, Cannell RQ, Thomson RJ. 1985. Effect of single and multiple waterlogging on the growth and yield of winter wheat on a clay soil. Journal of the Science of Food and Agriculture 32:142-156.

Belford RK, Dracup M, Tennant D. 1992. Limitations to growth and yield of cereal and lupin crops on duplex soils. Australian Journal of Experimental Agriculture 32:929-945.

Cannel RQ, Belford RK, Gales K, Dennis CW, Prew RD. 1980. Effects of waterlogging at different stages of development on the growth and yield of winter wheat. Journal of the Science of Food and Agriculture 31:117-132.

Sorghum Sesame

(12)

Evans RO, Skaggs RW. 1984. Crop susceptibility factors for corn and soybeans to controlled flooding. Transactions of the ASAE paper No. 84-2567, ASAE. St. Joseph, MI.

Evans RO, Skaggs RW, Sneed RE. 1986. Crop susceptibility factors and stress day index to relate crop response to excessive and deficit soil water. ASAE Paper No. 86-2053, ASAE. St. Joseph, MI.

Evans RO, Skaggs RW, Sneed RE. 1990. Normalized crop susceptibility factors for corn and soybean to excess water stress.

Transactions of the ASAE 33:1153-1161.

Evans RO, Skaggs RW, Sneed RE. 1991. Stress day index models to predict corn and soybean relative yield under high water table conditions. Transactions of the ASAE. 34:1997-2005.

Fausey NR, Toai TT Van, McDonald MB Jr. 1985. Responses of ten corn cultivars to flooding. Transactions of the ASAE 28:1794-1797.

Hardjoamidjojo S, Skaggs RW, Schwab GO. 1982. Corn yield response to excessive soil water conditions. Transactions of the ASAE 25:922-927, 934.

Hiler EA, Clark RN. 1971. Stress day index to characterize effects of water stress on crop yields. Transactions of the ASAE 14:757-761.

Hiler EA. 1969. Quantitative evaluation of crop-drainage requirements. Transactions of the ASAE 12:499-505.

Howell TA, Hiler EA. 1975. Optimization of water use efficiency under high frequency irrigation. pp 873-878. Transactions of the ASAE, Denver.

Ji CH, Kim WH, Kim KY, Lee SH, Yoon SH, Lim YC. 2009. Effect of different drained conditions on growth, forage production and quality of silage corn at paddy field. Journal of the Korean Society of Grassland and Forage Sciece 29:329-336. [in Korean]

Jo JS, Kim CS, Won JY. 1996. Crop rotation of the korean ginseng (Panax ginseng C. A. Meyer) and the rice in paddy field. Korean Journal of Medicinal Crop Science. 4:19-26. [in Korean]

Jung KY, Yun ES, Park CY, Hwang JB, Choi YD, Park KD. 2011. Stress day index to predict soybean yield response by subsurface drainage in poorly drained sloping paddy fields. Korea Journal of Soil Science and Fertilizer 44:702-708. [in Korean]

Jung KY, Yun ES, Park CY, Hwang JB, Choi YD, Oh IS. 2013. Response of millet and sorghum to water stress in converted poorly drained paddy soil. Korea Journal of Soil Sciece and Fertilizer 46:409-416. [in Korean]

Jung KY, Ko JY, Lee JS, Jung MS, Oh IS, Woo KS. 2014. Effects of the drainage methods on phenolic compounds and radical scavenging activity of foxtail millet and proso millet. Korean Journal of Crop Science 59(3):282-292. [in Korean]

Kandil SA, Abo-El-Kheir MSA, El –Zeiny HA. 2001. Response of some wheat cultivars to water stress imposed at certain growth stages. Egyptian Journal of Applied Science 16:82-98.

Lee JE, Kim HS, Kwon YU, Jung GH, Lee CK, Yun HT, Kim CK. 2010. Responses of root growth characters to waterlogging in soybean [Glycine max (L.) Merrill]. Korean Journal of Crop Science. 55:1-7. [in Korean]

Mallikarjunaswamy SN, Ramachandrappa BK, Nanjappa HV. 1999. Effect of scheduling irrigation at different phenonphases of sweet corn (Zea mays sacharata) and delineation of critical stages based on stress day index. Journal of Agronomy and Crop Science 182:161-166.

Mukhtar S, Baker JL, Kanwar RS. 1990. Corn growth as effected by excessive soil water. Transactions of the ASAE 33:437-442.

National Statistical Office (NSO). 2013. Regional statistics yearbook, Seoul. [in Korean]

National Statistical Office (NSO). 2015. Regional statistics yearbook, Seoul. [in Korean]

Purwanto MYJ, Hardjoamidjojo S, Nakamura R, Kubo N. 1993. Crop yield prediction by stress day indices under both excessive and deficient soil water conditions. Irrigation Engineering and Rural Planning 25:101-110.

Shaw RH. 1974. A weighted moisture-stress index for corn in Iowa. Iowa State Journal of Research 49:101-114.

(13)

Sieben WH. 1964. Relation of drainage conditions and crop yields on young clay soils in the Yssellake polders. VanZee tot Land 40.

Sudar RA, Saxton KE, Spomer RG. 1979. A predictive model of water stress in corn and soybeans. ASAE Paper No. 79-2004, ASAE.

St. Joseph, MI.

Wei W, Li D, Wang L, Ding X, Zhang Y, Gao Y, Zhang X. 2013. Morpho-anatomical and physiological responses to waterlogging of sesame (Sesamum indicum L.). Plant Science 208:102-111.

Zadoks JC, Chang TT, Konzak CF. 1974. A decimal code for the growth stages of cereals. Weed Research 14:415-421.

수치

Fig. 1. Pictures of a CS experiment with groundwater level of 10 cm in wagner pots: (A) A diagram of the CS experiment, and  (B) An actual picture of the CS experiment with sesame.
Fig. 2. Layout of drainage systems and measuring points of soil water content and groundwater level at each plot
Table 3. CS and NCS factors of five crops with excessive water stress at five growth stages and no water stress.
Table 5. Hydrological properties from paddy fields of two drainage classes and two drainage treatments.
+3

참조

관련 문서

The purpose of this study was to examine the effect of the transformationa l leadership of a dance leader on the empowerment of professional dancers and

This study was conducted to determine the optimum seeding rate and seeding date of Japanese millet(Echinochloa crusgalli var. frumentacea) by comparing the

Days to emergence and heading, duration of growth, leaf traits and stem diameter of sweet sorghum as affected by soils. Soil type Days

2001.. to determine influence of planting space and the number of plants per hill on agronomic characters, forage yield and quality of Jeju Italian millet..

In this context, this study compared and analyzed a variety of soil decontamination methods used to evaluate the wide-area soil contaminated with Cs:

Current water quality standards for phosphorus in the sewage effluent from 2012 0.2mg/L until tightened according to the existing sewage treatment facilities

The inlet temperatures of each stages and return water, evaporation rates of each stages and total fresh water generating rates were predicted. By varying

Intermdediate phases may melt congruently or incongruently. They may occur as either binary or ternary phases... • This can be envisaged if there is direct equilibrium between 