ISSN 2465-8111 DOI http://dx.doi.org/10.18770/KEPCO.2015.01.01.121
ⓒ 2015 Korea Electric Power Corporation. Personal use is permitted, reproduction/redistribution requires permission.
Review on Evaluation of Rare Earth Metals and Rare Valuable Metals Contained in Coal Ash of Coal-fired Power Plants in Korea
Seok-Un Park†, Jae-Kwan Kim, Yeon-Seok Seo, Jun-Seok Hong, Hyoung-Beom Lee and Hyun-Dong Lee KEPCO Research institute, Korea Electric Power Corporation,105 Munji-Ro, Yuseong-Gu, Daejeon 34056, Korea
† [email protected]
Abstract
Distribution of rare earth metals (REMs) and rare valuable metals (RVMs) contents in coal ashes (fly ash, bottom ash, and pond ash) and leachate from 11 coal-fired power plants in Korea were investigated. Coal ashes and leachates were found to contain important REMs and RVMs such as Yttrium (Y) and Neodymium (Nd), which was in the range of 23~75 mg/kg. However, it still requires developing effective recovery and separation methods in order to utilize REMs and RVMs in ash and leachate. Recovery of valuable elements (Y and Nd) from various and extensive ash sources (8.21 million tons/year in 2013) can provide the existing power plants with additional profit; therefore, it can significantly improve economics of the power plants.
Keywords: Rare Earth Metals, Rare Valuable Metals, Coal Ash, Coal-fired Power Plant, Urban mine
I. INTRODUCTION
Coal has been used as main fuel for power plants around the world due to its abundant reserves, relatively low price, stable supply and etc. As of December 2014, coal-fired power plants using anthracite and bituminous coal have taken about 46% (203,765,391 MWh) of the gross generation (442,914,458 MWh) of Korea Electric Power Corporation (KEPCO)'s subsidiary companies [1]. In Korea, it's expected new coal-fired power plants (10,500 MW) will be constructed by 2027 based on the 5th (1999~2015) and the 6th (2013~2027) basic plan for electricity supply and demand, and the importance of coal-fired power generation has been growing. Accordingly, the annual amount of coal ashes is likely to increase (8.21 million tons/y in 2013 to 16.6 million tons/y in 2020).
At present, the ash ponds of coal-fired power plants in Korea are filled with about 57.08 million tons of coal ashes and most of them are high carbon ashes which contain more than 5%
of LOI (loss on ignition). Coal ashes have been mainly recycled as admixture for cement mortar and concrete, but the recycling rate (end-of-life) is expected to drop to less than 50% by 2020 because of increasing amount of coal ashes and low growth rate of the cement industry. On the other hand, the ministry of environment in Korea is going to enforce the levy system on waste landfill from 2017 to reduce the landfill rate to 3% of the amount of waste by 2020. When considering the trend of national policy on waste landfill and the situation of ash ponds, it is shown burdens and pressure to recycle coal ashes will grow heavier. Therefore, it is desperately needed to develop various high value-added technologies on recycling of coal ashes.
Numerous studies on the contents of REMs and RVMs in coal ashes have been reported. Rare earth elements (REEs) are a collection of chemical materials in the periodic table of which atomic numbers are 21, 39 and 57~71 and they can be classified as light REES (LREEs), medium REEs (MREEs) and heavy REEs (HREES) by their own mineral characteristics, namely scandium (Sc), yttrium (Y) and the 15 lanthanides such as lanthanum (La), cerium (Ce), praseodymium (Pr), neodymium
(Nd), promethium (Pm), samarium (Sm), europium (Eu), gadolinium (Gd), terbium (Tb), dysprosium (Dy), holmium (Ho), erbium (Er), thulium (Tm), ytterbium (Yb), ruthenium (Ru) [2]. The price of REEs have rapidly risen and the competition for securing resources are severely proceeding because of the limitation of supply and the drastic increase of demand in new industries. Especially, some of REEs are classified as strategic materials due to lack of deposits and the Department of Energy (DOE) of United States is carrying out various research projects about Y, Eu, Nd, Tb and Dy. The market and demand for REEs are expected to continuously grow and it has been reported the predicted market size of Y and Nd, which are mainly used as light emitting displays and permanent magnet, is about 46.7 billion USD and 294 billion USD by 2025, respectively [3].
Therefore, the contents distribution of REMs and RVMs in coal ashes of coal-fired power plants in Korea and the economic valuation as urban mines were investigated in this study.
A. Content distribution of REMs and RVMs in coal ashes Since large amounts of coal slurry have been leaked into nearby tributaries at Tennessee Valley Authority's Kingston Plant of U.S. in 2008, the Environmental Protection Agency (EPA) of U.S. has strengthen monitoring on coal ashes and established related legislation on safe usage of coal ashes. In this process, it was shown that coal ashes contained various kinds of REEs including strategic materials as well as heavy metals.
Therefore, DOE and EPA of U.S. established the recycling standard through monitoring 'Trace Elements', which include heavy metals and REEs, in coal ashes from coal-fired power plants in the U.S. by 2015 and they are supporting to develop extraction technologies. Table 1 shows the major elements’
contents of strategic materials in coal and coal ashes (between 2011 and 2012) in about 10 coal-fired power plants of the U.S.
As Table 1, the content of Ga was ranged from 212 to 299
mg/kg, Ce was 405 - 565 mg/kg, Y was 191~259 mg/kg, Eu was
3.90~5.90 mg/kg, and Nd was 183~256 mg/kg [4].
In the previous reports, Wojciech et al. [5], Blissett et al.
[6] and Querol et al. [7] have reported REEs' contents in bituminous coal were ranged from 28.8 to 359.1 mg/kg. On the other hand, Zhang et al. [8]-[10] measured the contents of REEs in incineration ashes of food waste, animal husbandry waste, horticulture waste, sewage sludge and incinerators' bottom ash and it was shown the contents of 11 REEs such as Y, La, Ce and etc. were ranged from 53.7 to 130 mg/kg and other metals such as Li, Ga, Ru and Zr were in the range of 5~300 mg/kg.
In Korea, Korea Western Power Co., Ltd. and Kunsan National University have examined the recovery of Li in coal ashes and they found the content of Li in ash pond was 2~3 mg/kg (average Li content of seawater : 0.17 mg/L). It was limited to the certain metal (Li), so it is regarded there is no study on monitoring REMs or RVMs in coal ashes from coal- fired power plants in Korea. Lee et al. [2] collected fly ash and bottom ash of Korea South-East Power Co. and tried to measure existence of REEs indirectly by examining chemical composition by X-ray fluorescence spectrometry (XRF), but they failed due to limitation of analytical instrument.
B. Global trend on REMs and RVMs
There is yet no international organization to appropriately evaluate and determine the prices of REMs and RVMs and the prices are being set by supply and demand. In the past, REEs were supplied at controlled prices by a few major producers.
However, China became a major producer of REEs and took over about 90% of REEs market in 2000s because of low labor and mining costs in China. Australia and U.S. have been mining their own iron ore for REEs from the beginning of 2010s, but the prices of REEs were still under the control of China's policy on environmental problems and the domestic demands [11].
U.S. has prepared several short-term countermeasure and policy on matters of REEs supply and demand, but alternative technologies and recycling plans in the US have been prepared for the long-term. European Union (EU) implemented the 'Raw Material Initiative' in 2008 and classified 14 metals such as Sb, Be, Co, Ga, Ge, In, Ta, and W, termed as major management objects. In addition, B, coking coal and phosphate rock were included on May 2014. On the other hand, Japan has been carried out research projects to substitute each REE and save resources and put efforts into reducing risks of discontinuance of supply, but the balance of demand and supply is deteriorating
in case of some REEs [3][12].
II. ANALTYCAL METHOD
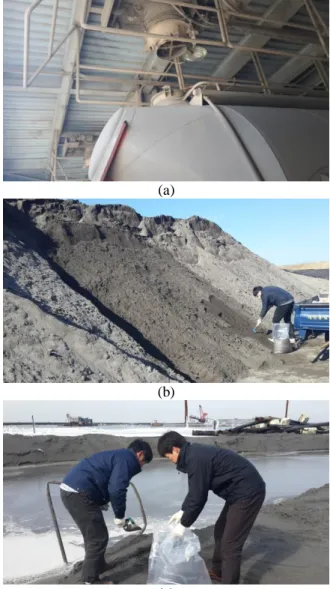
In this study, the content distributions of REMs and RVMs in coal ashes (fly, bottom, and pond ashes) and leachate of 11 coal-fired power plants was investigated. The fly ash samples were collected soon after produced and samples of bottom and pond ashes were collected at the points of ash pond which are not under the influence of seawater. Supernatant water was collected as leachate samples.
Pre-treatment of coal ash was performed because coal ash is produced at high temperature. First of all, about 0.2 g of coal ash sample was put into Teflon bottle and 3 mL of sulfuric acid (H
2SO
4, 95~98%) and 2 mL of hydrofluoric acid (HF, 47~51%) were subsequently added. Sample drying was conducted in two- step drying process; i.e. coal ash on aluminum heating block was initially dried at at 110ºC and then temperature was increased to 160ºC for second step of drying. After cooling the sample bottle, 1 mL of nitric acid (HNO
3, 68.5~71%) and 19 mL of 1% nitric acid solution (HNO
3, 1%) were added. Then, sample bottle cover with lid was heated at 100ºC for 30 min.
Table 1. Mean and range of contents of strategic REEs and some rare metals in coal and coal ashes of U.S.
(Unit: mg/kg)
Element Raw Coal Coal ash Coal Fly Ash
Ce 20.9 (0.79 ~ 790) 468.78 (151 ~ 1,784) - (405 ~ 565) Dy 2.09 (0.11 ~ 28) 61.54 (18 ~ 527) - (32.1 ~ 50.3) Eu 0.28 (0.025 ~ 5.8) 7.64 (2.00 ~ 31) - (3.9 ~ 5.9) La 9.09 (0.07 ~ 230) 259.85 (60 ~ 839) - (206 ~ 286) Nd 8.48 (0.47 ~ 230) 236.02 (70 ~ 967) - (183 ~ 256) Pr 4.81 (0.17 ~ 65) 59.02 (17 ~ 239) - (49.0 ~ 68.4) Tb 0.54 (0.01 ~ 21) 10.29 (3.00 ~ 8.0) - (4.9 ~ 7.3)
Y 8.18 (0.10 ~ 100) 408.34 (97 ~ 3,540) - (191 ~ 259) Total REE 54.9 (0.20 ~ 1,031) 1,723 (721 ~ 8,426) - (1,213.6 ~ 1,667.6)
Ga 5.24 (0.044 ~ 41) N.A. - (212 ~ 299)
Ge 4.23 (0.007 ~ 220) - (<10 ~ 1,841) - (1.00 ~ 356)
Ln 0.71 (0.025 ~ 23) N.A. N.A.
Te 1.82 (8.8 ~ 510) N.A. - (0.14 ~ 2.7)
* N.A.: not analyzed, '-' means no average value.
(a)
(b)
(c)
Fig. 1. Sampling of coal ashes. (a) fly ash. (b) bottom ash. (c)
pond ash
Samples fused through this process were used to measure the contents of REMs and RVMs by Inductively Coupled Plasma - Optical Emission Spectrometry (ICP-OES). The amount of samples, kinds and amount of acid solutions depend on the characteristic of coal ash samples. The target metals were 11 REMs (Y, Nd, Eu, Tb, Dy, Ce, La, Nb, Te, Th and Tl) and 10 RVMs (Ag, Au, Ba, Bi, Co, Ga, Li, Ni, V and Zr).
III. RESULT AND DISCUSSION
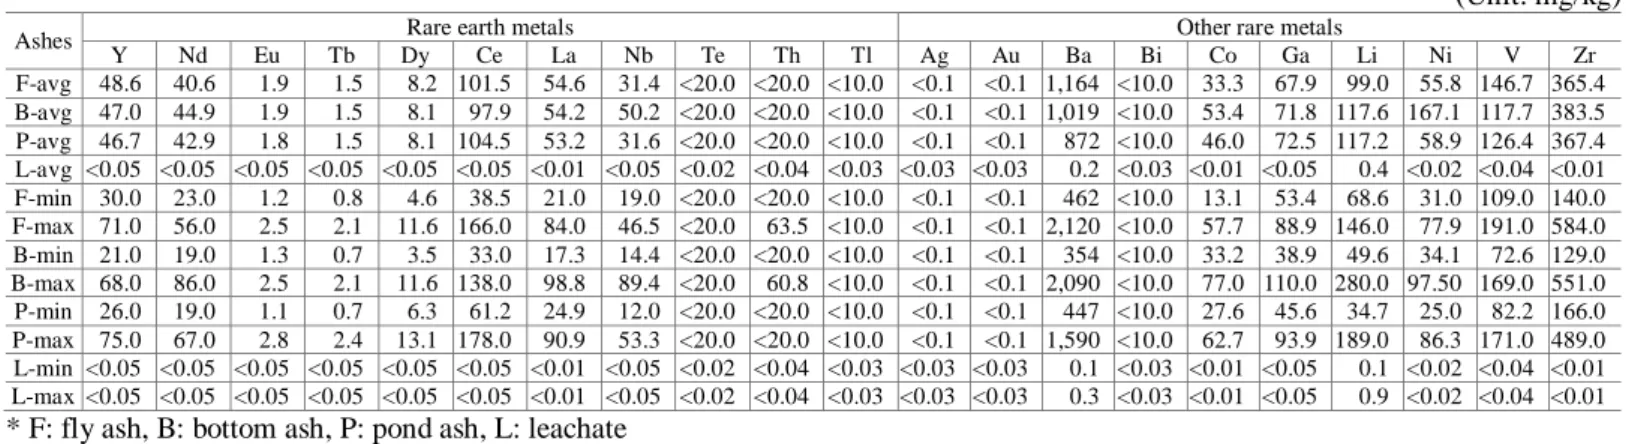
Table 2 summarizes the contents of REEs in coal ashes and leachate samples. Y was ranged from 30 to 71 mg/kg in fly ash, 21 to 68 mg/kg in bottom ash, 26 to 75 mg/kg in pond ash and the mean values of all three ash samples were higher than 40 mg/kg. In particular, Y content in fly ash and bottom ash of C1 power plant and pond ash of E1 power plant were the highest. In case of Nd, the content was ranged from 23 to 56 mg/kg in fly ash, 19 to 86 mg/kg in bottom ash, 19 to 67 mg/kg in pond ash and C1 power plant, E3 power plant and E1 power plant had the highest value in fly ash, bottom ash and pond ash, respectively.
The content of Ce was ranged from 33 to 178 mg/kg (38.5 to 166.0 mg/kg in fly ash, 33.0 to 138.0 mg/kg in bottom ash and 61.2 to 178.0 mg/kg in pond ash) and La was ranged from 17.3 to 98.8 mg/kg (21.0 to 84.0 mg/kg in fly ash, 17.3 to 98.8 mg/kg in bottom ash and 24.9 to 90.9 mg/kg in pond ash) and Nb was ranged from 12.0 to 89.4 mg/kg (19.0 to 46.5 mg/kg in fly ash, 14.4 to 89.4 mg/kg in bottom ash and 12.0 to 53.3 mg/kg in pond ash). The content of Th was ranged from 20.0 to 60.8 mg/kg (20.0 to 63.5 mg/kg in fly ash, 20.0 to 60.8 mg/kg in bottom ash and less than 20.0 mg/kg in pond ash), but the contents of Te and Tl were less than 20 mg/kg. In case of leachate samples, the contents of all REMs and RVMs were less than 20 mg/kg and it was regarded leachate samples weren't under the influence of seawater.
Also, the contents of Ag and Au were less than 0.1 mg/kg and Ba was ranged from 354 to 2,120 mg/kg (462 to 2,120 mg/kg in fly ash, 354 to 2,090 mg/kg in bottom ash and 447 to 1,590 mg/kg in pond ash). The content of Bi was less than 10 mg/kg and Co was ranged from 13.1 to 77.0 mg/kg (13.1 to 57.7 mg/kg in fly ash, 33.2 to 77.0 mg/kg in bottom ash and 27.6 to 62.7 mg/kg in pond ash). The content of Ga was ranged from 38.9 to 110 mg/kg (53.4 to 88.9 mg/kg in fly ash, 38.9 to 110.0 mg/kg in bottom ash and 45.6 to 93.9 mg/kg in pond ash) and Ni was ranged from 25.0 to 97.5 mg/kg (31.0 to 77.9 mg/kg in fly ash, 34.1 to 97.5 mg/kg in bottom ash and 25.0 to 86.3 mg/kg in
pond ash). The content of V was ranged from 72.0 to 191 mg/kg (109 to 191 mg/kg in fly ash, 72.6 to 169 mg/kg in bottom ash and 82.2 to 171 mg/kg in pond ash) and Zr was ranged from 129 to 584 mg/kg (140 to 584 mg/kg in fly ash, 129 to 551 mg/kg in bottom ash and 166 to 489 mg/kg in pond ash). The content of Li in leachate samples was ranged from 0.1 to 0.9 mg/L, but it was shown other REMs and RVMs were not dissolved in leachate.
The amounts of REMs and RVMs in fly ash of coal-fired power plants in Korea based on the amount of coal ashes in 2013 are shown Table 3. The amount of fly ash was about 6.95 million tons/y and the amount of REMs and RVMs was 15,823 tons/y. In particular, the annual amount of Y was 338 tons, Nd was 282 tons and La was 379 tons. And it was shown 688 tons of Li, 388 tons of Ni, 1,019 tons of V and 2,538 tons of Zr were generated annually.
In case of bottom ash, the annual amount was 1.26 million tons/y and the amount of REMs and RVMs was 2,899 tons.
Especially, the annual amount of Y was 59 tons, Nd was 57 tons and La was 69 tons. And it was shown 149 tons of Li, 211 tons of Ni, 149 tons of V and 485 tons of Zr were generated annually.
On the other hand, about 640 million tons of pond ash, which was filled from 1983 to 2015, is in ash pond of coal-fired power plants and the amount of REMs and RVMs contained in it was 128,357 tons. The amount of Y was 2,985 tons, Nd was 2,742 tons and category of Te was 3,836 tons. Also, 7,492 tons of Li, 3,765 tons of Ni, 8,080 tons of V and 23,487 tons of Zr were contained in pond ash. The contents of ultra-expensive metals such as Dy, Te, Ga and etc were quite high.
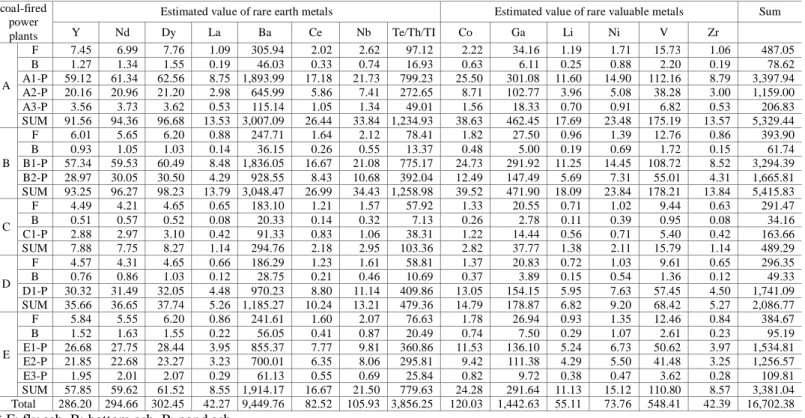
The economic value of REMs and RVMs contained in the annual amount of fly ash and bottom ash (based on 2013) and total pond ash in ash pond in coal-fired power plants in Korea by using international trade price (based on Jan. 2015) from Metal-pages (http://metal-pages.com), MineralPrices.com (http://www. mineralprices.com) and Korea Resources Corporation (http:// www.kores.or.kr) were shown in Table 4.
As a result, the economic values of REMs and RVMs in A power co. were estimated to be approximately 532.9 billion KRW. Among the three different sources of ashes, the pond ash of A1 power plant was found to be the highest (339.7 billion KRW). On the other hand, the economic values of REMs and RVMs in B power co. were estimated to be approximately 541.5 billion KRW, which was the highest value among five KEPCO's subsidiary companies. Consequently, the economic values of REMs and RVMs in coal-fired power plants in Korea was Table 2. Content of rare earth metals in coal ashes and leachate from coal-fired power plants
(Unit: mg/kg)
Ashes Rare earth metals Other rare metals
Y Nd Eu Tb Dy Ce La Nb Te Th Tl Ag Au Ba Bi Co Ga Li Ni V Zr
F-avg 48.6 40.6 1.9 1.5 8.2 101.5 54.6 31.4 <20.0 <20.0 <10.0 <0.1 <0.1 1,164 <10.0 33.3 67.9 99.0 55.8 146.7 365.4 B-avg 47.0 44.9 1.9 1.5 8.1 97.9 54.2 50.2 <20.0 <20.0 <10.0 <0.1 <0.1 1,019 <10.0 53.4 71.8 117.6 167.1 117.7 383.5 P-avg 46.7 42.9 1.8 1.5 8.1 104.5 53.2 31.6 <20.0 <20.0 <10.0 <0.1 <0.1 872 <10.0 46.0 72.5 117.2 58.9 126.4 367.4 L-avg <0.05 <0.05 <0.05 <0.05 <0.05 <0.05 <0.01 <0.05 <0.02 <0.04 <0.03 <0.03 <0.03 0.2 <0.03 <0.01 <0.05 0.4 <0.02 <0.04 <0.01 F-min 30.0 23.0 1.2 0.8 4.6 38.5 21.0 19.0 <20.0 <20.0 <10.0 <0.1 <0.1 462 <10.0 13.1 53.4 68.6 31.0 109.0 140.0 F-max 71.0 56.0 2.5 2.1 11.6 166.0 84.0 46.5 <20.0 63.5 <10.0 <0.1 <0.1 2,120 <10.0 57.7 88.9 146.0 77.9 191.0 584.0 B-min 21.0 19.0 1.3 0.7 3.5 33.0 17.3 14.4 <20.0 <20.0 <10.0 <0.1 <0.1 354 <10.0 33.2 38.9 49.6 34.1 72.6 129.0 B-max 68.0 86.0 2.5 2.1 11.6 138.0 98.8 89.4 <20.0 60.8 <10.0 <0.1 <0.1 2,090 <10.0 77.0 110.0 280.0 97.50 169.0 551.0 P-min 26.0 19.0 1.1 0.7 6.3 61.2 24.9 12.0 <20.0 <20.0 <10.0 <0.1 <0.1 447 <10.0 27.6 45.6 34.7 25.0 82.2 166.0 P-max 75.0 67.0 2.8 2.4 13.1 178.0 90.9 53.3 <20.0 <20.0 <10.0 <0.1 <0.1 1,590 <10.0 62.7 93.9 189.0 86.3 171.0 489.0 L-min <0.05 <0.05 <0.05 <0.05 <0.05 <0.05 <0.01 <0.05 <0.02 <0.04 <0.03 <0.03 <0.03 0.1 <0.03 <0.01 <0.05 0.1 <0.02 <0.04 <0.01 L-max <0.05 <0.05 <0.05 <0.05 <0.05 <0.05 <0.01 <0.05 <0.02 <0.04 <0.03 <0.03 <0.03 0.3 <0.03 <0.01 <0.05 0.9 <0.02 <0.04 <0.01
* F: fly ash, B: bottom ash, P: pond ash, L: leachate
estimated to reach about 1,670 KRW, which is worth to develop recovery technologies for REMs and RVMs.
IV. CONCLUSION
The content distributions of REMs and RVMs in coal ashes of 11 coal-fired power plants in Korea were investigated and the conclusion can be summarized as follows:
1) Among 11 REMs and 10 RVMs in coal ashes of coal- fired power plants in Korea, the contents of Ys were ranged from 30 to 71 mg/kg in fly ash, 21 to 68 mg/kg in bottom ash and 26 to 75 mg/kg in pond ash, which have the mean value of >
40 mg/kg. For Nd component, the contents were ranged from 23 to 56 mg/kg in fly ash, 19 to 86 mg/kg on bottom ash and 19 to 67 mg/kg in pond ash. It also showed that Li contents were measured at high level (34.7~280 mg/kg) compared to those of other components.
2) The amounts of REMs and RVMs in annual amount of fly ash and bottom ash were about 15,823 tons/y and about 2,899 tons/y, respectively. In addition, 128,354 tons of REMs and RVMs were contained in pond ash at present. In particular, it was shown that the levels of Y, Nd, La, Li, Ni, V and Zr, which are major strategic materials, were found to be at high level.
3) The economic values of REMs and RVMs contained in
coal ashes (fly ash, bottom ash and pond ash) of coal-fired power plants in Korea were currently estimated to reach about 1,670 billion KRW. In particular, B power co. had the highest value of about 541.5 billion KRW and A power co. had the value of about 532.9 billion KRW (339.7 billion KRW in pond ash). In conclusion, an effective recovery technology for REMs and RVMs from coal ashes should be developed to improve the overall economics of power plant facilities
ACKNOWLEDGEMENT
This work was supported by the Energy & Resources Recycling Program of the Korea Institute of Energy Technology Evaluation and Planning (KETEP), granted financial resource from the Ministry of Trade, Industry & Energy, Republic of Korea.
REFERENCES
[1] Korea Electric Power Corporation, “Statistics of Electric Power in Korea (2014)”, 2015.
[2] Lee JK and Kim JY, “Recovery Potential of Rare Earth Elements in Coal Ashes”, Journal of Korea Society of Table 3. Amount of rare earth metals and rare valuable metals in coal ashes from coal-fired power plants in 2013
(Unit: ton)
Item coal- fired power
plant
amount (10,000 ton)
amount of rare earth metals amount of rare valuable metals Total
Y Nd Dy La Ba Ce Nb Te/Th/TI Co Ga Li Ni V Zr
Fly ash
A
A1 78 38 32 6 43 911 79 25 47 26 53 77 44 115 286 1,781
A2 82 40 33 7 45 956 83 26 49 27 56 81 46 120 300 1,870
A3 15 7 6 1 8 170 15 5 9 5 10 14 8 21 53 333
A4 6 3 2 0 3 70 6 2 4 2 4 6 3 9 22 137
B B1 118 57 48 10 64 1,371 119 37 71 39 80 117 66 173 430 2,681
B2 29 14 12 2 16 335 29 9 17 10 20 29 16 42 105 656
C C1 108 53 44 9 59 1,261 110 34 65 36 74 107 60 159 396 2,467
D D1 110 54 45 9 60 1,283 112 35 66 37 75 109 61 162 403 2,510
E
E1 105 51 43 9 57 1,226 107 33 63 35 71 104 59 154 385 2,398
E2 13 6 5 1 7 153 13 4 8 4 9 13 7 19 48 298
E3 25 12 10 2 13 285 25 8 15 8 17 24 14 36 90 558
Total 695 338 282 57 379 8,091 705 218 417 231 472 688 388 1,019 2,538 15,823
Bottom ash
A
A1 14 7 6 1 8 143 14 7 8 7 10 16 23 16 54 321
A2 15 7 7 1 8 148 14 7 9 8 10 17 24 17 56 333
A3 3 1 1 0 1 27 3 1 2 1 2 3 4 3 10 60
B B1 19 9 8 1 10 189 18 9 11 10 13 22 31 22 71 424
B2 6 3 3 0 3 60 6 3 4 3 4 7 10 7 23 135
C C1 14 6 6 1 7 140 13 7 8 7 10 16 23 16 53 314
D D1 19 9 9 2 11 198 19 10 12 10 14 23 32 23 74 445
E
E1 23 11 10 2 13 236 23 12 14 12 17 27 39 27 89 530
E2 3 2 1 0 2 34 3 2 2 2 2 4 6 4 13 76
E3 11 5 5 1 6 116 11 6 7 6 8 13 19 13 44 261
Total 126 59 57 10 69 1,289 124 63 76 67 91 149 211 149 485 2,899
Pond ash
A
A1 14,951 698 641 121 795 13,044 1,562 472 897 688 1,084 1,752 881 1,890 5,493 30,019
A2 5,100 238 219 41 271 4,449 533 161 306 235 370 598 300 645 1,874 10,240
A3 909 42 39 7 48 793 95 29 55 42 66 106 54 115 334 1,824
B B1 14,495 677 622 117 771 12,645 1,515 458 870 667 1,051 1,699 854 1,832 5,325 29,103
B2 7,331 342 314 59 390 6,395 766 232 440 337 531 859 432 927 2,693 14,719
C C1 722 34 31 6 38 629 75 23 43 33 52 85 42 91 265 1,449
D D1 7,660 358 329 62 407 6,682 800 242 460 352 555 898 451 968 2,814 15,379
E
E1 6,753 315 290 55 359 5,891 706 213 405 311 490 791 398 853 2,481 13,557
E2 5,526 258 237 45 294 4,821 577 175 332 254 401 648 325 699 2,030 11,096
E3 482 23 21 4 26 421 50 15 29 22 35 57 28 61 177 968
Total 63,928 2,985 2,742 518 3,401 55,770 6,680 2,020 3,836 2,941 4,635 7,492 3,765 8,080 23,487 128,354
Waste Management, 30(1), pp.94-99, 2013.
[3] U.S. Department of Energy (DOE), “Critical Materials Strategy”, 2011.
[4] American coal ash Association, “World of coal ash, Ash at work, Issue 1”, 2013.
[5] Wojciech F, Małgorzata M. Wiatros M and Magdalena W,
“Coal fly ash as a resource for rare earth elements”, Environmental Science and pollution research international, DOI 10.1007/s11356-015-4111-9, 2015.
[6] Blissett RS, Smalley N and Rowson NA, “An investigation into six coal fly ashes from the United Kingdom and Poland to evaluate rare earth element content”, Fuel, 119, pp.236-239, 2014.
[7] Querol X, Fernandez TJ and Lopez SA, “Trace elements in coal and their behavior during combustion in a large power station”, Fuel, 74(3), pp.331-343, 1995.
[8] Zhang FS, Yamasaki S and Kimura K, “Rare earth element
in various waste ashes and the potential risk to Japanese soils”, Environment International, 27, pp.393-398, 2001.
[9] Zhang FS, Yamasaki S and Nanzyo M, “Waste ashes for use in agricultural production: I. Liming effect, contents of plant nutrients and chemical characteristics of some
metals”, The Science of the Total Environment, 284, pp.215-225, 2002.
[10] Zhang FS, Yamasaki S and Kimura K, “Waste ashes for use in agricultural production: II. Contents of minor and trace metals”, The Science of the Total Environment, 286, pp.111-118, 2002.
[11] FROST&SULLIVAN, “The Global Role of Rare Earth Materials (Renewed Impetus For Renewed Energy Drives Rare Earths Industry)”, pp.9833-9839, 2011.
[12] Japan Society of Newer Metals, “Problem and Corresponding in Rare Earth Industry”, 2014.
Table 4. Estimate value of rare earth metals and rare valuable metals from coal-fired power plants
(Unit: 0.1 billion-KRW)
coal-fired power plants
Estimated value of rare earth metals Estimated value of rare valuable metals Sum
Y Nd Dy La Ba Ce Nb Te/Th/TI Co Ga Li Ni V Zr
A
F 7.45 6.99 7.76 1.09 305.94 2.02 2.62 97.12 2.22 34.16 1.19 1.71 15.73 1.06 487.05
B 1.27 1.34 1.55 0.19 46.03 0.33 0.74 16.93 0.63 6.11 0.25 0.88 2.20 0.19 78.62
A1-P 59.12 61.34 62.56 8.75 1,893.99 17.18 21.73 799.23 25.50 301.08 11.60 14.90 112.16 8.79 3,397.94 A2-P 20.16 20.96 21.20 2.98 645.99 5.86 7.41 272.65 8.71 102.77 3.96 5.08 38.28 3.00 1,159.00
A3-P 3.56 3.73 3.62 0.53 115.14 1.05 1.34 49.01 1.56 18.33 0.70 0.91 6.82 0.53 206.83
SUM 91.56 94.36 96.68 13.53 3,007.09 26.44 33.84 1,234.93 38.63 462.45 17.69 23.48 175.19 13.57 5,329.44
B
F 6.01 5.65 6.20 0.88 247.71 1.64 2.12 78.41 1.82 27.50 0.96 1.39 12.76 0.86 393.90
B 0.93 1.05 1.03 0.14 36.15 0.26 0.55 13.37 0.48 5.00 0.19 0.69 1.72 0.15 61.74
B1-P 57.34 59.53 60.49 8.48 1,836.05 16.67 21.08 775.17 24.73 291.92 11.25 14.45 108.72 8.52 3,294.39 B2-P 28.97 30.05 30.50 4.29 928.55 8.43 10.68 392.04 12.49 147.49 5.69 7.31 55.01 4.31 1,665.81 SUM 93.25 96.27 98.23 13.79 3,048.47 26.99 34.43 1,258.98 39.52 471.90 18.09 23.84 178.21 13.84 5,415.83
C
F 4.49 4.21 4.65 0.65 183.10 1.21 1.57 57.92 1.33 20.55 0.71 1.02 9.44 0.63 291.47
B 0.51 0.57 0.52 0.08 20.33 0.14 0.32 7.13 0.26 2.78 0.11 0.39 0.95 0.08 34.16
C1-P 2.88 2.97 3.10 0.42 91.33 0.83 1.06 38.31 1.22 14.44 0.56 0.71 5.40 0.42 163.66
SUM 7.88 7.75 8.27 1.14 294.76 2.18 2.95 103.36 2.82 37.77 1.38 2.11 15.79 1.14 489.29
D
F 4.57 4.31 4.65 0.66 186.29 1.23 1.61 58.81 1.37 20.83 0.72 1.03 9.61 0.65 296.35
B 0.76 0.86 1.03 0.12 28.75 0.21 0.46 10.69 0.37 3.89 0.15 0.54 1.36 0.12 49.33
D1-P 30.32 31.49 32.05 4.48 970.23 8.80 11.14 409.86 13.05 154.15 5.95 7.63 57.45 4.50 1,741.09 SUM 35.66 36.65 37.74 5.26 1,185.27 10.24 13.21 479.36 14.79 178.87 6.82 9.20 68.42 5.27 2,086.77
E
F 5.84 5.55 6.20 0.86 241.61 1.60 2.07 76.63 1.78 26.94 0.93 1.35 12.46 0.84 384.67
B 1.52 1.63 1.55 0.22 56.05 0.41 0.87 20.49 0.74 7.50 0.29 1.07 2.61 0.23 95.19
E1-P 26.68 27.75 28.44 3.95 855.37 7.77 9.81 360.86 11.53 136.10 5.24 6.73 50.62 3.97 1,534.81 E2-P 21.85 22.68 23.27 3.23 700.01 6.35 8.06 295.81 9.42 111.38 4.29 5.50 41.48 3.25 1,256.57
E3-P 1.95 2.01 2.07 0.29 61.13 0.55 0.69 25.84 0.82 9.72 0.38 0.47 3.62 0.28 109.81
SUM 57.85 59.62 61.52 8.55 1,914.17 16.67 21.50 779.63 24.28 291.64 11.13 15.12 110.80 8.57 3,381.04 Total 286.20 294.66 302.45 42.27 9,449.76 82.52 105.93 3,856.25 120.03 1,442.63 55.11 73.76 548.41 42.39 16,702.38