• 검색 결과가 없습니다.

Aerosol Optical Thickness Retrieval Using a Small Satellite

N/A
N/A
Protected

Academic year: 2021

Share "Aerosol Optical Thickness Retrieval Using a Small Satellite"

Copied!
11
0
0

로드 중.... (전체 텍스트 보기)

전체 글

(1)

1. Introduction

Retrieval of aerosols from satellite remote sensed data is not straightforward because no single algorithm can work with all land surface types. The main state- of-the art aerosol retrieval algorithms are classified either i. for dark land (e.g. vegetation), ii. for bright

land (e.g. desert, urban area), or iii. for ocean. To accomplish these, many sensors have been designed with their purposes specifically for aerosol retrieval as opposed to those which are not explicitly designed for this application such as the Advanced Very High Resolution Radiometer (AVHRR) whose primary purpose is the measurement of sea surface temperature

Aerosol Optical Thickness Retrieval Using a Small Satellite

Man Sing Wong*, Kwon Ho Lee** , Janet Nichol*, and Young J. Kim***

*Department of Land Surveying and Geo-Informatics, The Hong Kong Polytechnic University, Hung Hom, Kowloon, Hong Kong

**Department of Satellite Geoinformatics Engineering, Kyungil University, Gyungsan 712-701, Republic of Korea

***Advanced Environmental Monitoring Research Center, Department of Environmental Science and Engineering, Gwangju Institute of Science and Technology, Gwangju 500-712, Republic of Korea

Abstract : This study demonstrates the feasibility of small satellite, namely PROBA platform with the compact high resolution imaging spectrometer (CHRIS), for aerosol retrieval in Hong Kong. The rationale of our technique is to estimate the aerosol reflectances by decomposing the Top of Atmosphere (TOA) reflectances from surface reflectance and Rayleigh path reflectances. For the determination of surface reflectances, the modified Minimum Reflectance Technique (MRT) is used on three winter ortho-rectified CHRIS images: Dec-18-2005, Feb-07-2006, Nov-09-2006. For validation purpose, MRT image was compared with ground based multispectral radiometer measurements and atmospherically corrected Landsat image. Results show good agreements between CHRIS-derived surface reflectance and both by ground measurement data as well as by Landsat image (r>0.84). The Root-Mean-Square Errors (RMSE) at 485, 551 and 660nm are 0.99%, 1.19%, and 1.53%, respectively. For aerosol retrieval, Look Up Tables (LUT) which are aerosol reflectances as a function of various AOT values were calculated by SBDART code with AERONET inversion products. The CHRIS derived Aerosol Optical Thickness (AOT) images were then validated with AERONET sunphotometer measurements and the differences are 0.05~0.11 (error=10~18%) at 440nm wavelength. The errors are relatively small compared to those from the operational moderate resolution imaging spectroradiometer (MODIS) Deep Blue algorithm (within 30%) and MODIS ocean algorithm (within 20%).

Key Words : CHRIS, Aerosol, Look Up Table, Radiative transfer model, Surface reflectance.

Received April 28, 2010; Revised July 20, 2010; Accepted August 1, 2010.

Corresponding Author: Kwon-Ho Lee ([email protected])

(2)

(SST) and vegetation index. The Total Ozone Mapping Spectrometer (TOMS) whose primary purpose is for monitoring ozone content (Herman et al., 1997; Hsu et al., 1999), the Sea-viewing Wide Field-of-view Sensor (SeaWiFS) which is developed to study ocean color and marine biogeochemical processes. However EOS TERRA with the instruments of the Moderate Resolution Imaging Spectroradiometer (MODIS) and the Multiangle Imaging SpectroRadiometer (MISR) do provide capabilities for atmosphere, as well as land and ocean studies (Tanré et al., 1997; Wanner et al., 1997).

Small satellites have the advantages of its lower costs, programmable positioning and sensor modes, which can be customised for environmental monitoring. In addition, small satellites with their high temporal, spatial and spectral resolutions can be used for monitoring aerosol concentration especially for complex land covers. This study demonstrates the feasibility of small satellite images for retrieving aerosols in stated accuracy and at detailed level.

Aerosol retrieval using remote sensing technique can be classified into three major methodologies.

These are multi-wavelength retrieval (MODIS, MISR, AVHRR), polarization retrieval (POLDER), and active measurement (Lidar). In the current study, focus will be placed on studies using multi- wavelength algorithms. Following the launch of MODIS, a number of algorithms for aerosol retrieval were devised. These state-of-the-art methodologies include i. Dense Dark Vegetation (DDV) algorithm (known as collection 4 algorithm) (Kaufman and Tanré, 1998), ii. Second generation MODIS operation algorithm (known as collection 5 algorithm) (Levy et al., 2007), iii. Deep Blue algorithm (Hsu et al. 2004, 2006) and iv. Finer resolution (500m) urban aerosol retrieval algorithm (Lee et al., 2006, 2008a; Wong et al. 2009, in press).

The finer resolution (500m) urban aerosol retrieval

algorithm was developed based on local aerosol optical properties and MODIS 500m (MODHKM) images. Strong correlations (Lee et al., 2006, 2008a;

Wong et al. 2009, 2010) (ca. r=0.86) were obtained between satellite-derived aerosol optical thickness (AOT) and the Aerosol Robotic Network (AERONET, http://aeronet.gsfc.nasa.gov/) sunphotometer measurements. This methodology will be modified and applied in this study.

2. Study area and Dataset

Hong Kong, an affluent city with a service-based economy is situated at the mouth of the Pearl River, whose delta region, spanning Hong Kong, Macau and Guangdong Province of China, has undergone lightning- paced industrial and urban development over the last 20 years. The adverse effect such as air pollution has suffered Hong Kong citizen for the last few years.

Concerning about this, a study area was chosen in the Kowloon peninsula of Hong Kong, comprises steep, rugged countryside and flat urban areas.

The Compact High Resolution Imaging Spectrometer (CHRIS) sensor carried by the PROBA satellite is the first European Space Agency (ESA) small satellite built for small scientific missions, and is classified as a small satellite with a mass of 94kg and size of 80cm x 60cm x 60cm (see Fig. 1). The PROBA carries this sensor (CHRIS) in a sun- synchronous elliptical polar orbit at an altitude of about 600 km. The pointing capability of PROBA permits a CHRIS imagery repeat cycle of approximately 7 days. The CHRIS band selection and region of interest are programmable so that each application can use the most appropriate set of bands and study on their research areas.

CHRIS is a hyperspectral instrument whose

original objective is the collection of Bidirectional

(3)

Reflectance Distribution Function (BRDF) data for a better understanding of spectral reflectances. CHRIS provides 19 spectral bands in the VNIR range (400 - 1050 nm) at a GSD (Ground Sampling Distance) of 17 m. Each nominal image forms a square of 13 km x 13 km on the ground (at perigee). CHRIS can be

reconfigured to provide 63 spectral bands at a spatial resolution of about 34 m. The CHRIS design is capable of providing up to 150 channels over the spectral range of 400-1050 nm.

Three CHRIS satellite images were acquired on the dates of Dec-18-2005, Feb-07-2006 and Nov-09- Fig. 1. (left) PROBA satellite and (right) CHRIS instrument.

Fig. 2. CHRIS images, acquired on (a) Dec-18-2005, (b) Feb-07-2006, and (c) Nov-09-2006.

(c)

(a) (b)

(4)

2006 (Fig. 2). These CHRIS images are in mode 3 (land mode) which offers 18 narrow (mainly 10nm) VNIR wavebands from 430-1019nm at 18m spatial resolution and 12 bit radiometric resolution. They were post-processed by i. noise removal: stripes were found on the images caused by mis-alignment of the sensor and thermal fluctuations during orbit (Garcia and Moreno, 2004), ii. image geo-positioning: image orthorectification with Rational Function Model (Tao and Hu, 2001) was applied on the images and the RMSEs were limited to 1 pixel, iii. conversion to TOA reflectance: the Flemming (2003) algorithm was adopted to convert DN values to reflectances in the study.

3. Methodology

The rationale of the aerosol retrieval is to first estimate the aerosol reflectances by decomposing the Top of Atmosphere (TOA) reflectances from surface reflectance and Rayleigh path reflectances. Aerosol retrieval over land is ill-posed problem since radiation intensity is reflected by various surface conditions such as dark to bright and geometrical position.

Aerosol retrieval over land, therefore, requires that highly accurate knowledge of surface reflectance.

Previous studies have been shown that the operational satellite retrieved products had a positive bias in comparison to ground truth data (e.g. Chu et al., 2002; Levy et al., 2005). Certain inherent problems in determining surface reflectance are major error source (Remer et al., 2005; Lee et al., 2007b; 2008b).

These results imply that inaccurate surface properties can lead to errors in aerosol retrieval.

For the determination of surface reflectances, a modified Minimum Reflectance Technique (MRT) (Herman and Celarier, 1997; Koelemeijer et al., 2003) is used. For conversion of aerosol reflectance to AOT,

comprehensive LUTs are constructed which consider the properties of local (Hong Kong) aerosol types from AERONET inversion data, as well as sun-viewing geometry, in the radiative transfer calculations. The schematic diagram is shown in Fig. 3.

1) Rayleigh scattering correction

Rayleigh scattering correction was first applied on three post-processed CHRIS satellite images using a fine resolution Digital Elevation Model (DEM).

Bucholtz (1995) introduced the following equation for calculating of the Rayleigh scattering optical thickness (Equation 1).

t

Ray

(l) = A l

_(B+Cl+D/l)

(Eq 1)

where A, B, C, D are the constants of the total Rayleigh scattering cross-section and the total Rayleigh volume scattering coefficient at standard atmospheric. P(z) is the pressure relevant to the height and it was determined by parameterised

p(z)

p

0

Fig. 3. Schematic diagram of the methodology.

(5)

barometric equation (Equation 2).

p(z) = p

0

exp [ ] (Eq 2)

The DEM (height z) was used for calculating the pressure p(z) on each pixel. g is the gravity acceleration (9.807ms

-2

) and T

surf

is the surface temperature which was assumed as 298K (Lee et al., 2007a).

2) Minimum Reflectance image

To determine referenced surface reflectance image, the MRT is used to extract the minimum reflectances among those series of CHRIS images from Rayleigh corrected images. The land cover changes and seasonal differencing are assumed to be neglectable.

A 5 by 5 kernel was generated and the minimum and maximum 20% of the pixels inside the window were removed due to the shadow and cloud effects. The reminding 60% of the pixels were averaged and then resampled to 90m. Since only nadir images were selected for surface reflectance estimation, BRDF effect was not accounted during the process.

3) Look Up Table construction

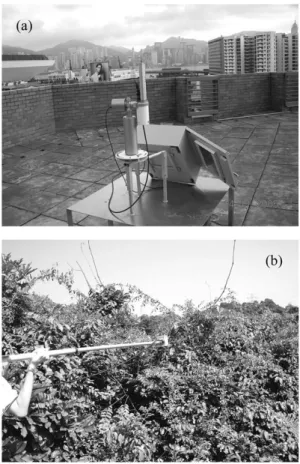
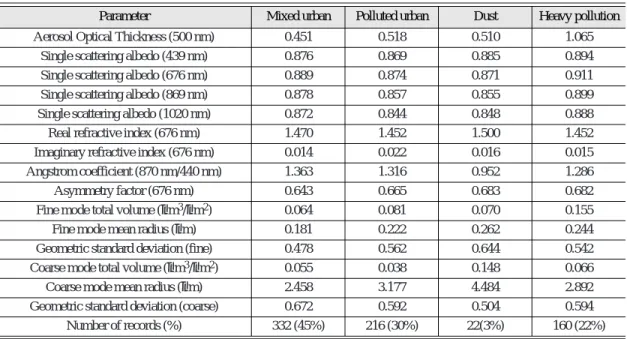
The satellite measured aerosol reflectances decomposing from TOA reflectances, surface reflectances and Rayleigh path radiance can be fitted to values calculated from known aerosol optical properties to derive the AOT from the image wavelengths. This study adopted the Santa Babara DISORT Radiative Transfer (SBDART; Ricchiazzi et al., 1998) model for creating the LUTs. Four aerosol types namely mixed urban, polluted urban, dust, and heavy pollution were derived using cluster analysis on three years of AERONET measurements in Hong Kong (instrument is shown in Fig. 4a). Table 1 shows the aerosol and microphysical properties, as well as the number of records for each cluster. For the

LUT construction, the above 4 aerosol models with particular solar zenith angles, view zenith angles, relative sun/satellite azimuth angles were considered.

The SBDART code uses the aerosol properties associated with a given model, plus the combinations of parameters to compute the hypothetical AOT.

Then, the satellite observed aerosol reflectances are compared to the set of hypothetical aerosol reflectances in LUT. For these comparisons, an optimal spectral shape-fitting technique was executed to select the aerosol model with the smallest systematic errors (Kaufman and Tanré, 1998; Costa et al., 1999; Torricella et al., 1999; Lee et al., 2007a) (Equation 3).

_

29.87 g 0.75 z 8.315 (T

SURF_

g 0.75 z)

Fig. 4. (a) CIMEL sunphotometer operating at HKPU site and

(b) MSR-16R multispectral radiometer for surface

reflectance measurement.

(6)

x

2

= ( )

2

(Eq 3)

The error term of x

2

is described as the residual of the measured aerosol reflectances r

mAer

(l

i

) from CHRIS and modeled aerosol reflectances r

cAer

(l

i

) from aerosol models. The minimum residual of is selected from the four aerosol types for each pixel.

Thus, the appropriate aerosol type is selected and the corresponding AOT values are then derived for each pixel.

4. Results

1) Validation with surface reflectance

Thirty nine ground-based reflectances were measured with MSR-16R multispectral radiometer (see Fig. 4b) on four winter dates: 21-Oct-2006, 29- Oct-2006, 05-Nov-2006 and 29-Dec-2006 (Fig. 5b).

It is assumed that vegetation does not change much in

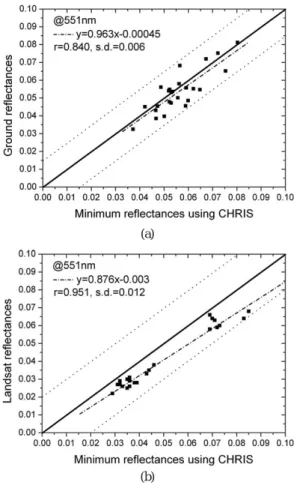
terms of reflectance in winter time, thus ground measurements taken by MSR-16R multispectral radiometer were used to validate the results from the winter MRT image. Fig. 6a depicts the relationship between ground-based reflectances and minimum reflectances at 551nm. It was found that the general differences between minimum reflectances and ground reflectances are within +/-1.5% and a high correlation (r=0.840) was obtained.

The ground-based measurements were only taken on vegetation areas. For those on bright and dark urban surfaces, check points were created based on atmospheric corrected Landsat Thematic Mapper (TM5) image on Dec-28-2006 (Fig. 5a). The Rayleigh and aerosol corrections were applied on the image and thirty-nine points were created (Fig. 5b).

The scatter plot in Fig. 6b shows the general differences are within +/-2% and strong correlation (r=0.951) are observed. And the RMSEs of both ground-based reflectances measured by MSR-16R radiometer and Landsat image are 0.99%, 1.19%, and r

mAer

(l

i

)

_

r

aAer

(l

i

)

r

mAer

(l

i

)

n i=1

S

1 n

Table 1. Summary of aerosol clusters

Parameter Mixed urban Polluted urban Dust Heavy pollution

Aerosol Optical Thickness (500 nm) 0.451 0.518 0.510 1.065

Single scattering albedo (439 nm) 0.876 0.869 0.885 0.894

Single scattering albedo (676 nm) 0.889 0.874 0.871 0.911

Single scattering albedo (869 nm) 0.878 0.857 0.855 0.899

Single scattering albedo (1020 nm) 0.872 0.844 0.848 0.888

Real refractive index (676 nm) 1.470 1.452 1.500 1.452

Imaginary refractive index (676 nm) 0.014 0.022 0.016 0.015

Angstrom coefficient (870 nm/440 nm) 1.363 1.316 0.952 1.286

Asymmetry factor (676 nm) 0.643 0.665 0.683 0.682

Fine mode total volume (mm

3

/mm

2

) 0.064 0.081 0.070 0.155

Fine mode mean radius (mm) 0.181 0.222 0.262 0.244

Geometric standard deviation (fine) 0.478 0.562 0.644 0.542

Coarse mode total volume (mm

3

/mm

2

) 0.055 0.038 0.148 0.066

Coarse mode mean radius (mm) 2.458 3.177 4.484 2.892

Geometric standard deviation (coarse) 0.672 0.592 0.504 0.594

Number of records (%) 332 (45%) 216 (30%) 22(3%) 160 (22%)

Parameter Mixed urban Polluted urban Dust Heavy pollution

(7)

1.53% at 485, 551 and 660nm respectively.

2) Validation with AERONET measurements

The AOT images at 442nm wavelength were derived from aerosol reflectances which have higher

contrast over urban and semi-urban areas. However, the Deep Blue Algorithm developed by Hsu et al.

(2004) also makes use of blue spectral region (412nm and 470nm) for deriving MODIS AOT images. They found a good agreement to compare with AERONET measurements, where the errors of AOT are within 30% over the sites in Nigeria and Saudi Arabia.

The CHRIS-derived AOT images were validated with AERONET sunphotometer measurements. A selected area of 100m

2

around the AERONET station was created for averaging the AOT values. Table 2 illustrates the summary of AOT from satellite and AERONET measurements. The differences between CHRIS-derived and AERONET AOT are 0.105 Fig. 5. (a) Atmospheric-corrected Landsat image, (b)

Minimum reflectance image overlaid with points from ground measurements and from Landsat image.

Fig. 6. Scatter plots of, (a) ground reflectances and minimum reflectances derived from CHRIS images, (b) Atmospheric corrected Landsat reflectances and minimum reflectances derived from CHRIS images.

(a)

(b)

(a)

(b)

(8)

(error=18%) on Feb-07-2006 and 0.051 (error=10%) on Nov-09-2006 respectively. Fig. 7 shows the CHRIS-derived AOT images on those three days.

The AOT value observed on Dec-18-2005 is relatively high compared to the others. The air quality

stations deployed by the Hong Kong Environmental Protection Department also recorded a high loading of Respiratory Suspended Particulates (RSP) (>100 mg m

-3

), which was between 5 and 7 times higher than non-polluted days. The observed high AOT and RSP values may be caused by the Hong Kong local traffic emission during the non-windy day and the cross-boundary pollutants transported in a south- southeast direction from industrial areas in Guangdong Province.

Table 2. AOT derived from satellite images and AERONET measurements

Date CHRIS-derived AERONET

AOT at 442nm at 440nm

Dec 18 2005 0.748 missing

Feb 07 2006 0.454 0.5595

Nov 09 2006 0.568 0.5127

Date CHRIS-derived AERONET

AOT at 442nm at 440nm

Fig. 7. CHRIS-derived AOT images on, (a) Dec 18 2005, (b) Feb 07 2006, (c) Nov 09 2006 at 442nm.

(a)

(c)

(b)

(9)

5. Discussion and conclusion

This study suggests that good results for aerosol retrieval can be obtained from a small satellite CHRIS/PROBA, with image-derived AOT showing considerable variation over urban city. The finer resolution AOT images provided here can also be used for calibrating or verifying air quality models over spatially complex regions. In the current study the greatest error sources in AOT retrieval are thought to be due to:

(i) The assumption of surface reflectance using MRT techniques. Although using only a few CHRIS images for deriving the surface reflectance image in this study, the results suggest that it is highly correlated with MSR-16 field measurements and atmospheric corrected Landsat image (r=0.840 and r=0.951 respectively) with an RMS error of 1.19% at 551nm. The AOT uncertainty estimated from the errors of surface reflectance ranges from 0 to 0.2 whereas the actual errors when the AOT images were validated against AERONET measurements are smaller, 0.1055 (error=18%) on Feb-07-2006 and 0.0510 (error=10%) on Nov-09-2006 at 442nm wavelength. Thus, the error contribution on AOT retrieval from surface reflectance is not significant and the uncertainty of surface reflectance can be claimed as reasonable and acceptable, and it indicates that the number of images for deriving surface reflectance using minimum reflectance technique is not as important as obtaining a cloud-free and clean- day image.

(ii) the assumptions in the aerosol model used which Chu et al. (2002) suggested can range from 0- 20%. However since aerosol models devised for Hong Kong were used, this error may be considerably reduced. Li et al. (2007) also indicated that the main causes of errors in AOT retrieval were due to the derivation of aerosol models and deviation of surface

reflectance. In this study, the localised and regional aerosol models from AERONET measurements were adopted, since the data for constructing the models is local, and thus likely to obtain a better result than global scale models. Therefore, errors derived from the aerosol model used would be limited.

Since nadir-viewing images were only tested in the study, there would be a great potential for combining off-nadir images to derive surface reflectance images.

To implement this, the BRDF model will be developed for normalizing off-nadir images. There is a need to acquire more CHRIS satellite images in the near future for the BRDF model and further verification.

Aerosol retrieval from satellite remains difficult, with errors of 10-18% in this study, 30% in MODIS Deep Blue algorithm and 20% in MODIS ocean algorithm. The error in retrieval is reduced by increasing the signal-to-noise ratio by resampling to 10km resolution. With finer resolution sensors for more spatially detailed estimates, as well as for retrieval of AOT over bright urban surfaces, the task is much more challenging, and probably requires customised platform-sensor combination which is offered by small satellites if suitable AOT retrieval algorithms can be demonstrated.

Acknowledgements

The authors would like to acknowledge the

European Space Agency (ESA) and Sira Electro-

optics Limited for providing the CHRIS/PROBA

datasets, Peter Fletcher for images acquired, and

Brent Holben for help with the Hong Kong PolyU

AERONET station. This study was supported by the

CERG grant of Hong Kong “PolyU 5253/07E”. The

research of K.H.Lee and Y.J.Kim was supported by

the Geostationary Ocean Color Imager (GOCI)

(10)

application research project funded by Korea Ocean Research & Development Institute (KORDI) and the National Research Foundation of Korea (NRF) grant funded by the Korea government (MEST) (No. 2008- 0060618).

References

Bucholtz, A, 1995. Rayleigh-scattering calculations for the terrestrial atmosphere, Appl. Optics, 34: 2765-2773.

Chu, A., Kaufman Y J, Ichoku C et al., 2002.

Validation of MODIS aerosol optical depth retrieval over land, Geophys. Res. Lett., 29(12): 1-4.

Costa, M. J., Cervino M., and Cattani, E., et al., 1999.

Aerosol optical thickness and classification:

Use of METEOSAT, GOME and modeled data. EOS-SPIE International Symposium on Remote Sensing. Proceedings of SPIE Vol.

3867, Satellite Remote Sensing of Clouds and the Atmosphere IV, J. E. Russell (Ed.), 268- 279.

Flemming, D., 2003. Ikonos DN value conversion to planetary reflectance. CRESS Project Paper, Commercial Remote Sensing for Systems Science, Maryland, US., Available online at http://www.geog.umd.edu/cress/papers/guide _dn2pr.pdf (2003).

Garcia, J. C. and Moreno, J., 2004. Removal of noise in CHRIS/Proba images: Application to the Sparc Campaign data. Proceeding of the 2nd CHRIS/Proba Workshop, ESA/ESRIN, Frascati, Italy, 28-30 April, 2004.

Herman, J. R., Bhartia, P. K., and Torres, O., et al., 1997. Global distribution of UV-absorbing aerosols from Nimbus 7/TOMS data, J.

Geophy. Res., 102: 16911-16922.

Hsu, N. C., Tsay, S. C., and King, M. D., et al., 2004.

Aerosol Properties Over Bright Reflecting Source Regions, IEEE Trans. Geosci. &

Remote Sens., 42(3): 557-569.

Hsu, N. C., Tsay, S. C., and King, M. D., et al., 2006.

Deep Blue Retrievals of Asian Aerosol Properties During ACE-Asia, IEEE Trans.

Geosci. & Remote Sens., 44(11): 3180-3195.

Kaufman, Y. J. and Tanré, D., 1998. Algorithm for remote sensing of tropospheric aerosol from MODIS, NASA MOD04 product report.

Koelemeijer, R. B. A., de Haan, J. F., and Stammes, P., 2003. A database of spectral surface reflectivity in the range 335-772 nm derived from 5.5 years of GOME observations, J. Geophy. Res., 108:4070. doi:10.1029/2002JD002429 Lee, K. H., C. S. Hong, and Y. J. Kim, 2004.

Atmospheric aerosol monitoring over Northeast Asia during 2001 from MODIS and TOMS data, Korean J. of Remote Sensing, 20(2): 1-11.

Lee, K. H., Kim, Y. J., and von Hoyningen-Huene, W., et al., 2006. Influence of land surface effects on MODIS aerosol retrieval using the BAER method over Korea, Int. J. of Remot.

Sens., 27(14): 2813-2830.

Lee, K. H., Kim, Y. J., and von Hoyningen-Huene, W., et al., 2007a. Spatio-Temporal Variability of Atmospheric Aerosol from MODIS data over Northeast Asia in 2004, Atmo. Environ., 41(19): 3959-3973.

Lee, K. H., Z. Li, and Y. J. Kim, 2007b. SWIR/VIS reflectance ratio over Korea for aerosol retrieval, Korean J. of Remote Sensing, 23(1):

1-5.

Lee, K. H., Lee, D. H., and Kim, Y. J., et al., 2008a.

MODIS 500 500m

2

Resolution Aerosol

Optical Thickness Retrieval and Its

Application for Air Quality Monitoring,

(11)

Advanced Environmental Monitoring, Young J. Kim and Ulrich Platt (eds.), Chap. 17, Springer, DOI:10.1007/978-1-4020-6364- 0_17.

Lee, K. H. and Y. J. Kim, 2008b. Difference between collection4 and 5 MODIS aerosol products and comparison with ground based measurements, Korean J. of Remote Sensing, 24(4): 369-379.

Levy, R. C., Remer, L. A., Martins, J. V., Kaufman, Y. J., Plana-fattory, A., Redemann, J., and Wenny, B., 2005. Evaluation of the MODIS aerosol retrievals over ocean and land during CLAMS. Journal of Atmospheric Science, 62: 974-992.

Levy, R. C., Remer, L. A., and Mattoo, S., et al., 2007. Second-generation operational algorithm: Retrieval of aerosol properties over land from inversion of Moderate Resolution Imaging Spectroradiometer spectral reflectance, J. Geophy. Res., 112, D13211.

Li, Z. Q., Niu, F., and Lee, K. H., et al., 2007. Validation and understanding of Moderate Resolution Imaging Spectroradiometer aerosol products (C5) using ground-based measurements from the handheld Sun photometer network in China, J. Geophys. Res., 2007, 112, D22S07, doi:10.1029/2007JD008479.

Remer, L. A., Kaufman, Y. J., Tanre, D., Mattoo, S., Chu, D. A., Martins, J. V., Li, R.-R., Ichoku, C., Levy, R. C., Kleidman, R. G., Eck, T. F., Vermote, E., and Holben, B. N., 2005. The MODIS aerosol algorithm, products and validation. Journal of the Atmospheric Sciences, Special Section, 62: 947-973.

Ricchiazzi, P., Yang S. R., and Gautier, C., et al., 1998. SBDART: A research and teaching software tool for plane-parallel radiative transfer in the Earth’s atmosphere, Bull.

Amer. Meteor. Soc., 79(10): 2101-2114.

Tanré, D., Kaufman, Y. J., and Herman, M., et al., 1997. Remote sensing of aerosol properties over oceans using the MODIS/EOS spectral radiances, J. Geophy. Res., 102: 16971- 16988.

Tao, C. V. and Hu, Y., 2001. A Comprehensive Study of the Rational Function Model for Photogrammetric Processing, Photogram.

Eng. & Remote Sens., 67(12): 1347-1357.

Torricella, F., Cattani, E., and Cervino, M., et al., 1999. Retrieval of aerosol properties over the ocean using global ozone monitoring experiment measurements: Method and applications to test cases, J. Geophy. Res., 104(D10): 12085-12098.

Wanner, W., Strahler, A. H., and Hu, B., et al., 1997.

Global retrieval of bidirectional reflectance and albedo over land from EOS MODIS and MISR data: Theory and algorithm, J. Geophy.

Res., 102(17): 143-162.

Wong, M. S., Nichol, J. E., and Lee, K. H., et al., 2009. High resolution aerosol optical thickness retrieval over the Pearl River Delta region with improved aerosol modeling, Sci.

in China Series D: Earth Sci., 52(10): 1641- 1649.

Wong, M. S., Lee, K. H., and Nichol, J., et al., in

press. Retrieval of aerosol optical thickness

using MODIS 500 500m

2

, a study in Hong

Kong and Pearl River Delta region, IEEE

trans. on geosci. & remot. sens.

수치

Fig. 2.  CHRIS images, acquired on (a) Dec-18-2005, (b) Feb-07-2006, and (c) Nov-09-2006.
Fig. 4.  (a) CIMEL sunphotometer operating at HKPU site and (b) MSR-16R multispectral radiometer for surface reflectance measurement.
Table 1.  Summary of aerosol clusters
Fig. 6.  Scatter plots of, (a) ground reflectances and minimum reflectances derived from CHRIS images, (b) Atmospheric corrected Landsat reflectances and minimum reflectances derived from CHRIS images.
+2

참조

관련 문서

LCD : Liquid Crystal Display PDP : Plasma Display Panel FED : Field-Emitting Display.. OLED O i Li ht E itti Di l OLED : Organic

• Development of systematic methods of analyzing optical systems with numerous elements. • Matrices for analyzing the translation, refraction, and reflection of

electric fields will be built up in such a direction as to restore the neutrality of the plasma by pulling the electrons back to their original positions... Al,

Phase profile of conventional DOE Obtained diffraction image. Optical vortices appear in the diffraction image generated by

The composition, structure, and optical properties of 3d-doped CdGa 2 O 4 crystals were studied Stoichiometry of these compound semiconductors were determined

The thickness of crose-sectional is decreased, the roughness of top surface is decreased as a function of the oxygen gas flow rate was increased.. The structure and

different chiral properties (+/– optical rotation).  diastereomers ~ different chiral

Fabrication and Optical Properties of Polysiloxane Hybrimer Resin Using Oligohydrosiloxane 1 (OPH 1).. Fabrication and Optical Properties of Polysiloxane Hybrimer