Vol. 17, No. 3, 2014, 179-186
http://dx.doi.org/10.5229/JKES.2014.17.3.179
− 179 −
Physioelectrochemical Investigation of Electrocatalytic Activity of Modified Carbon Paste Electrode in Alcohol Oxidation as
Anode in Fuel Cell
Javad Shabani-Shayeh1*, Ali Ehsani2, and Majid Jafarian1
1Department of Chemistry, Faculty of science, K. N. Toosi University of Technology , Tehran, Iran
2Department of Chemistry, Faculty of science, University of Qom, Qom, Iran (Received March 10, 2014 : Accepted July 17, 2014)
Abstract : Methanol electro oxidation on the surface of carbon paste modified by NiCl2/6H2O was studied in 1 M NaOH by potentiostatic and potentiodynamic methods. Ni/C catalyst by the concentration of 5% Ni showed about twice higher electro catalytic activity than Ni metal.
The amount of monolayer’s on the surface of electrode is almost one order higher for Ni/C than Ni electrode. The kinetic parameters and the diffusion coefficient of methanol were derived from chronoamperometry (CA) and electrochemical impedance spectroscopy (EIS) measure- ments.
Keywords : Methanol electro-oxidation, carbon paste, impedance, modified electrode.
1. Introduction
The increasing demand for higher quality, higher density power supplies with better time performance is one of the principle reasons that growth in the portable power production market is expected.1) Telecommunications, computers and the internet have already become practically essential for mod- ern human life. There is a growing market for fuel cells on mobile phones, laptops and other portable electric devices. Vehicular applications using fuel cells as a source of energy have also attracted con- siderable interest.2)
Direct methanol fuel cell is regarded a potential candidate for power generation in electric vehicles.
This stems from the facts that methanol is a rela- tively high energy density fuel, liquid at ambient temperature, low cost and available at industrial scale, the infrastructures for production and distribu- tion are already available.3-12) One of the impeding problems in the commercialization is perhaps the high over-potential associated with the direct elec-
tro-oxidation of methanol. Although electro-cata- lysts based on Pt13) and Pt-Ru alloys14,15) have been developed and indeed exhibit good activities, high costs of these materials are often very prohibitive.
A great deal of interest has recently been centered on the materials immobilized on to the electrode surface and capable of mediating fast electron trans- fer from methanol, namely its electro-oxidation.6-7) Nickel is a suitable metal for electro catalysis in alkaline media because of its low cost and abun- dance.16) Many types of catalysts containing nickel have been suggested e.g. Ni metal,17) nickel com- ple xe s ,1 8 ) po lym er w ith ni ck e l in co r por a te d electrode19-20) also Many works have been carried out on CPE Ni.21) Taraszewska and Roslonek22) found that Ni(OH)2 modified glassy carbon elec- trode acts as an effective catalyst for the oxidation of methanol. Van Effen and Evans23) found that the oxidation of ethanol on Ni in KOH solution involved the formation of a higher valent nickel oxide, which acts as a chemical oxidizing agent.
This fact was confirmed by both cyclic voltamme- try and impedance spectroscopy.24) Fleischmann sug- gested a three step for oxidation of nickel in alkaline media.25)
*E-mail: [email protected]
The purpose of the work is to present a new method for provide carbon paste modified with nickel chloride (NCMCPE) due to its low cost, ease of preparation, very high stability and study the electro-chemical oxidation of methanol on modi- fied electrode aiming at the elucidation of the mechanism, derivation of the kinetic parameters of the process and the viability of the electro-cata- lytic process.
2. Experimental 2.1. The chemicals
NiCl2.6H2O, sodium hydroxide, graphite, and metha- nol, used in this work were Merck products of analyt- ical grade and were used without further purification.
Double distilled water was used throughout.
2.2. The cell and instruments
Electrochemical studies were carried out in a conventional three electrode cell powered by an electrochemical system comprising of EG&G model 273 potentiostat/galvanostatand Solartron model 1255 frequency response analyzer. The system is run by a PC through M270 and zplot/zview com- mercial software via GPIB interface. The fre- quency range of 100 kHz to 10 mHz and the modulation amplitude of 10 mV were employed for impedance studies. A dual Ag-AgCl saturated KCl and a Pt wire electrode were used as the reference, and counter electrodes, respectively. All studies were carried out at room temperature.
2.3. Preparation of working electrode
Mixtures of NiCl2.6H2O and graphite powder with weighting ratio of (5:95) were added to dou- ble distilled water. Then the mixture heated and stirred by a magnet to evaporate the water, after that weighting ratio (75:25) of it and mineral oil was blended by hand mixing with a mortar and pestle for preparation of carbon paste. The resulting paste was then inserted in the bottom of a glass tube (with the area of 0.07 cm2).The electrical con- nection was implemented by a copper wire lead fit- ted into the glass tube. A fresh electrode surface was generated rapidly by extruding a small plug of the paste with a stainless-still rod and smoothing
the resulting surface on white paper until a smooth shiny surface was observed.
3. Results and discussion
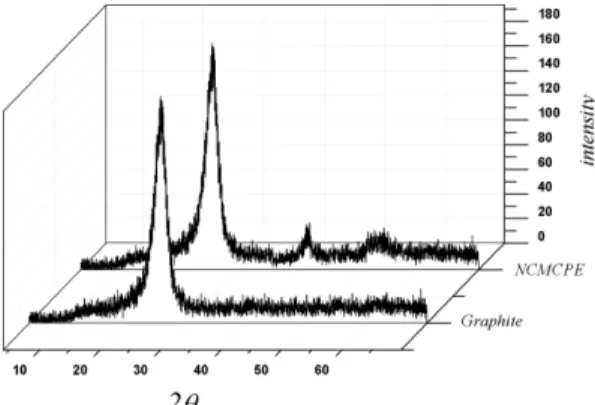
The XRD pattern of graphite and NCMCPE is shown in Fig. 1. As clearly seen, the existence of diffraction peaks at 2θ values 53.45 and 62.90 cor- responding to nickel chloride. The sharp peaks in 2θ= 28 is attributed to carbon base electrode. Fig.
2(a) shows the cyclic voltammograms (CVs) of the carbon paste electrode (CPE), CPE with NiCl2/ 6H2O (Fig. 2(b)) and NCMCPE (Fig. 2(c)), at the potential sweep rate of 10 mV/s in 1 M NaOH solution in the range of 0-750 mV (Ag/AgCl).
Modification process was done by 50 consecutive cycles with scan sweep rate of 100 mV/s in 1 M NaOH solution. As can be seen, no peak is
Fig. 1. XRD pattern of the G and NCMCPE electrodes.
Fig. 2. Cyclic voltammograms of CPE in the absence of NiCl2.6H2O (a) and with NiCl2.6H2O 5% (w/w) before modification (b) and after 50 cycles by scan rate of 10 mV/s in 1 M NaOH solution.
observed in the absence of NiCl2.6H2O and by presence of NiCl2.6H2O two redox peaks were appeared at 560 and 470 mV (Ag/AgCl) that are related to Ni2+/Ni3+reactions (Fig. 2(b)) that are enhanced up on an increasing the Nickel salt.
These redox peaks after modification were shifted respectively to 500 and 360 mV, pointing to higher energies (potential) required for nucleation of NiOOH in the first cycle. The entire behavior is in accordance with the data reported previously in the literature concerning the formation and inter-conver- sion of α- and β-phases of Ni(OH)2, its conversion to NiOOH and the enrichment of Ni3+species on or just beneath the surface. The changes of the peak’s position are likely due to the changes in the crystal structures of the nickel hydroxide and the nickel oxyhydroxide constituents of the electro-chemically formed surface film.26) In previous work,4) an enhanced base line current is shown in the first cycle due to Ni to Ni2+ oxidation, but now we already have Ni2+ species and that phenomenon does not appear. Fig. 3(a) shows the CV of NCM- CPE in 1 M NaOH solution at various potential sweep rates of 2-750 mV s−1. As can be seen, when the scan rate increases the anodic peak potentials shift to more positive and the cathodic peak poten- tials are slightly shifted toward cathodic direction.
Fig. 3(b,c) (inset) present the plot of anodic and cathodic peaks current against potential sweep rate at low values from 2-20 mV s−1. Fig. 3(d,e) point
to the electrochemical activity of the surface redox couple.27) By using following equation:
(11)
where Γ* is the surface coverage of the redox spe- cies and ν being the potential sweep rate taking average of both cathodic and anodic results, Γ* values of around 8.5×10⁻⁷mol cm−2 have been derived that is one order more than that of Ni electrode.16) The results shows the carbon paste improve the capability of nickel to produce mono- layers. Fig. 4(a) presents CVs of NCMCPE and NiCl2 in 1 M NaOH in the presence of the metha- nol. Fig. 4(b) Presents CVs of NCMCPE in 1 M NaOH at various methanol concentrations. With increasing methanol concentration, the cathodic peaks in the reverse cycle diminishes signifying a relation between methanol oxidation and the redox process involving Ni (III) / Ni (II) species.
As can be seen, in Fig. 4 the electro catalytic oxidation of methanol occurs only in the anodic and don’t continues in the initial stage of the cathodic half cycle. This can be attributed to adsorption of oxidation products on the electrode surface that prohibit the oxidation to continue.
Although this desorption still occurs at low metha- nol concentrations, some numbers of Ni+3 sites are free and oxidation continues. The plot of peak cur- rent vs. concentration is shown in Fig. 4(b) where
Ip n2F2 ---4RT
⎝ ⎠
⎛ ⎞ νAΓ ∗
=
Fig. 3. (a)Typical cyclic voltammograms of a NCMCPE in 1 M NaOH in the potential sweep rates of 2, 5, 10, 20, 50, 75, 100, 200, 500, 750 mVs−1, (b) the dependency of anodic and (c) cathodic peak currents to the sweep rate at lower values (2-20 mVs−1). (d) The proportionality of anodic and (e) cathodic peak currents to the square roots of sweep rate at higher values (20-750 mV/s).
the linear dependency of current peak and methanol concentration extends up to the concentration of 0.6 M methanol. Methanol oxidation in 1 M NaOH solution at 0.3 M methanol concentration at various potential sweep rates from 2 to 750 mV s−1is shown in Fig. 5(a). The pattern indicates that the rate of Ni (III) / Ni(II) redox processes far exceeds the rate of methanol oxidation. Also, plot of (Ip/ν1/2) against the potential sweep rate (ν) which presented in Fig.
5(b) point to the dominance of an EC' process.21)
Meanwhile, the anodic peak currents that are lin- early proportional to the square root of scan rate (Fig. 5(c)) suggest that the overall oxidation of methanol at this electrode is controlled by the dif- fusion of methanol from solution to the surface redox sites. Double potential step chronoamperome- try was also employed to investigate the electro- chemical processes. Fig. 6(a) shows the double-step Fig. 4. (a)Comparable cyclic voltammograms of NiCl2 and NCMCPE electrode in 1 M NaOH solution in the presence of the methanol and (b) cyclic voltammograms of NCMCPE electrode in 1 M NaOH solution with different concentrations of methanol of: (1) 0.1 M, (2) 0.2 M, (3) 0.3 M, (4) 0.4, (5) 0.5, (6) 0.6 M Methanol In Scan rate 10 mV/s. inset d shows ependency of the anodic peak current on the concentration of methanol in solution.
Fig. 5. (a) Typical cyclic voltammograms of the NCMCPE in 1 M NaOH in the presence of 0.3 M methanol at various scan rate: 2, 5, 10, 20, 50, 75, 100, 200, 500, 750 and mV/s.
(b) Dependence of anodic peak current during the forward sweep on the square roots of sweep rate. (c) The anodic current function (I/ν1/2) vs. potential sweep rate V/s.
Fig. 6. (a) Double steps chronoamperogams of NCMCPE electrode in 1 M NaOH solution with different concentrations of methanol of: (1) 0 M, (2) 0.1 M, (3) 0.2 M, (4) 0.3 M, (5) 0.4 M methanol. Potential steps were 650 mVand 300 mV, respectively. Inset (C) dependence of current (3) on t−1/2 derived from the data of chronoamperogams of (a) in the main panel. Inset (B) dependence of IC/IL on t1/2 derived from the data of chronoamperogams of (a) and (f) in the main panel.
chronoamperograms for the modified electrode by setting the working electrode potential at 650 mV (first step) and 300 mV (second step) for various concentrations of Methanol. The forward and reverse potential step chronoamperometry of the modified electrode in the blank solution showed an almost symmetrical chronoamperograms with almost equal charges consumed for the oxidation and reduction of surface confined Ni (II)/Ni (III) sites.
In the presence of methanol the anodic charge in forward step grows and the charge values associ- ated with the forward chronoamperometry is larger than that observed for the reverse chronoampero- grams (Fig. 6(a) (2)). The current is negligible when potential is stopped down to 300 mV, indicat- ing that the electro catalytic oxidation of methanol is irreversible. Also, chronoamperometry used for the evaluation of the rate of the chemical reaction between the methanol and modified layer (k) according to:
(1)
Where IC and IL are the currents in the presence and absence of methanol, and γ= kct is the argu- ment of the error function, k is the catalytic rate constant, C is bulk concentration of methanol and t is the elapsed time. In the cases where γ>1.5, erf (γ1/2) is almost equal to unity and the above equa- tion can be reduced to 19):
(2)
From the slope of the IC/IL versus t1/2 plot, pre- sented in Fig. 6c, the mean value of k for the con- centration range of 0.1 to 0.4 M of methanol was obtained as 1.4×104cm3mol−1s−1. Furthermore, with this method we can obtain the diffusion coefficient according to 19):
(3)
Using the slope of I against t−1/2, Fig. 5(b) shows the plot of I vs.t−1/2 with this data D was obtained as 3×10⁻⁶cm2s−1.
According to our previous works28-35) EIS have been employed in this work for presenting kinetic
parameters concerning methanol oxidation. Fig. 7 presents Nyquist diagrams of NCMCPE at the dif- ferent concentrations of methanol in solution of NaOH 1 M. Dc potential is 650 mV. As can be seen in this figure, two depressed semi-circles in the low and high frequency sides are witnessed. By the increasing of methanol concentration the diame- ter of two semi-circles is decreased. The semi-circle in high frequencies can be attributed to the combi- nation of charge transfer reaction resistance in electro- oxidation of methanol and double layer capacitance.
The depressed semi-circle in low frequencies is related to the adsorption of reaction intermediate on the electrode surface. Bode phase plots for the same system are shown in Fig. 8, two distinguish- able Peaks are observed in the Bode plots corre- sponding to two depressed semicircles in the Nyquist plot.
Ic⁄IL =γ π[ 1 2⁄ erf(γ1 2⁄ ) exp γ+ ( ) γ– ⁄ 1 2⁄ ]
Ic⁄IL =γ1 2⁄ π1 2⁄ =γ1 2⁄ (kct)1 2⁄
I = n FAD1 2⁄ C– 21⁄ t– 21⁄
Fig. 7. Nyquist diagrams of NCMCPE electrode in different concentration of methanol in 1MNaOH: (1) 0.1 M, (2) 0.2 M, (3) 0.3 M, (4)0.4 M. DC potential is 650 mV(Ag-AgCl).
Fig. 8. phase shift plot of NCMCPE electrode in different concentration of methanol in 1MNaOH: (1) 0.1 M, (2) 0.2 M, (3) 0.3 M, (4) 0.4 M. DC potential is 650 mV/Ag–AgCl.
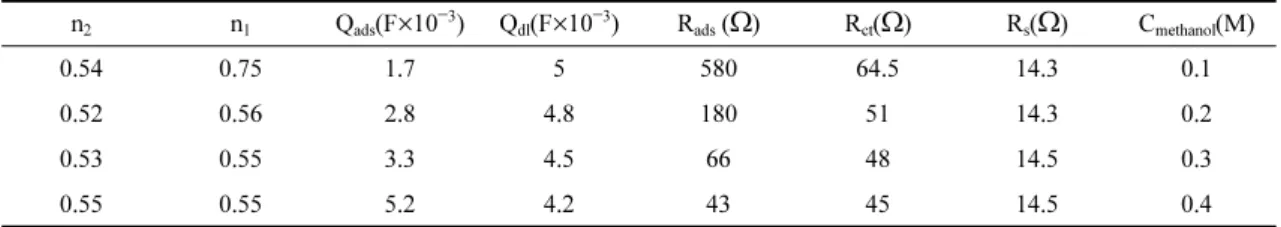
The equivalent circuit compatible with the Nyquist diagrams is presented in Fig. 9 that Rs, CPEdl, Rct, represents solution resistance, double layer constant phase element, charge transfer resis- tance and Rads, CPEads are related to adsorption resistance of methanol at the electrode surface and constant phase element for adsorption of methanol.
Table 1. Presents the values of the equivalent cir- cuit elements obtained by fitting the experimental results to the equivalent circuit. These results are useful for the estimation of kinetic parameters.
On the basis of our study that is consistent with the literature,36-41) the following mechanism is proposed for the electro-oxidation of methanol on NCMCPE and the corresponding kinetics is formulated. The electro oxidation of Ni+2 ion in the potential window:
(4)
Is followed by oxidation of methanol:
(5)
Where the intermediate is further oxidized to the products, format or carbonate, through similar medi- ated electro oxidation process:
(6)
In the above sequence of reactions, k1 and k−1 are
obviously potential dependent and are of the forms:
(7)
(8)
Where k0’s are the chemical rate constants mea- sured at /Ag,AgCl = 0, α being the anodic symmetry factor and other parameters have their usual meanings.
The rate laws for the reactions 1 and 2 have the forms of:
(9)
(10)
Where Γ is the total number of adsorption sites per unit area of the electrode surface, θ’ s represent the fractional coverage’s of different nickel valence states and Cm is the bulk concentration of methanol. With only the (II) and (III) valence states of nickel prevailing:
(11)
And the rates of changes of their coverage’s as well as that of the intermediate compounds being:
(12)
(13)
Where Ci is the concentration of intermediate.
Assuming that the steady state approximations dom- inating:
(14) Ni II( )↔v1 Ni III( ) e+ –
Ni III( ) methanol+ ↔v2 Ni II( ) intermediate+
Ni3++intermediate↔v3 Ni2++products
k1( )E k10exp αnf E( –E0) ---RT
=
k–1( )E k–01exp (α 1– )nf E E( – 0) ---RT
=
E E– 0
( )
v1 = k1ΓθII–k–1ΓθIII v2 =k2ΓθIIICm
θII+θIII = 1
dθII
---dt dθIII ---dt –
=
k1θII+k–1θIII+k2θIIICm+k3θIIICi –
=
dCi
---dt = k2θIIICm–k3θIIICi
dθII
---dt dθIII ---dt
– 0
= =
Table 1. The values of the elements in equivalent circuit 1 fitted in the Nyquist plots of fig. 6.
n2 n1 Qads(F×10−3) Qdl(F×10−3) Rads (Ω) Rct(Ω) Rs(Ω) Cmethanol(M)
0.54 0.75 1.7 5 580 64.5 14.3 0.1
0.52 0.56 2.8 4.8 180 51 14.3 0.2
0.53 0.55 3.3 4.5 66 48 14.5 0.3
0.55 0.55 5.2 4.2 43 45 14.5 0.4
Fig. 9. Equivalent circuits compatible with the Nyquist diagrams in Fig. 6.
(15)
One arrives at the values of the overages:
(16)
(17)
And subsequently:
(18)
On the basis of this rate equation the faradic current will be:
(19)
Where A being the surface area of the electrode and the corresponding charge transfer resistance is:
(20)
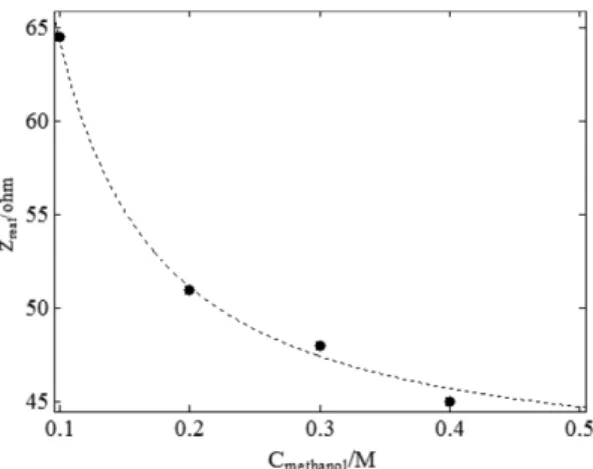
This last equation is well suited for the calcula- tion of the rate constants and the validity test of the kinetics and the mechanism. The methanol con- centrations dependency of Rct is presented in Fig.
10 when an initial sharp drop is terminated to very slow changes as the concentration of methanol is increased above 0.4 M. The results are fitted in Eq.
20 and the and the rate constant values were calcu- lated as k1= 2.3×10⁻⁷S−1, k−1= 3×10⁻⁹S−1 and k2= 2.6×103cm3mol−1S−1 have been calculated.
Fig. 11 shows the current density of some elec- trodes for oxidation of methanol in same concentra- tion with compared to NCMCPE. It is apparent that by using this electrode the electro catalytic activity of nickel enhanced because by use of only 5%
nickel in the electrode, the current density is more than Ni/Mn electrode and also Ni electrode that all the surface of electrode is Ni atoms. The results show that, the NCMCPE has better catalytic perfor- mance. This is mainly because of the really large surface area, and the better electronic and ionic conductivity of NCMCPE.
4. Conclusion
This work presents the preparation and usefulness of nickel hydroxide (oxide) modified carbon paste electrodes for methanol electro-oxidation in alka- line media. The electrode was electro-catalytically active around 650 mV (Ag/AgCl) where the CPE electrode possessed no activity. A kinetic model was developed and the kinetic parameters were cal- culated using the methanol concentration depen- dency of charge transfer resistance derived from the impedance studies.
References
1. G. Cacciola, Antonucci V., and Freni S., J. Power Sources, 100, 67 (2001).
2. J. M. Andu’ jar and F. Segura, Renew Sust Energ Rev, 13, 2309 (2009).
3. J. Ge and H. Liu, J. Power Sources, 142, 56 (2005).
dCi ---dt = 0
θII (k–1+2k2Cm) k1+k–1+2k2Cm
( )
---
=
θIII k1
k1+k–1+2k2Cm
( )
---
=
v1 2k1Γk2Cm k1+k–1+2k2Cm
( )
---
=
if 2FAk1Cm k1+k–1+2k2+Cm
( )
---
=
Rct dif
dE---
⎝ ⎠⎛ ⎞–1 (k1+k2+2k2Cm2) 2FAΓ k2Cmk1 2αFk2Cm
---RT k–1F ---RT
⎝ + ⎠
⎛ ⎞
---
= =
Fig. 10. Dependence of experimental Rct (•) on methanol concentration derived from the data of Nyquist diagrams in Fig. 6 and theoretical curve (---) on the basis Eq 17.
Fig. 11. Current density of some electrodes for oxidation of methanol in same concentration for compare with NCMCPE.
4. I. Danaee, M. Jafarian, A. Mirzapoor, F. Gobal, M. G.
Mahjani, Electrochim Acta, 55, 2093 (2010).
5. G. Orozco, M. C. Pérez, A. Rincón, and C. Gutiérrez, (2000) J. Electro Anal Chem, 495, 71 (2000).
6. L. Jiang, A. Hsu, D. Chu, and R. Chen, Int J. Hydrogen Energ 35, 365 (2010).
7. Xu Yuan hang, A. Amini, and M. Schell, J. Electroanal Chem, 398, 95 (1995).
8. S. Berchmans, H. Gomathi, and G. PrabhakaraRao, J.
Electroanal Chem, 394, 267 (1995).
9. F. Vogel, J. L. DiNaro Blanchard, P. A. Marrone, S. F.
Rice, P. A. Webley, W. A. Peters, K. A. Smith, J. W.
Tester, J. Supercrit Fluid, 34, 249 (2005).
10. I. Becerýk, S. Süzer, and F. Kadirgan, J. Electroanal Chem 502:118 (2001).
11. T. Okada, Arimuran, C. Ono, and M. Yuasa, Electrochim Acta, 51, 1130 (2005).
12. H. Heli, M. Jafarian, M. G. Mahjani, and F. Gobal F, Electrochim Acta, 49, 4999 (2004).
13. A. Aramata and W. Veerasai, Electrochim Acta, 36, 1043 (1991).
14. C. H. Lee, C. W. Lee, D. I. Kim, D. H. Jung, C. S. Kim, and D. RyulShin, J. Power Sources, 86, 478 (2000).
15. W. Tokarz, H. Siwek, P. Piela, and A. Czerwinsky, Elec- trochim Acta, 52, 5565 (2007).
16. I. Danaee, M. Jafarian, F. Forouzandeh, F. Gobal, and M.
G. Mahjani, Int. J. Hydrogen Energ, 34, 859 (2009).
17. M. A. Abdel Rahim, R. M. Abdel Hameed, and M. W.
Khalil, J. Power Sources, 134, 160 (2004).
18. A. Nozad Golikand, M. Asgari, M. Ghannadi Maragheh, and S. Shahrokhian, J. Electroanal Chem, 588, 155 (2006).
19. J. Raoof, A. Omrani, R. Ojani, and F. Monfared, J. Elec- troanal Chem, 633, 153 (2009).
20. R. Ojani, J. Raoof, and S. Fathi, J. Solid State Electr, 13, 927 (2009).
21. R. Ojani, J. Raoof, and P. Salmany-Afagh, J. Electroanal Chem, 571, 1 (2004).
22. J. Taraszewska and G. Roslonek, J. Electroanal Chem, 364, 209 (1994).
23. R. M. Van Effen and D. H Evans, J. Electroanal Chem., 103, 383 (1979).
24. A. J. Motheo, S. A. S. Machado, F. J. B. Rabelo, and Jr.
Santos, J. Brazil Chim Soc, 5,161 (1994).
25. M. Fleischmann, K. Korinek, and D. Pletcher, J. Elec- troanal Chem, 31, 39 (1971).
26. A. A. El-Shafei, J. Electroanal Chem., 471, 89 (1999).
27. A. Hamnett, CATAL TODAY, 38, 445 (1997).
28. A. Ehsani, B. Jaleh, and M. Nasrollahzadeh, J. Power Sources, 257, 300 (2014).
29. M. Nasrollahzadeh, A. Ehsani, A. Rostami-Vartouni, Ultrasound Sonochem, 21, 275 (2014).
30. A. Ehsani, F. Babaei, and M. Nasrollahzadeh, Applied Surface Science, 283, 1060 (2013).
31. A. Ehsani, M. G. Mahjani, M. Bordbar, S. Adeli, J. Elec- troanal. Chem., 710, 29 (2013).
32. M. Mahjani, A. Ehsani, M. Jafarian, SYNTH. METH, 160, 1252 (2010).
33. A. Ehsani, M. Nasrollahzadeh, MG. Mahjani, R.
Moshrefi, H. Mostaanzadeh, J. Ind. Eng. Chem, doi:
10.1016/ j.jiec.2014.01.045.
34. A. Ehsani, M. G. Mahjani, R. Moshrefi, H. Mostaanza- deh, and J. Shabani Shayeh, RSC Adv., 4, 38, 20031 - 20037 (2014).
35. A. Ehsani, M. G. Mahjani, and M. Jafarian, Turkish Jour- nal of Chemistry, 35, 1 (2011).
36. A. Ehsani, M. G. Mahjani, M. Jafarian, A. Naeemy A, Progress Organic Coating, 69, 510 (2010).
37. A. Ehsani, M. G. Mahjani, and Jafarian, Synth Met., 161, 1760 (2011)
38. A. Ehsani A, M. G. Mahjani, and Jafarian (2012) Synth Met., 162, 199 (2012).
39. A. Ehsani, M. G. Mahjani, M. Jafarian, and A. Naeemy, Electrochim Acta., 71, 128 (2012).
40. A. R. Feizbakhsh, A. Naeemy, A. Ehsani, A. Aghasi, and I. Danaee, J. Chiness Chem. Soc., 59, 1086 (2012) 41. A. Ehsani, S. Adeli, F. Babaei, H. Mostaanzadeh, M.
Nasrollahzadeh (2014) J. Electroanal Chem., 713, 91 (2014).