* This research was supported by Basic Science Research Program through the National Research Foundation of Korea (NRF) funded by the Ministry of Education, Science and Technology(2011-0022511).
† 교신저자:김성일 (경남대학교 전자공학과)
E-mail:[email protected] TEL:055-249-2632
FAX:0505-999-2162
공감각인지기반 컬러이미지-음악요소 변환에 관한 기초연구
A Basic Study on the Conversion of Color Image into Musical Elements based on a Synesthetic Perception
김성일†
Sung-Il Kim
†경남대학교 전자공학과
Department of Electronic Engineering, Kyungnam University
Abstract
The final aim of the present study is to build a system of converting a color image into musical elements based on a synesthetic perception, emulating human synesthetic skills, which make it possible to associate a color image with a specific sound. This can be done on the basis of the similarities between physical frequency information of both light and sound. As a first step, an input true color image is converted into hue, saturation, and intensity domains based on a color model conversion theory. In the next step, musical elements including note, octave, loudness, and duration are extracted from each domain of the HSI color model. A fundamental frequency (F0) is then extracted from both hue and intensity histograms. The loudness and duration are extracted from both intensity and saturation histograms, respectively. In experiments, the proposed system on the conversion of a color image into musical elements was implemented using standard C and Microsoft Visual C++(ver. 6.0). Through the proposed system, the extracted musical elements were synthesized to finally generate a sound source in a WAV file format.
The simulation results revealed that the musical elements, which were extracted from an input RGB color image, reflected in its output sound signals.
Key words: Synesthesia, Image-to-Music Conversion, Color Model, RGB-to-HSI Conversion, Musical Elements
요 약
본 연구는 컬러영상에서 특정소리를 연상시킬 수 있는 공감각 인지현상에 기반하여 컬러이미지에서 음악요소 로 변환하는 시스템의 구현을 최종 목표로 한다. 이는 빛과 소리의 물리적 주파수정보사이의 유사도를 기반으로 이루어진다. 입력 컬러영상은 우선 컬러모델변환이론에 기초하여 색상(Hue), 채도(Saturation) 및 명도(Intensity)영 역으로 변환된다. 음계, 옥타브, 크기 및 시간길이 등의 음악적 성분들이 HSI 컬러모델의 각 영역으로부터 추출 된다. 기본주파수(F0, Fundamental Frequency)는 색상 및 명도 히스토그램에서 추출되고, 크기 및 시간길이성분은 명도와 채도 히스토그램에서 추출된다. 실험에서, 제안된 시스템은 표준 C 및 VC++ 기반에서 실현되었고, 최종 적으로 WAV 포맷의 사운드파일이 생성되었다. 시뮬레이션 결과를 통해서 입력 컬러영상에서 추출된 음악적 요 소들이 출력 사운드신호에 반영됨을 알 수 있었다.
주제어: 공감각, 이미지-음악 변환, 컬러모델, RGB-to-HSI 변환, 음악요소
1. Introduction
Synesthesia (Cytowic, 2002; Robertson & Sagiv, 2004) is a neurological condition in which one sense is experienced through the perception of another sense.
Normal people have five basic senses that are isolated from one another. Sounds are processed by hearing;
images are perceived by vision; physical objects are sensed by our fingers, and so on. In synesthetes, the usual sensory stimuli of one modality can also evoke perceptions in additional unrelated senses.
Multiple forms of synesthesia exist, including visual, tactile, or gustatory perceptions, which are automatically triggered by a stimulus with different sensory properties.
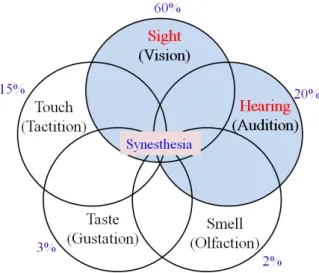
For example, one sense (such as hearing) is simultaneously perceived as if by one or more additional senses (such as sight). Therefore, it can be possible for synesthetes to see colors when hearing music. Fig. 1 shows the five kinds of elements which mutually influence in synesthesia (Cytowic, 2002).
Fig. 1. Five basic senses of synesthesia
There have been many studies related to the synesthetic perception in the fields of philosophical and neurological research. However, only a few studies have been made thus far, from the standpoint of engineering applications. Sight and hearing, particularly, account for a great part of bodily senses. Even though light and sound are different in frequency bands, they are identical in physical attributes because they can be explained by a
wave or a vibration. However, the studies on a mutual conversion between light and sound have not been done actively at home (Kim & Beak 2003) or abroad (Osmanovic & Myler, 2003; Matta et al., 2004; Bologna et al., 2009; Meijer, 1992; Ward & Tsakanikos, 2006;
Foner, 1999) up until the present.
The bodily senses, associated with both light and sound, have always coexisted in human beings. Light is the propagation of oscillations of electric and magnetic fields. It needs no material substance to propagate. The frequency of the oscillations of visible light is what we perceive as the color of light. Sound, on the other hand, is the propagation of mechanical vibrations through any material medium. The frequency of the vibrations is what we sense as the tone of the sound.
The ultimate goal of this study is to build a mutually natural conversion between sound and color image, by emulating human synesthetic skills. As a preliminary study, the related experiments have focused on the basic system for converting sound into a color image on the basis of synesthetic perception. As the major features of an input sound, both scale and octave elements extracted from F0 (fundamental frequency) were converted into both hue and intensity elements of HSI color model, respectively (Kim, 2012).
The present study, conversely, explores sound
expressions of a color image, focusing on both musical
elements extracted from an input color image and
synesthetic conversion methods. The musical elements
include notes, octaves, and tempos controlled by
loudness and rhythms controlled by time duration. The
musical notes and octaves, which are extracted from both
hue and intensity histograms, are synthesized to create a
fundamental frequency (F0). The tempos and rhythms
were extracted from both intensity and saturation
histograms, respectively. Through the processing of the
musical elements, a sound source in a WAV file format
is, finally, created as a synesthetic output.
2. The theory on both color images and musical elements
2.1. The theory on color images
A color model provides a means by which colors can be represented numerically. Models are usually optimized for a particular type of devices or for a purpose. The RGB color model is the most widely used color model, especially used in monitors, digital cameras, etc. In this model, The RGB is short for red, green and blue, located along the axes of the Cartesian coordinate system. The components of RGB in a digital representation are available in a range between 0 and 255. Black is represented as (0, 0, 0), whereas white is represented as (255, 255, 255). Gray scale colors are represented with identical R, G, B components.
The HSI color model is widely used in the fields of image processing because it represents colors similar to how human eyes perceive colors. The HSI is short for hue, saturation, and intensity where each domain ranges from 0 to 255 in pixels. The hue component describes the color itself by using an angle between 0 and 360 degrees in which 0 degree means red, 120 means green, and 240 means blue. The saturation component describes how much the color is polluted with white color. In the intensity range, 0 means black, 255 means white.
cos
min
(1)
(If B>G, H = 360
o- H)
The algorithm of a RGB-to-HSI color model conversion (Reinhard et al., 2008; Freeman, 2004) is described by the formulas of (1).
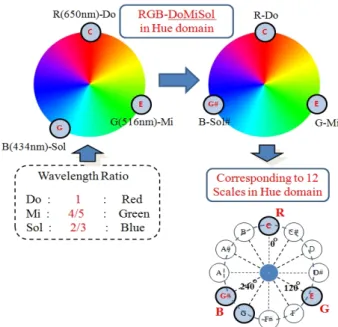
Fig. 2 shows an example of the RGB-to-HSI color model conversion using the formulas described above. In this study, the hue in the HSI color model is converted
into a musical note, and the intensity is converted into both octave and loudness. In addition, the saturation is converted into time duration of output sound signals.
Fig. 2. Example of conversion of RGB into HSI Color Model
Fig. 3 shows the process of converting visible frequencies into musical notes.
Fig. 3. The process of converting visible frequencies into musical notes
Sound waves perceivable to human ears range
approximately from 20Hz to 20Khz, whereas
electromagnetic waves perceivable to human eyes
roughly range from 390THz to 750THz, corresponding to
the visible frequency band. Particularly, the wavelength
ratio (Kim, 1999; Kim & Beak, 2003) of red, green and blue colors in the visible frequency band corresponds to the one of the musical notes C (Do), E (Mi) and G (Sol) in the audible frequency band. Therefore, a mathematical mapping method between audible and visible frequency bands can be found on the basis of the similarity in physical frequency information between light(or color) and sound.
In this study, however, we used the hue domain that was divided by a 30-degree angle, instead of using a frequency conversion formula (Kim, 1999), because it provides a more simple and intuitive method. Therefore, the divided hue domain corresponds to 12 equal-sized semitones in musical notes.
2.2. The theory on musical elements
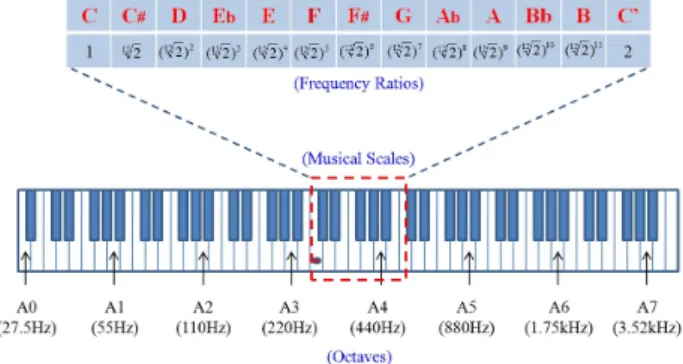
An octave can be divided into 12 equal-sized semitones which are the smallest musical intervals commonly used in Western tonal music (Loy, 2006; Loy
& Chowning, 2007). Fig. 4 shows the frequency ratios for twelve-tone musical notes and octave frequencies in an 88-keyboard ranging from A0 to C7.
Fig. 4. Frequency ratios for twelve-tone musical notes and octave frequencies
The frequencies of all intervals are based on one uniform semitone interval which changes at a rate of
. For some reference frequency
, we obtain the frequency
of any equal-tempered scale k(k=0,1,..,11) within the first octave by computing
×
(2)
in which
≅1.05946. For example, the frequency one semitone above
(440Hz) is
×
≅ 466.16Hz.
An octave, which is divided into twelve exactly equal intervals, is the interval between one musical pitch and another with half or double its frequency. Fig. 4 also shows the relationship between octave and frequency in musical scales in which a pitch played an octave higher is twice as high in pitch as the original. In addition, all 12 notes are spaced evenly inside this octave. The frequency
of any octave x of the reference frequency
is
×
∈ (3)
where ∈ means that x is an element of the set of all integers. If x=1, for example, then a tone with frequency
× is said to be one octave higher than
. If x=-1, the frequency of
is one octave below
because
×
.
Loudness in common music notation is expressed using performance indications such as p(Piano) or f(Forte) in which p(Piano) means a soft tone and f(Forte) means a loud tone. The decibels of sound pressure level(dB SPL) can be defined as
log
′(4)
where A is a reference amplitude, and A’ is the amplitude being measured. Simplifying by letting x=A’/A, we have
which is used in this study. For example, setting y=-6dB, we have
=0.501. The value of x is the coefficient by
which a signal must be multiplied to lower its amplitude
by 6dB. Fig. 5 shows the loudness set using decibels
defined in this study.
#define ffff dB(0)
#define fff dB(-1)
#define ff dB(-2)
#define f dB(-3)
#define mf dB(-4)
#define mp dB(-5)
#define p dB(-6)
#define ppd B(-7)
#define ppp dB(-8)
Fig. 5. Loudness set using decibels defined in this study
Duration in common music notation is expressed as a fraction of a whole note. For example, a whole note equals 4 quarter notes. Fig. 6 shows the duration set defined in this study:
#define Whole 1.0
#define Half 1.0/2.0
#define Quarter 1.0/3.0
#define Eighth 1.0/4.0
#define Sixteenth 1.0/5.0 Fig. 6. Duration set defined in this study
3. The conversion of color image into musical elements
For creating a sound signal from an input color image, an RGB-to-HSI color model conversion should be done as a first step. Fig. 7 shows the mapping relationship, as the next step, between a color image and its musical elements based on the similarity in each property (Kim, 1999; Kim & Beak, 2003). In this study, we used duration instead of timbre, which corresponded to saturation. As shown in the figure, the hue in the HSI color model is converted into a musical note, and the intensity is converted into a both octave and loudness. In addition, the saturation is converted into time duration of
output sound signals.
Fig. 7. Mapping relationship between HSI color model and musical elements
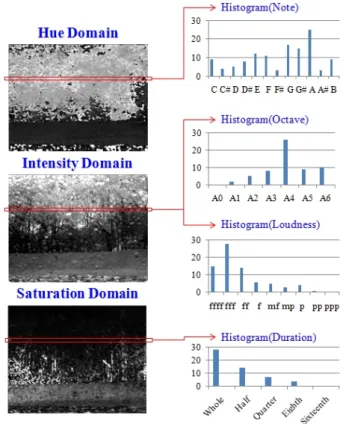
Fig. 8 illustrates the histograms of musical elements created from each color domain of the HSI color model.
Fig. 8. Histograms of musical elements created from each color domain
Each histogram is created from each pixel line in the height of color domains. The note histogram consists of 12 semitones, and the octave histogram consists of 7 different levels of octaves available on 88-key keyboards.
The loudness histogram consists of 9 different levels of
amplitudes, ranging from ppp to ffff, using decibels. In
addition, the duration histogram consists of 5 different
levels of time durations, ranging from the whole note to
the sixteenth note.
In this study, duration as a musical element is calculated by the following simple equations.
(5)
× ×
≤ ≤ (6)
≤ (7)
The spatial information in the saturation domain of an input image is simply converted into the temporal information of an output sound source. As a result, the temporal order of an output sound is defined as the equation (8) depending on both saturation and hight values of an input image.
sin
≤
(8)
In this equation, F0 means the fundamental frequency which is calculated by equations (2) and (3), while dB, the decibels of sound pressure level, is calculated by equation (4). In addition, Envel() as a sub-function should be declared in order to prevent rapid changes with a discontinuity around the boundary of the output waveform.
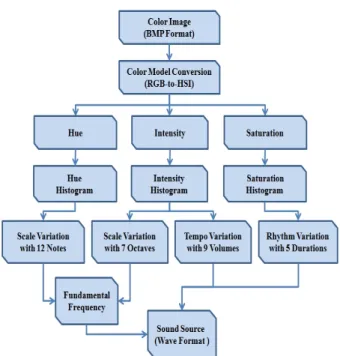
Fig. 9 shows an overall flow diagram of converting an input color image into an output sound source with musical elements. An input color image in a BMP file format is fed into the system; the hue, saturation, and intensity components are generated through the process of a RGB-to-HSI color model conversion. In the next step, the musical elements including note, octave, loudness, and duration are then extracted from each domain of the HSI color model.
Fig. 9. Overall Flow Diagram of Converting an Input Color Image into an Output Sound Source with Musical
Elements
Musical notes with 12 semitones and octaves with 7 different levels, which are extracted from both hue and intensity histograms, are synthesized to create a fundamental frequency (F0). Loudness with 9 different levels and duration with 5 different levels were extracted from both intensity and saturation histograms, respectively. Through the proposed system explained so far, the extracted musical elements were synthesized to finally generate a sound source in a WAV file format as a synesthetic output.
4. Experiments and results
The basic algorithm of the proposed system was implemented using standard C, and its visual interface was implemented using Microsoft Visual C++(ver. 6.0).
In this experiment, an output sound signal with musical elements was sampled at 8kHz and quantized at 8bits.
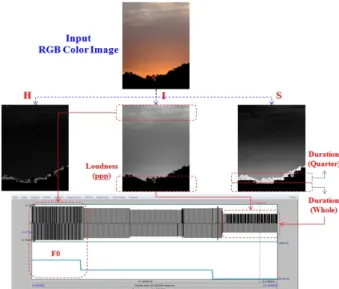
As shown in fig. 10, an input 24-bit true color image was converted into hue, saturation, and intensity domains. A fundamental frequency (F0) was then synthesized from both hue and intensity domains. In fig.
10(a) and (c), relatively more bright parts in the intensity
domain refer to higher octave components, so they
correspond to higher fundamental frequencies of an output sound waveform. On the other hand, relatively darker parts in the intensity domain refer to lower amplitudes of the output waveform. In addition, darker parts in the saturation domain refer to longer durations of the output waveform. As shown in this figure, a waveform with a certain length has a time duration created according to pixel lines in the height of saturation domain.
Fig. 10(b) shows an example of the enlarged envelope of the output sound waveform, which is represented in Fig. 10(a), in a WAV file format. This figure showed that the envelope at both ends in each input pixel line decreased to prevent a discontinuity around the boundary of the output waveform.
(a) Analysis of an Output Sound Source with Musical Elements extracted from an Input RGB Color
Image(400*300)
(b) The Enlarged Waveform of <b> in Fig. 11(a)
(c) Analysis of an Output Sound Source with Musical Elements extracted from an Input RGB Color Image
(321*432)
Fig. 10. Analysis of the Process of Converting an Input Color Image into an Output Sound Source with Musical
Elements