†교신저자:김정호 (한국과학기술연구원 의과학센터) E-mail:[email protected]
TEL:02-958-5590 FAX:02-958-6446
A Study on the Utilization of Information and Communication Assistive Devices for Bridging the Digital Divide of the Disabled
장애인 정보격차 해소를 위한 정보통신 보조기기 활용방안 연구
Jung-Ho Kim*†․Jun-Kyo Francis Suh*․Jun Koo**
김정호*†․서준교*․구교준**
Biomedical Science Center, KIST, Seoul, Korea*
한국과학기술연구원 의과학센터*
Department of Public Administration, Korea University, Seoul, Korea**
고려대학교 행정학과**
Abstract
The purposes of this study are to investigate and analyze the level of information and the state of digital divide of the disabled by surveying the demand for information and communication assistive devices, and to provide basic data for plans on the development and utilization of information and communication assistive devices. In order to understand the actual condition and the state of digital divide of persons with disabilities, the differences of possession and accessibility of information technology devices, usage ability, and utilization were analyzed according to the disability profile by using the T-test. The results show that there are significant differences (T=-2.510*) of possession and accessibility of information technology devices with respect to the disability profile, and that the disabled have lower possession and accessibility of devices than the non-disabled. Result of this study’s demand forecast shows that about 28% of total respondents are currently using information and communication assistive devices, and a majority (67%) of them answered that the use of assistive devices lend great help to their lives. The proportion of those who have been supported by the government or related organizations with information and communication assistive devices were 36% of the total respondents, and those satisfied with the performance of the devices were 46% of the total responses. Meanwhile, only 36% of total users answered that the operation and use of functions of the devices was easy and convenient, responding that the difficulty of operating assistive devices was the greatest inconvenience. Moreover, the general requests of respondents in regards to the devices were stabilization of device performance, miniaturization of size, simplification of buttons, and reduction of weight.
Keywords : disabled, digital divide, information and communication assistive devices, possession and accessibility,
usage ability, utilization, activate popularization of assistive devices요 약
본 연구의 목적은 정보취약계층인 장애인의 정보화 수준 및 정보격차 현황의 파악․분석과 정보통신기기
수요조사를 통해, 장애인의 정보격차해소를 위한 정책방향 제시와 정보통신 보조기기의 개발 및 활용방안 마 련을 위한 기초자료를 제공하는 것이다. 장애인의 정보격차 실태 및 현황 파악을 위해서, 장애여부에 따라 정 보통신 기기 보유 및 접근성, 사용능력(역량), 활용도에 차이가 있는지를 T검정을 통해 분석하였다. 그 결과 장애여부에 따라 정보통신 기기 보유 및 접근성에 유의한 차이가 나타났다(T=-2.510*). 본 연구의 수요조사 결 과, 정보통신 보조기기는 전체 응답자 중 약 28% 정도가 현재 사용하고 있는 것으로 분석되었으며, 다수의 응답자들이 보조기기의 사용이 실생활에 많은 도움을 준다고 답하였다(67%). 정부나 관련기관으로부터 정보 통신 보조기기를 지원받은 경험이 있는 경우는 전체 응답자 중 36%로 나타났으며, 기기의 성능 측면에서도 대체로 만족스러웠다는 의견이 전체의 응답의 약 46%로 나타났다. 한편 기능조작 및 사용법 측면에서는 쉽고 편리다고 응답한 경우가 사용 경험자 전체의 36%에 불과했는데, 가장 큰 불편사항으로는 보조기기 조작의 어 려움이라고 응답하였다. 이밖에 정보통신 보조기에 대한 전반적인 요구사항은 기기 성능의 안정화, 크기의 소 형화, 버튼의 간소화, 무게의 경량화 등이었다. 본 연구는 장애인을 대상으로 심층면접을 통해 정보통신 보조 기기의 이용 실태 및 수요를 구체적으로 밝힌 연구라는 점에서 의의가 있으며, 정보화기기 이용 시 보조기기 가 필요한 장애인을 위한 보급정책 수립과 선정 기준을 마련하는 데에도 활용됨으로써 정책 실효성 제고에 크게 기여할 것으로 판단된다.
주제어 : 장애인, 정보격차, 정보통신 보조기기, 보유 및 접근성, 사용능력, 활용도, 보조기기 지원, 보조기기 보급 활성화
1. Introduction
As information technology (IT) develops rapidly and its range of use widens, IT has assumed the vital role of supporting the disabled and the elderly for information acquisition and communication activities, which mediates social life. This study has been brought about from the socio-economic demand and political needs to support the disabled in the manner of integrating them into society, and to provide them with a better life, by resolving their digital divide and improving information accessibility. IT development in politics, economy, and society is making our lives more convenient. However, as our dependence on rapid technological changes is increasing, the class alienated from information, such as the disabled, the elderly, low-income families, and farmers and fishermen, who have trouble adjusting themselves to such changes, could severely be excluded from the benefits of the digital age. This is referred to as the information alienation phenomenon (Ko, 2006). That is, IT development affects the disabled, who are alienated from the right to access information, in both positive and negative aspects. First, the information- oriented society generates new work opportunities that
do not require physical ability for the disabled, therefore mitigating their economic situation and reducing their sense of alienation and lethargy. In addition, making Internet a way of life can relieve the sense of social isolation or alienation, problems that are caused by the weakening or lack of social contacts. On the other hand, the information society may generate a digital divide or information inequality between the general public and the disabled, deepening the social inequality. The digital divide problem means that social barriers, excluding physical barriers, exist because of the volume of information possession. In other words, it will be difficult for those who are not able to access and use IT to join political and social activities, and so their risk being excluded from society will be greater when the e-government, e-democracy, and remote education service become widespread in the future.
According to a survey on the digital divide of the disabled, as of the end of 2006, the computer possession rate of the disabled was 68.7%, a 2.5% increase compared with the previous year and 10.9% lower than the 79.6% nationwide whole homes computer possession rate. The Internet use rate of the disabled (7~69 years old) who were registered for in-home care in Korea was
46.6%, a 5.6% increase compared with the previous year but 28.2% lower than the 74.8% Internet use rate of the total population in Korea. Although the Internet use rate of the group most alienated from information among the disabled is increasing, the use rate gap between them and the total population is still great. The following is the rate of Internet use for different demographics:
women (54.6%), farmers and fishermen (13.8%), housewives (33.9%), jobless persons/other (32.5%), the visual/hearing impaired (30.5%), and persons with brain lesion disorders compared with those with other impairment patterns (33.9%). Also, those who are older, have lower academic background or have lower income appeared to have lower rates of Internet use (KADO, 2006; KISA, 2006). Like such, the digital divide problem interlinks with the general traits of the disabled population. This problem can be solved simply by supplying the disabled with information and communication assistive devices. They require an effective digital education along with the supply of devices. Accordingly, a survey of the demand and a grasp of the actual state relevant to information and communication devices needed to be carried out for the disabled, and reflecting it on the devices development, effective reduction of digital divide and build up of welfare information communication polices will secure information access for the class who can be alienated from the benefits of advanced information and communication of today due to their social, physical impairment leading them to more qualified life.
The procedure of this study is the following. First, we investigate and analyze the level of information and the digital divide of the disabled, a group that is alienated from information. Second, we survey the actual state and demand for information and communication assistive devices for the disabled. Third, we suggest a policy direction to resolve the digital divide for the disabled, and provide basic data to develop those devices in preparation of their usage.
2. THEORETICAL BACKGROUND
2.1. The status of information accessibility and the use of information and
communication assistive devices of the disabled
Accessibility is defined as the basic supply of physical way of use ‘facilities and universal demand of the users, who are different in adequacy’ (Bnyon et al., 2001), or
‘ability’, ‘skill’, ‘need’, ‘preference’ usage environment, contents, to attempt to access an object to use it (ISO, 1997). That is, the terms or characteristics enables the people who want to use the facilities, products, service or information to achieve the wants. In other words, people that can use their peripheral facilities, products, and services regardless of their physical or cognitive impairment are considered to have fundamental abilities (Office of Research Affairs IACF, 2005). Although remote controls, phones, and automatic doors were initially developed for the elderly and the disabled, everyone now use them for its convenience. The necessity and importance of such accessibility have been extended to the information and communication field due to the compatibility of various products and services, and the wide availability of mobile devices and services.
On May 2002, Korea created a standardization Forum consisting of experts for the improvement of information and communication accessibility by sharing information on technology trends, standardization, related laws, and systems necessary to secure accessibility of information and communication devices and services for the disabled and the elderly. This Forum consists largely of three divisions including the policy, information and communication division, the web accessibility division, and the operation division. There are about 100 members in the operation division. In 2005, the Forum applied national standards as well as group standards, and made best efforts to raise information and communication accessibility through active presentations home and abroad. It also raised awareness of the status of information and communication accessibility
standardization at the World Wide Web Consortium and seminars. It also probed actual state of information and communication assistive devices for the disabled in a comparative study of domestic and foreign screen reader and domestic software shortcut key. On September 2002, the Forum, jointly with the University of Toronto in Canada, pushed ahead with the development of the Korean version of ‘A-Prompt’ which can check automatically if a webpage observes accessibility and then adjust it corresponding to the international web accessibility evaluation guideline. The development was completed in August 2003, which was then distributed for free on the Forum’s homepage. In 2003, the Forum investigated the web accessibility recognition status with 300 homepage managers and designers, and in December, it introduced Korea Web Contents Accessibility Guideline 1.0 to TTA (Telecommunications Technology Association) as a group standard, which was finalized in 2004 (Hong, 2006).
Meanwhile, according to an analysis from KADO, currently, many disabled people are using various information and communication assistive devices in their everyday lives. As the function of the devices is diversifying, the use of the devices is gradually rising. A survey revealed that people with physical disabilities or brain lesion disorders mostly used the Korean keyboard MeToo (32% of the survey’s total subjects). 63.2% of the total subjects with visual impairment used Sense Reader, 45% of subjects with hearing and/or language impairment used the video phone TelePhoSe, and 45%
of the subjects with mental retardation used Touch Monitor. The survey revealed that the weekly mean number of times using information and communication assistive devices was 5.4 times. Especially, Braille Terminal, Bone Condition Tele-phone and Bone Conduction Hearing Aid were used almost every day (KADO, 2006).
2.2. The current state of digital divide between the disabled and the non-disabled
As the information-based society progresses, inequality occurs between those who have easy access to
information and services and others who do not have the same extent of access to information and the communication network. Network development is widening the gap in information use and its access (Seo, 2002). A characteristic of an information society is a network-centered society, and the importance of access is emphasized when a new human relationship is formed in a network-based society. When there is a divide between those who are allowed to enter a network-based society and those who are not, between those who can be connected on a network and those who cannot, and between those who are discriminated on a network and those who are not, it can cause great information inequality. Such a digital divide appears to be more severe in a network-based society. Thus, a digital divide is a phenomenon of an economic and social divide being intensified between those who have access to new digital technology and others who do not.
Selwyn (2002) discusses the multilateral concept of the digital divide, which is divided into access, use, and meaningful use of digital technology. As informatization progresses, IT is used in more various fields for various services. Another fact to note is that inequality between social groups grows depending on how properly those services are used. For this reason, the digital divide concept is following the complex multilateral concept, an idea in which information access and use are not equal between individuals and social groups. It indicates that the discussion over digital divide is increasing and evolving. Its concept and range in the universal environment of Internet is being settled as a part of daily life (Hwang et al., 2004).
Choi et al. (2003) structured an indicator system to measure information inequality, developed a summary measure to mark the information inequality degree as a figure, and then applied it to actual data. They considered information inequality degree as ‘the difference in the informatization degree of individual,’
and then defined individual informatization indicator as the concept consisting of recognition of the importance of information, information technology and information access, information technology use level, and the capacity of adopting oneself to informatization and
learning it. The results of individual informatization indicator being applied to the recognition survey data of KADO showed that the inequality in informatization access and information use was bigger than that in the recognition and ability for informatization.
In 2005, KADO calculated the digital divide index, which enables the measurement and analysis of the synthetically quantitative and qualitative digital divide level, aiming for effective policy build up for the reduction of the digital divide and performance evaluation. The digital divide index is a measurement indicator of the multilateral concept. It is able to measure and analyze the digital divide level and trait synthetically in access, ability, and use, which represents the relative digital divide level between the general public and the vulnerable class (the disabled, low-income families, farmers and fishermen) as index (Table 1) (Lee, 2006).
2.3. National policy direction for bridging the digital divide
National policy for resolving the digital divide was introduced due to the necessity at the welfare, social integration, and national effectiveness level. The national policy intervened to take on the role the market could not (KADO, 2004). The start of such a national policy for resolving the digital divide began in 1996, whereas the substantial drive for the policy began in 2000 (Office of Research Affairs IACF, 2005).
The government’s interest in digital divide reduction through policy diffused gradually in four stages. The first stage began in the early 1990s, with a project of the local digital center build up and computer education for farming and fishing villages, which was a local-centered idea contrasted with the central area. In the second stage, the informatization support project for an Internet-based area and the device supply project were carried out in the mid-1990s. Then in the late 1990s, build up of facilities for Internet use and the Internet education support project began with a full-scale of Internet supply.
However, the pan-government’s political interest in digital divide reduction began in the early 2000s in the
fourth stage. The fourth strategy meeting for informatization was held on April 6, 2000, to set up concrete plans and direction for the pan-government’s synthetical measures to reduce the digital divide (Table 2) (KADO, 2004).
Table 1. Measurement concept for digital divide index (Lee, 2006)
Type Measurement Concept
Integrated divide index
•Divide measurement in digital level with accessibility, usage ability and utilization sections integrated
Access divide index
•Divide measurement in access level to information-telecommunication infrastructure such as computer, Internet, etc.
-Extent of information and communication devices possession, PC model, Internet access speed, possibility level for computer, Internet access when needed Usage ability
divide index
•Divide measurement in the ability of using computer and Internet
Quantitative use divide index
•Divide measurement in quantitative use of computer and Internet
-Use rate and hour of computer and Internet
Qualitative use divide index
•Divide measurement in qualitative use of computer and Internet
-Aid degree in daily life such as work(studies), housework, leisure, social activities and communication and human relationships; use degree as recommended
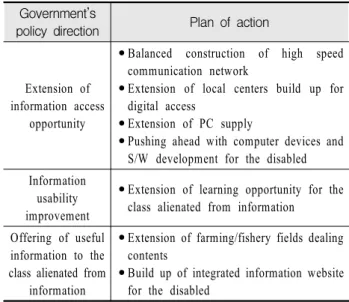
Table 2. Policy direction for digital divide reduction (KADO, 2004)
Government’s
policy direction Plan of action
Extension of information access
opportunity
•Balanced construction of high speed communication network
•Extension of local centers build up for digital access
•Extension of PC supply
•Pushing ahead with computer devices and S/W development for the disabled Information
usability improvement
•Extension of learning opportunity for the class alienated from information
Offering of useful information to the class alienated from
information
•Extension of farming/fishery fields dealing contents
•Build up of integrated information website for the disabled
As Internet use is being generalized and its meaningful use range is widening gradually, the necessity for universal access to the Internet for the disabled and the elderly is also increasing. With the information form and transmission method being more complicated and more varied, the digital divide could be a factor for causing another barrier for the disabled who are unable to have proper information access due to their physical impairment. In addition, the onset of an aging society highlights the importance of informatization on welfare policies. With such a background, in January 2001, a digital divide reduction related law was enacted to increase opportunities for information access for the so-called second-class citizens, such as low income earners, residents in farming and fishery areas, the disabled, the elderly, and women. And then in September 2001, 14 government departments, including the Ministry of Information and Communication (MIC), jointly established the “Integrated plans for digital divide reduction,” which was the real start of the pan-government efforts for digital divide reduction (Hwang et al., 2004).
As such, national recognition of the seriousness of the digital divide began since the mid-1990s, and the efforts to reduce it was made in many ways, such as through legislation. However, many of the disabled still do not receive benefits from the welfare information communication due to their impairment as well as because of the social and economic conditions. Also, securing the opportunity to use information actively for the whole nation was not a clear purpose of legislation, and so the difficulties in digital divide reduction is still prevalent.
2.4. Development & supply of information and communication assistive devices for the disabled
MIC and KADO have supplied the disabled with information and communication assistive devices and special software since 2003, contributing to the improvement of their information access and usage. Due to the development of information and communication,
various assistive devices which are very helpful to many of the disabled have been released, but because their small market and high prices, they are not easily purchasable (KADO, 2007).
The results of the survey by KADO in 2007, which was carried out with the intention to have assistive devices available according to function, showed that people with different disabilities desired different devices as the following. People with visual impairment wanted braille terminal (39.8%), people with hearing/language impairment wanted hearing aids (37.8%) and TV insert receivers (44.1%), and people with physical disabilities or brain lesion disorders wanted special keyboards (23.8%) and touch monitor/touch screens (44.7%), indicating that they greatly wanted products high in recognition and in use. Meanwhile, most of the respondents with disabilities did not get the devices because they were unable to use a computer (49.3%, the top reason) or they did not need the devices (23.9%).
However, 13.7% did not get the devices because they did not know much about the devices or the problems the devices caused. Those with disabilities who have a PC and want to buy it later on and have never used information and communication assistive devices before were set as the disabled people unable to use without the devices or absolute device-dependent, or partially device-dependant disabled people. The number of disabled people measured for devices supply as an act of policy drive was 362,244 (27.4% of the target population). The number of absolute device dependant disabled people who were set to get the devices preferentially was 136,637 (10.2% of the target population). Meanwhile, those with physical disabilities, being the greatest in number among the disabled, accounted for the greatest portion of the population for getting the devices preferentially (KADO, 2007).
3. RESEARCH METHOD & PROCEDURE
This study investigated and analyzed the information level and the digital divide status for the disabled, and conducted a demand survey to suggest an effective solution and a development direction for the use of
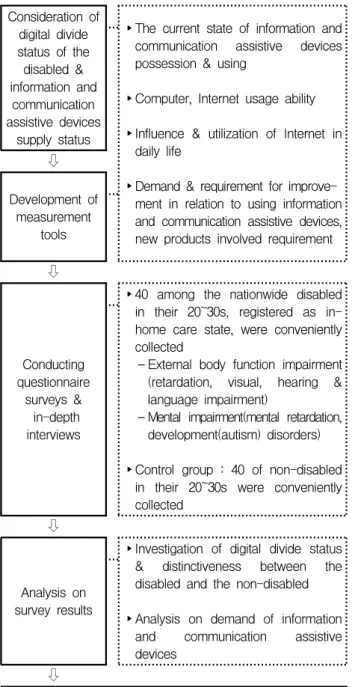
information and communication assistive devices to resolve the digital divide of the disabled. Fig. 1 shows the study procedure.
Consideration of digital divide status of the disabled &
information and communication assistive devices
supply status
▸The current state of information and communication assistive devices possession & using
▸Computer, Internet usage ability
▸Influence & utilization of Internet in daily life
▸Demand & requirement for improve- ment in relation to using information and communication assistive devices, new products involved requirement
⇩
Development of measurement
tools
⇩
Conducting questionnaire
surveys &
in-depth interviews
▸40 among the nationwide disabled in their 20~30s, registered as in- home care state, were conveniently collected
-External body function impairment (retardation, visual, hearing &
language impairment)
-Mental impairment(mental retardation, development(autism) disorders)
▸Control group : 40 of non-disabled in their 20~30s were conveniently collected
⇩
Analysis on survey results
▸Investigation of digital divide status
& distinctiveness between the disabled and the non-disabled
▸Analysis on demand of information and communication assistive devices
⇩
Proposal of effective improvement and development direction and utilization of information and communication assistive devices to resolve digital divide for the disabled
Fig. 1. Study procedure
3.1. Subjects & scope of the survey
40 disabled people in their twenties and thirties who were registered for in-home care and graded with external body impairments (paralysis, visual, hearing, language, etc.) or mental disorders (mental retardation, development disorders, such as autism, etc.) were selected for the survey. 40 non-disabled people aged 20~30s were also selected for the survey.
Insincere responses were excluded, and 36 questionnaires from each group, the disabled and the non-disabled, were selected and then analyzed. Subjects were divided by disability type. 12 subjects had visual impairment, 11 subjects had hearing impairment, 8 subjects had physical disabilities, 3 subjects had brain lesion disorders, and 2 subjects had language disorders. The subjects were then divided according to disability grades. 15 subjects had grade 1 disability, 15 subjects had grade 2 disability, and 6 subjects had grades 3~5 disability, indicating that 83%
of the total number of the disabled had grades 1~2 disability, the most severe disability level. In regards to their academic background, 30 subjects (83%) did not graduate high school, and 29 subjects (80%) had a monthly income of less than 1 million won.
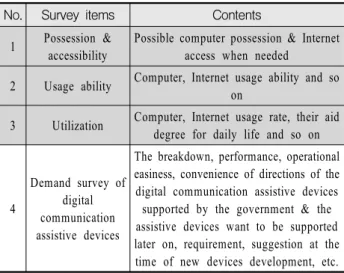
3.2. Study contents & measuring tools
The contents of this study focus on information and communication devices use status. The survey consisted of questions regarding information and communication devices possession and accessibility, usage ability, and utilization for both the disabled and the non-disabled.
Questions regarding the demand for and requirements of the devices and new products were added to the questionnaire only for the disabled group (Table 3). The decision was made based on previous studies, including the survey of digital divide conducted in 2006 and the questions of the devices demand status conducted in 2007 by KADO. The reliability and validity of the measurement tools (questionnaire) were verified by the professional advice of a welfare expert and another expert involved in KADO digital communication assistive devices.
Table 3. Items of digital divide surveys & in-depth interviews (KADO, 2006 ; KADO, 2007)
No. Survey items Contents
1 Possession &
accessibility
Possible computer possession & Internet access when needed
2 Usage ability Computer, Internet usage ability and so on
3 Utilization Computer, Internet usage rate, their aid degree for daily life and so on
4
Demand survey of digital communication assistive devices
The breakdown, performance, operational easiness, convenience of directions of the digital communication assistive devices supported by the government & the assistive devices want to be supported later on, requirement, suggestion at the time of new devices development, etc.
※ The shaded parts are the common questions for both the disabled and the non-disabled.
3.3. Survey method
From April 1 to 20, 2008, one researcher and three research assistants visited the homes of the disabled in Seoul and Gyeonggi areas, and carried out the survey using the measuring tools (questionnaire) developed by this study in a method of a question-and-answer interview. Especially, the data of concrete statements from in-depth interviews were recorded for qualitative analysis. However, for the respondents with whom communication were difficult, indirect surveys were carried out with the help of a social worker. Moreover, 40 non-disabled people living in Seoul and Gyeonggi areas were selected for question-and-answer interviews as well.
4. RESULT & DISCUSSION
4.1. The current state of digital divide for the disabled
4.1.1. Digital divide between the disabled and the non-disabled
This study carried out questionnaires and in-depth interviews to investigate the differences in information and communication devices accessibility, usage ability,
and use degree to analyze the differences in the actual and current state of digital divide between the disabled and non-disabled. About 88% of the disabled group responded yes to the question asking if they had computers or could use them, while everyone in the non-disabled group responded yes. For the question asking if they could access the Internet, about 74% of the disabled group responded yes, compared to about 90% of the non-disabled group.
In regards to usage ability, the responses to the questions of computer and Internet usage ability, and ability to connect digital devices to PC for use, were analyzed. In regards to computer usage ability, they were asked if they were able to use word processors, spreadsheets, and presentations. About 51% of the disabled group said yes, while about 83% of the non-disabled group said yes. Furthermore, in regards to Internet use ability, they were asked if they were able to use Web browsers, data and information search, e-mail, and Internet-based multimedia. 58% of the disabled group said yes, while 94% of the non-disabled group said yes. For the question asking if they were able to use digital devices by connecting to a PC, 47% of the disabled group said yes, while 94% of the non-disabled group said yes.
In regards to how effectively they use information and communication devices, 44% of the disabled group answered that the devices were very helpful in their daily lives and used them greatly, while 78% of the non-disabled said it was helpful. Especially in information and communication devices use ability and utilization, the non-disabled group had an average twice as high than the disabled group.
Moreover, in regards to daily computer or Internet use, everyone in the non-disabled group said that they used them almost every day, while only 41.6% of the disabled group used it daily. Also, the average hours of computer or Internet use per day was 2.2 hours for the disabled group and 6 hours for the non-disabled group, indicating that the disabled group used the computer or Internet much less compared with the non-disabled group.
4.1.2. Statistical hypothesis testing on digital divide between the disabled and the non-disabled.
This study was analyzed to see if statistically significant differences exist in the three aspects causing digital divide including information and communication devices possession and accessibility, usage ability, and practical utilization, between the disabled and non-disabled groups. Analysis was conducted after categorizing the participants of the disabled group according to disability pattern, disability grade, and income level. The disabled categories are: people with visual impairment, people with hearing impairment, people with severe impairment of grades 1 and 2, and the disabled earning less than one million won monthly. The differences between these groups and the non-disabled group were analyzed, and the group differences between the visually impaired and auditory impaired were also analyzed. Independent- Samples T-Test was carried out using SPSS for the analyses.
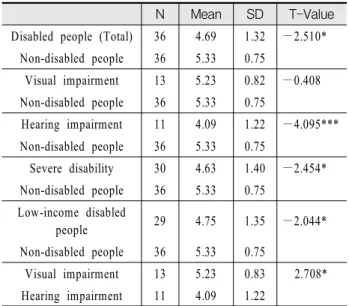
First, the analysis on the differences in devices possession and accessibility by group showed significant differences between the disabled and the non-disabled groups as seen in Table 4 (T=-2.510*). For the questions of devices possession and accessibility, out of the total score of 7, the mean score was 4.69 for the disabled group and 5.33 for the non-disabled group, indicating that the disabled group had less devices possession and accessibility compared with the non-disabled group.
Significant differences also existed between the people with hearing impairment and the non-disabled, between the people with severe impairment and the non-disabled, and between the disabled with low income and the non-disabled. The mean scores were as the following:
4.09 for the auditory impaired group, 4.63 for the severely impaired group, and 4.75 for the low income earning disabled group. The differences were particularly great between the hearing impaired group and the non-disabled group, wherein the hearing impaired group had a much lower mean for information and communication devices holding and accessibility compared with the non-disabled group. The difference
between the visually impaired group and the hearing impaired group was analyzed, and its results showed that the mean score of the visually impaired group was 5.23, while the mean score for the hearing impaired group was 4.09, indicating that the two groups of different disability patterns have significant differences in devices possession and accessibility. Meanwhile, there were insignificant differences between the visually impaired group and the non-disabled group. The mean score of the visually impaired group was 5.23, almost the same as the mean score of 5.33 for the non-disabled group.
Table 4. The differences in information and communication devices possession & accessibility between the disabled and the non-disabled
N Mean SD T-Value
Disabled people (Total) 36 4.69 1.32 -2.510*
Non-disabled people 36 5.33 0.75
Visual impairment 13 5.23 0.82 -0.408 Non-disabled people 36 5.33 0.75
Hearing impairment 11 4.09 1.22 -4.095***
Non-disabled people 36 5.33 0.75
Severe disability 30 4.63 1.40 -2.454*
Non-disabled people 36 5.33 0.75 Low-income disabled
people 29 4.75 1.35 -2.044*
Non-disabled people 36 5.33 0.75
Visual impairment 13 5.23 0.83 2.708*
Hearing impairment 11 4.09 1.22
*p < .05, **p < .01, ***p < .001
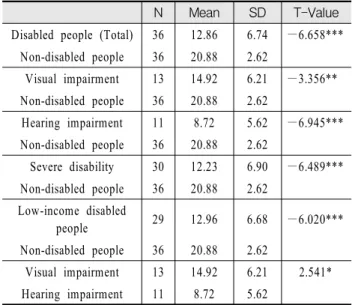
Second, the analysis carried out to find out if there were any differences in the using ability of information and communication devices between the disabled and the non-disabled showed significant differences (T=-6.658***).
The mean of the disabled group was 12.86 out of the maximum mean of 23 for the questions on information and communication devices, while the mean for the non-disabled group was 20.88, indicating a great difference between the two groups. As seen through the average differences between the groups, the ability of using information and communication devices of the disabled was inferior to the non-disabled. The differences between the groups were analyzed between the visually
impaired group and the non-disabled group, between the hearing impaired group and the non-disabled group, between the severely impaired group and the non-disabled group, and between the low income earning disabled group and the non-disabled. Every comparison showed a significant difference. The means were as the following: 14.92 for the visually impaired group, 8.72 for the hearing impaired group, 12.23 for the severely impaired group, and 12.96 for the low income earning disabled group, indicating that the disabled group had lower means compared to the non-disabled group in every comparison. Moreover, the visually impaired group and the hearing impaired group showed considerable differences in using ability of information and communication devices, wherein the former had a higher mean score of 14.92 than the latter which had a mean score of 8.72 (refer to Table 5).
Table 5. The differences in usage ability of information and communication devices between the disabled and the non-disabled
N Mean SD T-Value
Disabled people (Total) 36 12.86 6.74 -6.658***
Non-disabled people 36 20.88 2.62
Visual impairment 13 14.92 6.21 -3.356**
Non-disabled people 36 20.88 2.62
Hearing impairment 11 8.72 5.62 -6.945***
Non-disabled people 36 20.88 2.62
Severe disability 30 12.23 6.90 -6.489***
Non-disabled people 36 20.88 2.62 Low-income disabled
people 29 12.96 6.68 -6.020***
Non-disabled people 36 20.88 2.62
Visual impairment 13 14.92 6.21 2.541*
Hearing impairment 11 8.72 5.62
*p < .05, **p < .01, ***p < .001
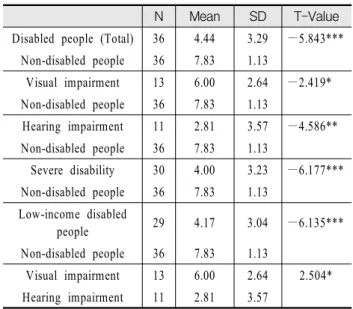
Third, Table 6 is the results of the analysis carried out to detect if there were any differences in practical utilization level of information and communication devices between the disabled and the non-disabled. As seen in Table 9, the differences in practical utilization level of information and communication devices between the disabled group and the non-disabled group showed
considerable differences (T=-5.843***). The disabled group had a mean of 4.44 out of 10, for the questions on practical use level of information and communication devices, while the non-disabled group had a mean of 7.83, indicating that the disabled group had a lower practical utilization level of information and communication devices. This comparison was also applied between the visually impaired group and the non-disabled group, between the hearing impaired group and the non-disabled group, between the severely impaired group and the non-disabled group, and between the low income earning disabled group and the non-disabled. These comparisons also showed significant differences just like the analyses on the differences in use ability. The severely impaired group and the low income earning disabled group compared to the non-disabled group showed significant differences. That is, the severely impaired group and the low income earning disabled group had much lower practical utilization level compared with the non-disabled group.
The mean was 6.00 for the visually impaired group, 2.81 for the hearing impaired group, 4.00 for the severely impaired group, and 4.17 for the low income earning disabled group. The visually and hearing impaired groups showed significant differences in practical utilization level of information and communication devices, wherein the visually impaired group had a much higher mean in that level, similar to the use ability case. The mean of the visually impaired group was 6.00, while the mean of the hearing impaired group was 2.81.
In short, the disabled and the non-disabled showed differences in information and communication devices possession and accessibility, usage ability, and practical utilization level, which could be the indicators of digital divide. The differences were greater in use ability and practical utilization level rather than in devices possession and accessibility.
The 2006 KADO digital divide index and analytical data of status survey (Lee, 2006) showed that the disabled, compared with the non-disabled, had lower mean scores in information access level (85.4%), information processing ability (computer and Internet use ability) (61.0%), and practical utilization level
Table 6. The differences in practical usage level of information and communication devices between the disabled and the non-disabled
N Mean SD T-Value
Disabled people (Total) 36 4.44 3.29 -5.843***
Non-disabled people 36 7.83 1.13
Visual impairment 13 6.00 2.64 -2.419*
Non-disabled people 36 7.83 1.13
Hearing impairment 11 2.81 3.57 -4.586**
Non-disabled people 36 7.83 1.13
Severe disability 30 4.00 3.23 -6.177***
Non-disabled people 36 7.83 1.13 Low-income disabled
people 29 4.17 3.04 -6.135***
Non-disabled people 36 7.83 1.13
Visual impairment 13 6.00 2.64 2.504*
Hearing impairment 11 2.81 3.57
*p < .05, **p < .01, ***p < .001
(quantitative, qualitative information use level (67.8%, 62.0%). The differences were even greater in information processing ability and practical utilization level, which agrees with the results of this study. KADO’s data also agrees with the findings of this study in the comparison of gap index in information access, ability, and practical utilization of the disabled, with the scores such as gap index in ability (57.1 scores), quantitative use (49.7 scores), and qualitative use (53.6%) being over 2.5 times higher than the gap index in access (19.8), indicating greater gap index in information use relevant to information use ability and use pattern (the quality of use) than the gap index in information access relevant to computer and Internet access and possession.
Meanwhile, there was little difference between the non-disabled group and the visually impaired group in information and communication devices holding and accessibility, use ability, and practical utilization level, compared with other the other groups, indicating this ability group has the smallest digital divide in the comparison with the non-disabled group.
These results supported the hypothesis that there would be differences in information and communication devices possession and accessibility, usage ability, and practical utilization level between the disabled and the
non-disabled. Therefore, the three variables of information and communication devices possession and accessibility, use ability, and practical utilization level turned out to be important variables which should be taken into account for digital divide reduction. Particularly, effective plans to reduce the gaps in use ability and practical utilization level need to be prepared. For example, discriminated information and communication education programs need to be developed and supported for the disabled. They also need to be reminded of the usefulness and importance of the use of information and communication devices. As seen in KADO’s survey of the intention of the disabled in getting assistive devices (KADO, 2007), 13.7% of the total respondents to the survey could not apply the devices because they did not know about the devices or their defects. Publicity and support for policies for the disabled to use information and communication devices actively and effectively would be a measure to solve information inequality between the classes in the information-based society.
4.2. The results of demand survey for information and communication assistive devices
Information and communication assistive devices are devices (H/W and S/W included) necessary for the disabled who have difficulties in handling computers due to their disability (KADO, 2007). The data contents of the questionnaires and in-depth interviews of 36 people with disabilities in visual, hearing/language, retardation/
brain lesion disorders, and mental retardation/development disabilities were analyzed.
4.2.1. The current state of information and communication assistive devices possession & use for the disabled
The survey of this study found out that about 28% of the total respondents currently used information and communication assistive devices and software, and 36%
of them had devices that were supported by the government or related agencies. The supported devices were Screen
Reader, Hansone Voice, Sense View, Sense View Portable, Sense Reader Power Edition, Daisy Contents Player, Zoom Text, TV Subtitle Maker, and See Talk (communication by sign language (video)). About 46%
of the total respondents responded they were generally satisfied with them. Many of them answered that the devices were very helpful with their everyday life (67%), and 86% of them showed higher than normal level of satisfaction with the performances of the devices.
In particular, they were satisfied with Hansone Voice (Braille Terminal) and Sense Reader Power Edition (Screen Reader) because of their wide output and application and high usability. They said positively that these devices were effective because of the convenient use of computers with software and because various contents were available. They were also satisfied with Sense View Portable for its high usability and See Talk for its clear sign language.
As for their dissatisfaction, the function of screen reading was not smooth in Sense Reader Power Edition (Screen Reader). Performance and usability also were not at a satisfactory level for Daisy Contents Player, because it often did not work smoothly and had frequent standstills and faulty recognition. Also, because of its large size, it was difficult to carry around. Only 36% of the total respondents appraised them as easy and convenient in function and instructions. The operation of the devices seemed to be the most inconvenient factor.
For example, Daisy Contents Player had too many buttons. Also, the Sense Reader Power Edition’s shortcut keys and voice, which are used in place of a key board, had too many shortcut keys, and its Sense Reader could not read many things on the Internet Web sites (link, image, etc.). As for the TV Subtitle Maker, respondents said it was too difficult to use.
4.2.2. Requirements & matters to be improved for information and communication assistive devices, and demand for new products
The general requirements for information and com- munication assistive devices were the miniaturization of
their sizes, simplification of their buttons, and a reduction of their weights. In particular, respondents wanted Daisy Contents Player without any malfunction and miniaturized as small as an MP3 player with easier handling. The improvements demanded for TV Subtitles Maker included the correction of letter swaying.
Furthermore, in regards to the performance and instructions of those devices, the respondents required a change of the mechanical voice of the devices to a more natural human voice and a correction of inaccurate pronunciation and reading spacing intervals. In addition, the respondents wanted speed adjustable devices and better repair services.
The features of the information and communication devices respondents wanted supported and developed in the future were touch screens, special mouse, special keyboards, portable voice calculators, voice e-notebooks, functions for reading cell menus, and voice services to read the number or direction of subways and buses.
They also wanted the development and support of computers and mobile phones with good function of TTS (Text To Speech). The hearing impaired group wanted features and products such as TV subtitle receivers, videophone tripods, Web (video) cameras, pulsating baby care systems, turn lights, navigations, etc.
The 2007 KADO survey of the disabled to find out what they demanded among the assistive devices by function revealed that the people with visual impairment wanted braille terminals, people with hearing/language impairment wanted hearing aid and TV subtitle receiving devices, people with retardation/brain lesion disorders wanted special keyboards and touch monitors/touch screens, and people with mental/development disabilities wanted touch monitors/screens, similar to the results of the demand survey in this study (Lee, 2006). However, the disabled group of the same disability pattern and grade do not always need the same devices, especially in consideration of other factors, such as another disability, different cognitive level, current employment, and the level of demand for information access. These factors should be considered to choose devices that will precisely fit them. Assistive devices need to be more concretely analyzed according to the disability level and pattern of the disabled. Support should be extended in
the future.
4.2.3. Publicity & information supply, post education for the support of information and communication assistive devices
The survey of the support and publicity for the devices revealed that only a few of the disabled have been supported thus far, and a few answered that they got the information of those devices support projects through websites, associations, and community relief centers for the disabled. Generally, the information of the products already available and the products currently supplied are insufficient. Many respondents said that the request procedure is complicated and inconvenient, and therefore, to request through the phone or Internet needs to be made easier for the disabled who are not able to move well. Tough a few thought that the rate of their share in the expenses of devices were appropriate, a majority of the disabled respondents wanted the government to support the whole cost of the devices.
The respondents first wanted to adjust the 5-year restriction on the disabled who got device support once that they can have another support for 5 years in the manner of extending support items and subjects to the support. Accordingly, active notification through associations or groups for the disabled, community relief centers, and schools seem to be necessary when the policies for information and communication devices are added or changed. Moreover, detailed information like the use methods and the functions of the items supported needs to be disclosed in order to give more opportunities to the disabled who are in need of the devices.
Meanwhile, there were many negative responses to the post support, which are given after the support of the devices because of the lack of education in using the devices. Therefore, they wanted home-visit education and the chance to learn how to use the devices more effectively rather than simply being supplied with the devices. Regular education for the users at associations, community relief centers, or schools, where many disabled people gather, or a supply of simple instructions would be effective measures. Conducting cyber lectures
would be greatly helpful for the disabled who have difficulty moving. Also, providing braille books and talking books with educational purposes seem to be necessary for the people who are visually impaired.
5. CONCLUSION & IMPLICATIONS
5.1. Summary & conclusionThis study investigated and analyzed the information possession level and the gap of the disabled, a class alienated from digital age, and proposed a policy for digital divide reduction of the disabled, through a survey of demand for information and communication assistive devices for the preparation of the development and utilization of those devices.
Possession and accessibility, usage ability, and practical utilization of the information and communication assistive devices between the disabled and the non-disabled were analyzed with the T-test. The test result showed a significant difference in devices possession and accessibility (T=-2.510*) between the disabled and the non-disabled. The disabled had lower devices possession and accessibility. Also, there was a significant difference (T=-6.658***) for the use ability of those devices, and the disabled had a much lower usage ability of those devices. There were differences also in the practical utilization of the devices between the disabled and the non-disabled (T=-5.843***), and the disabled were very inferior to the non-disabled in the use ability of those devices.
This study found that about 28% of the total respondents currently used the devices, and a majority of the respondents answered that the devices were very helpful in their everyday lives (67%). 36% of the respondents have been provided with those devices from the government or related agencies and 46% of them answered that they were satisfied with its performance in general. Meanwhile, only 36% of the respondents who experienced them said that the device instructions provided were easy and convenient, and that the operation of the devices was the most difficult part. The overall demands for these devices were the stabilization