• 검색 결과가 없습니다.

A Comparative Study of Recognition Rate of Color QR Code Printed on Tyvek and Cotton Material

N/A
N/A
Protected

Academic year: 2021

Share "A Comparative Study of Recognition Rate of Color QR Code Printed on Tyvek and Cotton Material"

Copied!
15
0
0

로드 중.... (전체 텍스트 보기)

전체 글

(1)

ISSN 1229-3350(Print) ISSN 2288-1867(Online)

J. fash. bus. Vol. 21, No. 3:14-28, July. 2017 https://doi.org/

10.12940/jfb.2017.21.3.14

Color QR Code Printed on Tyvek and Cotton Material

Suhrin Park

Dept. of Fashion Industry, Ewha Womans University, Korea

Corresponding author

— Suhrin Park

Tel : +82-2-3277-3074 Fax.: +82-2-3277-3079 E-mail : [email protected]

Keywords Abstract

Tyvek, QR code, color QR code, digital textile printing

This research is part of a doctoral dissertation.

This purpose of this study to analyze effect material properties have on

change in QR code recognition rate according to change of materials by

comparing recognition rate of color QR code. QR code applied to textile

materials has the advantage of being washable and being applicable to lost

child prevention goods or clothes or a person with dementia through record

of information relating to the material or input of additional information,

differently from QR code printed on the conventional paper. An effective

method of entering QR code in textile materials is Digital Textile

Printing(DTP), that facilitates printing by rapidly applying diverse information,

and small quantity production. It is possible to tailor various QR codes

according to use. Regarding samples to use, cotton material used in clothing

products and Tyvek material recently applied to clothing and related products

were selected. Reactive dyes were used for cotton, pigment was used for

Tyvek, and QR code was printed with an inkjet printer by direct printing

method. Printing methods and surface textures are different between cotton

and Tyvek. It was revealed that consequent print results and results of

recognition rate were different. Regarding color to be printed, 2015 S/S -

2017 S/S color presented by Pantone was used. Color combination affected

recognition rate of color QR code. Understanding color combination, material

properties and print characteristics may be helpful in increasing recognition

rate of color QR code, and may contribute to usability of color QR code

applied to textile materials in the future.

(2)

I. Introduction

A QR code is a two-way cross stripe-shaped code developed in 1994. It can contain various kinds of information such as photographs, videos, URLs and texts. In a digital environment, a QR code is simple to create and use while delivering information fast to be widely used across marketing, advertisement, distribution, design and even cultural industries(Lee, 2016). Colored QR code belongs to the category of design QR code which added the visual elements of an image or color to the standard black-and-white QR code to improve the usability. QR code was developed by a company in Japan, Denso Wave. Denso Wave released research finding that designed QR code with visual elements, rather than the standard QR code, was highly noticeable, accessible and favorable for people as they could hint their contents to in advance through QR code readers or applications even before people start reading their information(S.Park, 2011).

However, designed QR codes become far less recognizable than standard QR codes when they are produced without a proper understanding of their characteristics. Therefore, in the production stage, their structure should be well understood and more experiments and awareness test should precede. Also, to improve the availability of colored QR code, it is essential to choose the best colors for people’s easy awareness and test them. Moreover, the characteristics of the QR code production environment should be considered in addition to the awareness, change depending upon QR code design and the media to apply the QR code.

In this context, the study focuses on analyzing color printing results according when applying the colored QR code to products in the textile and fashion sector as a medium to deliver information, depending upon the variables of printer, ink, and applied materials and compare the awareness levels to explore how to improve colored QR code usability. For the study, the selected samples were cotton, a popular textile material, and Tyvek that is viewed to possibly become a new textile

material these days. They were compared in this study.

Cotton is one of the oldest natural fibers in human history. It consists mostly of cellulose and delivers the good hygroscopic property and dyeing property to be used in human daily lives and mass produced until now since the ancient days. Tyvek is a high-density polyethylene material developed by Dupont of the US. It is produced only with pressure without any chemical additives. Its combustion process leaves only carbohydrate and water to pose not any harm to the human body while delivering high recyclability to gather more attention as an environmentally friendly material(Kang, 2015).

Tyvek was produced by combining the nature of textile fibers with the strengths of paper or film. It is mainly used in constructional lagging or insulation or work clothes for special environment such as dust-free suits. But recently, Tyvek is also used in fashion accessories such as shoes, wallets and bags, including Nike’s ultralight sneakers, Adidas’ Tyvek shoes, as well as home interior decoration goods(Ahn, 2015).

In this study, to analyze the color difference appropriate for colored QR code, identified highly recognizable colors from the 55 colors in Pantone’s S/S 2015 through S/S 2017 and defined the color difference range. And the selected colors were identically printed on two textile samples to examine the difference in colors and recognition rate.

II. Experimentals 1. QR code, Samples and Color selection 1) QR code

QR code consists of version info, format info, data, error correction keys, position detection pattern, alignment pattern, timing pattern and quiet zone(Lee, Shin, Hong, 2012; S. Shin, S & E. Lee, 2014).

As in Table 1 and 2, the QR code structure was

changed in reflection of the preceding study by Park and

Kim(2016b) at http://mqr.kr/ where its configuration can

(3)

Table 1. Structure of QR Code

Structure of QR Code QR Code Image

1. Version information 2. Format information 3. Data and error correction keys

4.Required pattern

Position Alignment Timing

5. Quiet Zone

*Source : http://datagenetics.com/blog/november12013/index.html

Table 2. QR Code Sample

No. QR Image Setting Option

QR Sample

Error correction level of M(15%), Quiet Zone 4, Relation Rectangle-Group Neighbor Modules, Maximum Symbol Size100,

Maximum Module Size 10, Link URL:rintam.dothome.co.kr/

be changed and produced a QR code with the error correction level showing a good QR code recognition rate M(error correction rate 15%), quiet zone 4, relation rectangle-group neighbor modules, maximum symbol size of 100(in pixels), and maximum module size of 10(in pixels).

Print file was produced at 254dpi resolution with Adobe Photoshop CS6 version program. The recognition rate of the colored QR code was tested depending upon its textile materials and colors through the link to the relevant QR code data input site (http://rintam.

dothome.co.kr).

2) samples

For this study, as in Table 3, two types of cotton samples and 1 type of Tyvek sample exclusively for inkjet printer were chosen. The cotton samples were 100% cotton 10’s and 20’s plain weave fabric of Seojin Dyeing & Textile, which is appropriate for DTP. The

cotton samples were pre-conditioned and post-conditions of steaming and washing after print. The Tyvek sample was the material for printing purpose with smooth surface pre-conditioning for printing with the medium exclusively for Tyvek inkjet media of Samwon Paper.

3) color

As in Table 4, 55 colors were used among Pantone’s presented fashion trend colors from S/S 2015 to S/S 2017. A total of five colors is available for the QR code - one color for the background, one for module, and 3 others for position detection pattern in different ways(S.

Park, 2011).

This study used only 2 kinds of combinations-

background and module – to use 2970 color

combinations. In reflection of Park and Kim(2016b)’s

study findings, to improve the recognition rate, this study

chose 472 color combinations of bright background and

dark module among all combinations of background and

(4)

module; while selecting the QR codes with a color difference values converted to grayscale for each color being not less than 65.

2. Experimental Method 1) printing samples

Table 3. Fabric Sample Chart

Sample Cotton 10’s Cotton 20’s Tyvek

Image1

Thread Count,

threads/inch 81×42 74×56 N/A

Weight,

g/㎡ 277.7 150.0 113.2

Thickness

mm 0.543 0.257 0.268

Table 4. Pantone Color Chart

S N Name Color N Name Color

15 S/S

1 Aquamarine

15 S/S

14 Sandstone

2 Strawberry Ice 15 Titanium

3 Scuba Blue 16 Lavender Herb

4 Beveled Glass

15 F/W

17 Reflecting Pond

5 Toasted Almond 18 Stormy Weather

6 Classic Blue 19 Dried Herb

7 Tangerine

20 Biscay Bay

8 Custard

21 Amethyst Orchid

9 Marsala

22 Oak Buff 10 Glacier Gray

23 Cadmium Orange 11 Dusk Blue

24 Cashmere Rose

12 Woodbine

25 Desert Sage

13 Treetop

All of the two types of samples were printed with an

inkjet printer using the Piezo head. DTP technique can

be performed either in a direct printing method or

sublimation transfer printing method according to fabric

types. For the cotton samples, Ichinose Digital Inkjet

Printer 2040 printer was used for direct printing with

reactive dyes, whereas sublimation transfer printing-based

(5)

Table 4. Continued

S N Name Color N Name Color

16 S/S

26 Rose Quartz

16 F/W

36 Riverside

27 Peach Echo 37 Airy Blue

28 Serenity 38 Bodacious

29 Snorkel Blue 39 Lush Meadow

30 Buttercup 40 Spicy Mustard

31 Limpet Shell 41 Sharkskin

32 Lilac Gray 42 Aurora Red

33 Fiesta 43 Warm Taupe

34 Iced Coffee 44 Dusty Cedar

35 Green Flash 45 Potter's Clay

17 S/S

46 Niagara

17 S/S

51 Pale Dogwood

47 Primrose Yellow 52 Greenery

48 Lapis Blue 53 Pink Yarrow

49 Flame 54 Kale

50 Island Paradise 55 Hazelnut

Epson Sure Color F7000 printer was used to print the polyester samples. After printing on transfer paper, they were transferred at 180°C for 50 seconds(Park & Kim, 2016a; Cho, 2010).

The cotton samples were treated under S/W on DTP for pre-/post-conditioning whereas no pre/post -conditioning was done for the polyester samples. To measure the samples surficial texture, Jenoptik’s ProgRes C10 Plus digital camera was used. 3D scanner system and David 3D Scanner were used to measure 3D surficial texture.

2) color measurement

Pantone Capsure RM 200-PT01 spectrophotometer was used to measure the colors of experiment samples. For the baseline colors, their RGB values were found at the Pantone’s site and CIE L*a*b* value conversion was done on Easy RGB site. The cotton and Tyvek sample measurement was done based on CIE L*a*b*. QR code measurement algorithm change colors into grayscale and recognizes brightness as 0 and darkness as 1 for measurement.

As shown in Table 5, the color measurement for the QR code recognition rate is done by calculating the RGB values through the grayscale formula to convert them into the grayscale, then the background-module combinations were compared for their color differences and QR code recognition rates.

3) measurement and evaluation of recognition rate of QR code

The application for QR code recognition rate

measurement was chosen among those exclusively for

Android. Four different applications were first selected

through the preceding study, which had different levels

of average recognition rates. The selected applications

were A) Logo QR Barcode Scanner, B) Denso Wave QR

Scan, C) QR Barcode Scanner, and D) QR Code

Scanner. For the measurement, the colored QR code size

was matched with the size of recognition screen and

measurement was performed by distancing 10cm for the

set average measurement time of 15 seconds. The

measurement environment was set in reflection of the QR

(6)

code technology standard. 5-wavelength fluorescent lights were used and 1600-pixel Samsung Galaxy Note 5 mobile phone

Table 5. Color Value Chart

N Color Name Pantone Color Name R G B HEX/HTML Grayscale

1 Buttercup PANTONE 12-0752 TCX 250 224 60 FAE03C 217.69

2 Custard PANTONE 13-0720 TCX 229 214 142 E5D68E 211.99

3 Rose Quartz PANTONE 13-1520 TCX 247 202 201 F7CAC9 211.49

4 Pale Dogwood PANTONE 13-1404 TCX 237 205 194 EDCDC2 211.01

5 Primrose Yellow PANTONE 13-0755 TCX 246 209 85 F6D155 207.91

6 Island Paradise PANTONE 14-4620 TCX 149 222 227 95DEE3 206.84

7 Limpet Shell PANTONE 13-4810 TCX 152 221 222 98DDDE 206.40

8 Glacier Gray PANTONE 14-4102 TCX 197 198 199 C5C6C7 197.86

9 Aquamarine PANTONE 14-4313 TCX 157 195 212 9DC3D4 188.15

10 Beveled Glass PANTONE 14-5714 TCX 122 204 184 7ACCB8 185.12 11 Toasted Almond PANTONE 14-1213 TCX 210 180 156 D2B49C 184.65

12 Hazelnut PANTONE 14-1315 TCX 207 176 149 CFB095 180.64

13 Airy Blue PANTONE 14-4122 TCX 146 182 213 92B6D5 176.58

14 Spicy Mustard PANTONE 14-0952 TCX 216 174 71 D8AE47 175.49

15 Green Flash PANTONE 15-0146 TCX 121 199 83 79C753 174.04

16 Desert Sage PANTONE 16-0110 TCX 167 174 158 A7AE9E 171.36

17 Cadmium Orange PANTONE 15-1340 TCX 249 148 113 F99471 166.95

18 Serenity PANTONE 15-3919 TCX 145 168 208 91A8D0 166.00

19 Oak Buff PANTONE 16-1144 TCX 207 156 99 CF9C63 162.73

20 Tangerine PANTONE 15-1247 TCX 248 143 88 F88F58 161.35

21 Greenery PANTONE 15-0343 TCX 136 176 75 88B04B 160.20

22 Strawberry Ice PANTONE 16-1720 TCX 231 139 144 E78B90 158.92

23 Dusk Blue PANTONE 16-4120 TCX 123 160 192 7BA0C0 154.44

24 Warm Taupe PANTONE 16-1318 TCX 175 148 131 AF9483 152.51

25 Cashmere Rose PANTONE 16-2215 TCX 206 135 159 CE879F 151.83 26 Lavender Herb PANTONE 16-3310 TCX 177 142 170 B18EAA 151.46

27 Lilac Gray PANTONE 16-3905 TCX 152 150 164 9896A4 151.44

28 Iced Coffee PANTONE 15-1040 TCX 177 143 143 B18F6A 150.23

29 Sandstone PANTONE 16-1328 TCX 196 138 105 C48A69 147.95

30 Peach Echo PANTONE 16-1548 TCX 247 120 107 F7786B 146.06

31 Scuba Blue PANTONE 16-4725 TCX 0 171 192 00ABC0 136.16

32 Sharkskin PANTONE 17-3914 TCX 131 132 135 838487 132.00

33 Bodacious PANTONE 17-3240 TCX 183 107 163 B76BA3 127.20

34 Niagara PANTONE 17-4123 TCX 84 135 164 5487A4 126.25

35 Titanium PANTONE 17-4014 TCX 128 125 127 807D7F 125.78

36 Dried Herb PANTONE 17-0627 TCX 132 122 89 847A59 121.74

37 Woodbine PANTONE 18-0538 TCX 123 127 50 7B7F32 120.59

38 Amethyst Orchid PANTONE 17-3628 TCX 146 106 166 926AA6 118.84

was used(Korean Agency for Technology and Standards, 2007).

(7)

Table 5. Continued

N Color Name Pantone Color Name R G B HEX/HTML Grayscale

39 Flame PANTONE 17-1462 TCX 242 85 44 F2552C 115.42

40 Dusty Cedar PANTONE 18-1630 TCX 173 93 93 AD5D5D 110.01

41 Kale PANTONE 18-0107 TCX 90 114 71 5A7247 105.79

42 Riverside PANTONE 17-4028 TCX 76 106 146 4C6A92 102.51

43 Biscay Bay PANTONE 18-4726 TCX 9 121 136 097988 98.27

44 Stormy Weather PANTONE 18-4214 TCX 88 100 109 58646D 98.10

45 Fiesta PANTONE 17-1564 TCX 221 65 50 DD4132 97.08

46 Treetop PANTONE 18-0135 TCX 71 106 48 476A30 94.37

47 Marsala PANTONE 18-1438 TCX 150 79 76 964F4C 93.88

48 Pink Yarrow PANTONE 17-2034 TCX 206 49 117 CE3175 87.29 49 Potter's Clay PANTONE 18-1340 TCX 158 70 36 9E4624 86.25

50 Lush Meadow PANTONE 18-5845 TCX 0 110 81 006E51 84.52

51 Aurora Red PANTONE 18-1550 TCX 185 58 50 B93A32 84.42

52 Classic Blue PANTONE 19-4052 TCX 15 76 129 0F4C81 66.86

53 Snorkel Blue PANTONE 19-4049 TCX 3 79 132 034F84 66.67

54 Lapis Blue PANTONE 19-4045 TCX 0 75 141 004B8D 63.82

55 Reflecting Pond PANTONE 19-4326 TCX 32 62 74 203E4A 56.49

III. Results and Discussion

1. Measurement of Samples Color and Difference

Table 6 shows that the average color difference between the 2 cotton samples and 1 Tyvek sample was the largest in cotton 10’s (10.69)> Tyvek (9.36) >cotton 20’s (3.35). The cotton 10’s sample had the largest gap of 25.87 when using Ice Coffee color, whereas Pale Dogwood color and the other 7 colors showed the least difference of 0. The cotton 20’s sample was found to have the largest gap of 10.98 when using Strawberry Ice color while Buttercup color and 24 other colors showed 0 differences. In the Tyvek samples, Peach Echo color showed the largest color difference with 21.55 while Airy Blue color and 2 other colors showed 0 differences.

The differences in CIE L*a*b* values of samples in Table 7 were analyzed based on the L*a*b* values. As for the cotton 10’s samples, their L* values show a brightness increase by 1.55 from 60.46 to 62.01 on average a* showed red increase by 1.3 from 6.94 to

8.24 and b* showed yellow increase by 3.28 from 9.62 to 12.90.

In terms of the cotton 20’s samples, L* values were found to have brightness increase by 0.33 from 60.46 to 60.79 on average a*, red increase by 0.56 from 6.94 to 7.50 b*, blue increase by 0.88 from 9.62 to 8.74 on average.

As for the Tyvek samples, their L* values showed a brightness increase by 2.37 from 60.46 to 62.83 a*, green increase by 1.72 from 6.94 to 5.22 b*, blue increase by 5.04 from 9.62 to 4.58, on average. All of the three kinds of samples showed brightness increase and the cotton samples showed red increase and Tyvek sample showed green increase. The b* values were found to have no certain pattern in both cotton and Tyvek while the cotton 20’s showed yellow increase but cotton 10’s and Tyvek, blue increase.

As shown in Table 8, the average of Pantone original

color's grayscale was 141.99. The average of cotton 10’s

sample's grayscale was 142.50 and cotton 20’s was

142.52. The cotton 10’s was higher by 0.51 and cotton

(8)

20’s was by 0.53. The average of Tyvek sample's grayscale was 149.15, higher by 7.16. Among the three kinds of samples, the average of Tyvek sample's grayscale was found to have the highest average. Consequentially, the color difference and the grayscale difference were not consistent as the grayscale difference was Tyvek > cotton

Table 6. Color Difference of Samples

No. Color Name Cotton 10's E Δ Cotton 20's E Δ Tyvek's E Δ

1 Buttercup 10.40 0.00 10.57

2 Custard 15.24 0.00 13.27

3 Rose Quartz 7.26 7.97 8.57

4 Pale Dogwood 0.00 3.56 9.51

5 Primrose Yellow 14.66 0.00 11.83

6 Island Paradise 12.75 8.92 3.79

7 Limpet Shell 13.78 5.68 5.92

8 Glacier Gray 0.00 0.90 8.45

9 Aquamarine 6.39 2.09 2.89

10 Beveled Glass 17.88 6.40 11.82

11 Toasted Almond 8.39 2.27 10.44

12 Hazelnut 10.52 0.00 7.83

13 Airy Blue 6.97 6.97 0.00

14 Spicy Mustard 17.15 4.79 11.12

15 Green Flash 0.00 0.00 0.00

16 Desert Sage 0.00 0.00 8.35

17 Cadmium Orange 15.38 0.00 16.73

18 Serenity 3.63 3.63 3.63

19 Oak Buff 8.56 6.93 12.46

20 Tangerine 16.16 0.00 17.00

21 Greenery 19.00 0.00 3.45

22 Strawberry Ice 20.83 10.98 8.78

23 Dusk Blue 7.69 8.16 10.43

24 Warm Taupe 5.58 0.00 8.46

25 Cashmere Rose 15.36 2.91 6.13

26 Lavender Herb 5.27 0.00 9.55

27 Lilac Gray 0.00 2.72 7.43

28 Iced Coffee 25.87 0.00 15.99

29 Sandstone 11.37 0.00 11.24

30 Peach Echo 13.21 7.18 21.55

31 Scuba Blue 5.66 0.00 7.48

32 Sharkskin 2.95 2.95 5.77

33 Bodacious 9.35 0.00 0.00

34 Niagara 25.72 0.00 22.44

35 Titanium 2.37 2.37 5.25

36 Dried Herb 18.28 0.00 4.27

37 Woodbine 10.74 10.74 10.46

20’s > cotton 10's whereas the color difference was

cotton 10’s > Tyvek > Cotton 20’s. These results suggest

that the difference in grayscale is influenced by the

thickness of the yarn in the samples, as shown in the

study of Park and Kim(2016b).

(9)

Table 6. Continued

No. Color Name Cotton 10's E Δ Cotton 20's E Δ Tyvek's E Δ

38 Amethyst Orchid 2.10 0.00 7.53

39 Flame 0.00 10.65 23.20

40 Dusty Cedar 15.40 0.00 12.59

41 Kale 5.82 0.00 2.59

42 Riverside 7.10 0.00 7.70

43 Biscay Bay 13.09 0.00 2.38

44 Stormy Weather 0.00 0.00 5.17

45 Fiesta 1.37 8.29 15.13

46 Treetop 13.96 5.28 5.28

47 Marsala 17.27 0.00 10.38

48 Pink Yarrow 11.59 0.00 8.54

49 Potter's Clay 15.88 10.05 14.31

50 Lush Meadow 18.61 9.18 9.18

51 Aurora Red 15.47 2.17 13.10

52 Classic Blue 20.11 9.69 13.49

53 Snorkel Blue 18.49 7.19 12.14

54 Lapis Blue 16.86 7.53 10.66

55 Reflecting Pond 10.53 6.27 8.44

Average 10.69 3.35 9.36

Table 7. CIE L*a*b* of Samples

Sample L* a* b*

Cotton 10's 1.55 1.3 3.28

Cotton 20's 0.33 0.56 -0. 88

Tyvek 2.37 -1.72 -5.04

Table 8. Grayscale of Samples

No. Color Name Grayscale

Original Cotton 10’s Cotton 20’s Tyvek

1 Buttercup 217.69 201.27 217.69 210.58

2 Custard 211.99 216.60 211.99 213.38

3 Rose Quartz 211.49 206.49 203.95 215.38

4 Pale Dogwood 211.01 211.01 211.52 204.17

5 Primrose Yellow 207.91 206.30 207.91 208.35

6 Island Paradise 206.84 177.77 183.55 204.92

7 Limpet Shell 206.40 177.77 190.70 204.92

8 Glacier Gray 197.86 197.86 197.51 194.22

9 Aquamarine 188.15 182.76 193.08 191.64

10 Beveled Glass 185.12 143.08 177.09 180.48

(10)

Table 8. Continued

No. Color Name Grayscale

Original Cotton 10’s Cotton 20’s Tyvek

11 Toasted Almond 184.65 187.90 180.64 174.96

12 Hazelnut 180.64 184.53 180.64 182.80

13 Airy Blue 176.58 170.77 170.77 176.58

14 Spicy Mustard 175.49 173.00 179.77 185.95

15 Green Flash 174.04 174.04 174.04 174.04

16 Desert Sage 171.36 171.36 171.36 174.08

17 Cadmium Orange 166.95 142.12 166.95 167.86

18 Serenity 166.00 168.73 168.73 168.73

19 Oak Buff 162.73 161.91 166.28 171.26

20 Tangerine 161.35 144.23 161.35 164.76

21 Greenery 160.20 174.81 160.20 161.70

22 Strawberry Ice 158.92 137.63 153.17 174.09

23 Dusk Blue 154.44 159.20 152.88 154.54

24 Warm Taupe 152.51 157.99 152.51 153.04

25 Cashmere Rose 151.83 154.34 149.18 159.63

26 Lavender Herb 151.46 150.23 151.46 157.90

27 Lilac Gray 151.44 151.44 155.50 163.02

28 Iced Coffee 150.23 151.66 150.23 156.44

29 Sandstone 147.95 142.62 147.95 159.19

30 Peach Echo 146.06 122.74 133.93 158.92

31 Scuba Blue 136.16 124.85 136.16 151.87

32 Sharkskin 132.00 125.78 125.78 134.17

33 Bodacious 127.20 132.16 127.20 127.20

34 Niagara 126.25 115.66 126.25 140.63

35 Titanium 125.78 126.71 126.71 126.01

36 Dried Herb 121.74 148.40 121.74 121.61

37 Woodbine 120.59 146.96 146.96 131.04

38 Amethyst Orchid 118.84 118.26 118.84 130.64

39 Flame 115.42 115.42 91.36 129.84

40 Dusty Cedar 110.01 98.24 110.01 135.11

41 Kale 105.79 102.87 105.79 108.16

42 Riverside 102.51 91.82 102.51 117.32

43 Biscay Bay 98.27 116.90 98.27 106.61

44 Stormy Weather 98.10 98.10 98.10 106.47

45 Fiesta 97.08 96.08 88.22 105.68

46 Treetop 94.37 129.58 102.87 102.87

47 Marsala 93.88 93.17 93.88 114.76

48 Pink Yarrow 87.29 66.19 87.29 98.67

49 Potter's Clay 86.25 93.84 100.08 102.00

50 Lush Meadow 84.52 119.30 105.66 105.66

51 Aurora Red 84.42 97.08 78.28 98.24

52 Classic Blue 66.86 102.13 91.82 91.50

53 Snorkel Blue 66.67 102.13 82.25 91.50

54 Lapis Blue 63.82 94.60 84.66 82.25

55 Reflecting Pond 56.49 79.14 65.37 75.98

Grayscale Average 141.99 142.50 142.52 149.15

(11)

2. Measurement and Evaluation of Sample Textures

A 3D scanner was utilized to scan the fabric surface and examine the smoothness and the effect on recognition was analyzed. In Figures 1 and 2, the cotton 10's sample showed larger changes in textile surficial heights, compared with those of cotton 10's sample or Tyvek sample. The largest changes were found in cotton 10's >

cotton 20's > Tyvek in order.

Figure 1. 3D Scanning Result of Cotton Samples

Figure 2. 3D Scanning Result of Tyvek Sample

Table 9 exhibits the textile samples surficial smoothness based on 3D scanning. Identically to the change widths in the graphs of Figures 1 and 2, the surficial smoothness shown through a 3D viewer after OBJ file conversion shows the largest gap in cotton 10's sample and Tyvek sample shows the smallest gap to present flat surficial texture and smoothness.

As in Table 9, textile surficial texture and smoothness

have a large effect on print results.

(12)

Table 9. 3D Detail Texture of Samples

Sample Cotton 10’s Cotton 20’s Tyvek

Images

Table 10. Detail of Printed QR Code Samples

Sample Cotton 10’s Cotton 20’s Tyvek

Image 1

Image 2

It is deemed that, as exhibited in Table 10, the larger the textile thickness changes and the rougher the textile surface, the less even and the more irregular the ink application would be to undermine the printing quality.

Microscopic observation found that the cotton samples had an ink cascade in irregular dot forms on the rough surface of staple yarn in the direct printing method due to the distance between the textile and print head. The two cotton samples’ surfaces were compared and the cotton 20's sample was found to have more even ink

distribution in general than the cotton 10's sample. The high hydrophilicity of cotton spread the ink to blur the QR code boundaries. As for the Tyvek sample, since pigments were used not to be absorbed into like dyes so the print result was clearer and more even.

The printed sample details were analyzed with Image J

as in Table 11. The colored QR module printed on

Tyvek sample has larger values in color contrast and

boundary clarity while expressing more precise shapes

and sharper lines in terms of the schematized histogram

(13)

Table 11. Detail of Printed QR Code Samples

Sample Image Histogram 3d Graph

Cotton 10's

Tyvek

and 3D graphs.

3. Measurement and Evaluation of Recognition Rate of Samples QR Code

The pigment-specific recognition rates were compared in Table 12, in 4 types of QR code applications. Of a total of 472 color combinations, the number of recognized QR codes was the largest in Tyvek smaple (433 on average) > cotton 20's sample (405) > cotton 10's sample (305), showing the order of Tyvek sample (average recognition rate of 92%) > cotton 20's sample (66%) >

cotton 10's sample (65%).

In terms of application comparison, B) Denso Wave QR Scan (average recognition rate of 94.63%) > A) Logo QR Barcode Scanner (94.35%) > D) QR Code Scanner (70.69%) > C) QR Barcode Scanner (63.13%), in order. Cotton sampels showed B(92.26%) > A (91.74%) > D (59.75%) > C (56.99%), consistently with the average, whereas Tyvek sample, A (99.58%) > B (99.36%) > D (92.58%) > C (75.42%), slightly different, though minor, from the average.

IV. Conclusions

The purpose of this study is to help improve the availability of colored QR codes by comparing and examining how the variables of printer, ink and material affected colored QR code recognition rate when printing colored QR codes on textile products. The study findings are summarized as follows first, color and grayscale differences second, ink types and third, textile surficial texture were found as influencing factors.

First, the difference between the colors used for QR code was found the largest in cotton 20's sample >

Tyvek sample> cotton 10's sample, in order, whereas the grayscale difference was the largest in Tyvek sample >

cotton 20's sample > cotton 10's sample. Both samples

showed brightness increase and the cotton samples

exhibited red increase while Tyvek sample, green

increase. Blue and yellow showed no textile-specific

color change pattern as cotton and Tyvek did not show

consistent change. Color difference was not identical to

the grayscale difference. Grayscale difference, together

with the color, is deemed partly because of thread

(14)

Table 12. CIE L*a*b* of Samples

Application A B C D Average

Cotton 10's

Number of Recognized

QR Code 395 404 205 214 305

Percentage (%) 83.69 85.59 43.43 45.34 65

Cotton 20's

Number of Recognized

QR Code 471 467 333 350 405

Percentage (%) 99.79 98.94 70.55 74.15 86

Tyvek

Number of Recognized

QR Code 470 469 356 437 433

Percentage (%) 99.58 99.36 75.42 92.58 92

Average of Recognition (%) 94.35 94.63 63.13 70.69 80.70

thickness.

Second, both cotton and Tyvek samples were printed by inkjet printer using Piezo head in the direct printing method. But the cotton was printed with dyes and Tyvek was printed with pigments. In the comparison of dyes and pigments, the pigments were found to have a higher recognition as it was applied on the sample surface while the dyes were absorbed into it. But pigments showed the weakness of being worn out if used repeatedly.

Third, the textile surficial texture was 3D scanned to make into 3D images and graphs for comparison. The smoothness was found the largest in Tyvek sample >

cotton 20's sample > cotton 10's sample, demonstrating Tyvek sample was the smoothest with the smallest changes in the heights. Cotton 10's sample showed low smoothness and huge changes in height. Recognition gap was found the largest in Tyvek sample > cotton 20's sample >cotton 10's sample in order. It was noted that, together with the colors, surficial texture smoothness had a larger impact on recognition. The colored QR code printing status was magnified for observation. As a result, not only the ink types, but also surficial texture status caused clear differences in the ink application

evenness and boundary clarity. The Tyvek sample had even ink application and clear boundaries to have the highest recognition rate.

Therefore, in order to improve the recognition rate of colored QR code, diverse materials will need to be compared to research different recognition rates according to material-specific surficial texture status.

Surficial processing methods to increase colored QR code recognition will need to be changed and adjusted to explore how to help enhance QR code recognition in a broader sense. This present study used the color combinations of color QR code for its enhanced recognition based on the preceding study. However, given the nature of colored codes, further diversified color use, subsequent study can look at more various color combinations in industrial fabric products.

References

Ahn, S. (2015, June 5). Samwon paper, tyvek for fashion. Fashionbiz . Retrieved from http://

www.fashionbiz.co.kr

Cho, M. (2010). A study on optimal transfer conditions

for sublimation transfer digital textile printing. Journal

(15)

of The Korean Society of Fashion Design, 10 (4), 59-67.

Kang, H. (2015). Development of leisure products made of proenvironmental tyvek - Focused on the manufacturing of tents. Journal of the Korea Society of Art & Design, 18 (4), 397-412.

Korean Agency for Technology and Standards. (2007).

Information technology - Automatic identification and data capture technique - Bar code symbology - QR Code.(ISO/IEC 18004) . Retrieved from http://

www.standard.go.kr

Lee, M., Shin, D., & Hong, S. (2012). A study on making better use of the paper map with QR codes - Focused on the survey about intending to use and providing information -. Journal of Korea Spatial Information Society, 20 (6), 77-90.

Lee, Y.(2016). A study on the design QR code activation plan. The Treatise on The Plastic Media, 19 (3), 285-292.

Park, S. (2011). A study and direction on bar code revolution - Design QR codes in Korea and overseas-. Journal of Korea Digital Design Council, 11 (1), 505-514.

Park, S., & Kim, J. (2016a). Comparative Study on Colors Between Korean Traditional Color and Digital Transfer Textile Printing -Focusing on The Red-Series of Korean Traditional Standard colors-. Journal of Fashion Business, 20 (1), 98-114.

Park, S., & Kim, J. (2016b). Study on the recognition rate of printed QR codes by digital transfer textile printing -Focused on changes in the fineness and color of filament textile. Journal of Fashion Business, 20 (4), 50-71.

Shin, S., & Lee, E. (2014). Preceding factors in the effect of QR code characteristics on consumer's purchasing intention for mobile marketing in fashion business.

Journal of Fashion Business, 18 (2), 80-94.

Received (May 17, 2017)

Revised (June 28, 2017)

Accepted (July 15, 2017)

수치

Table  1.  Structure  of  QR  Code
Table  3.  Fabric  Sample  Chart
Table  4.  Continued
Table  5.  Color  Value  Chart
+7

참조

관련 문서

To learn about the necessity of textile art education and tapestry technique, to study the value of tapestry education and to utilize it in art education

In this study, the RESRAD-RECYCLE 3.10 computer code was used to evaluate individual and collective doses due to the recycling of radioactive metal waste

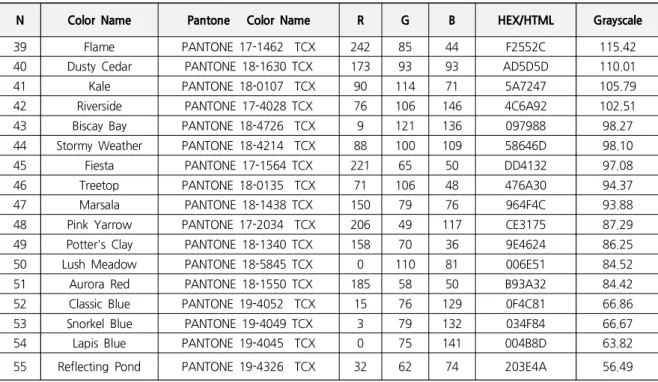
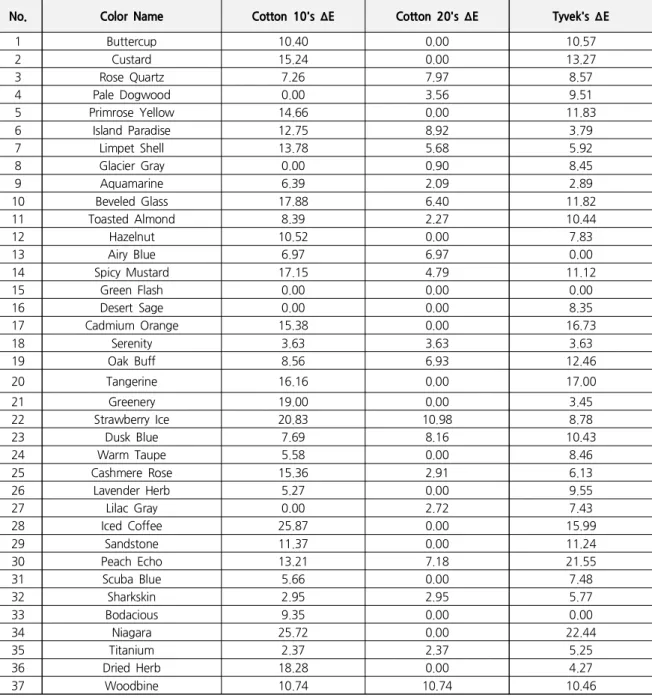
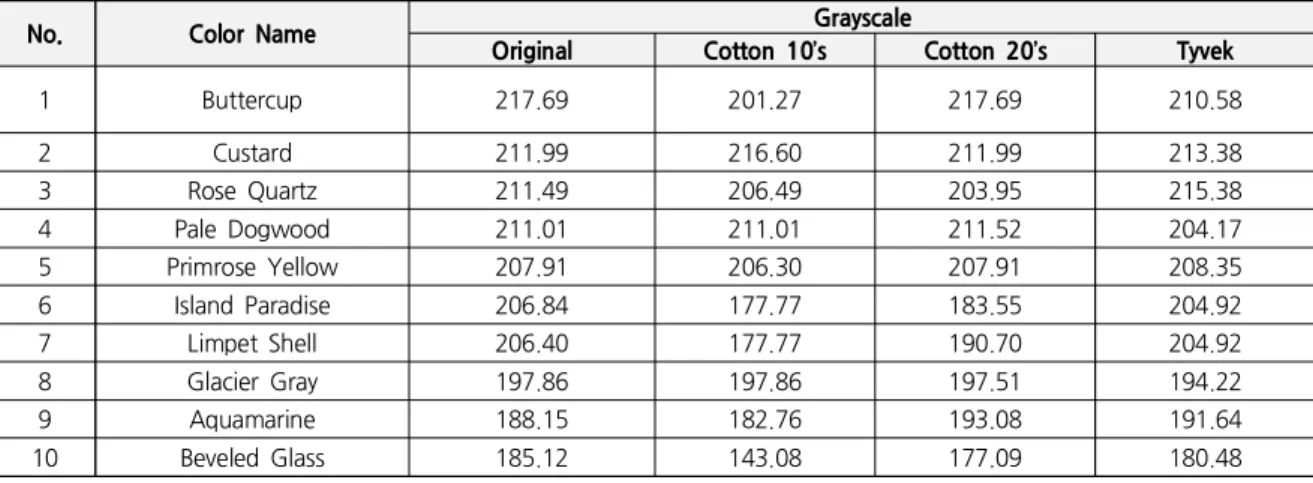
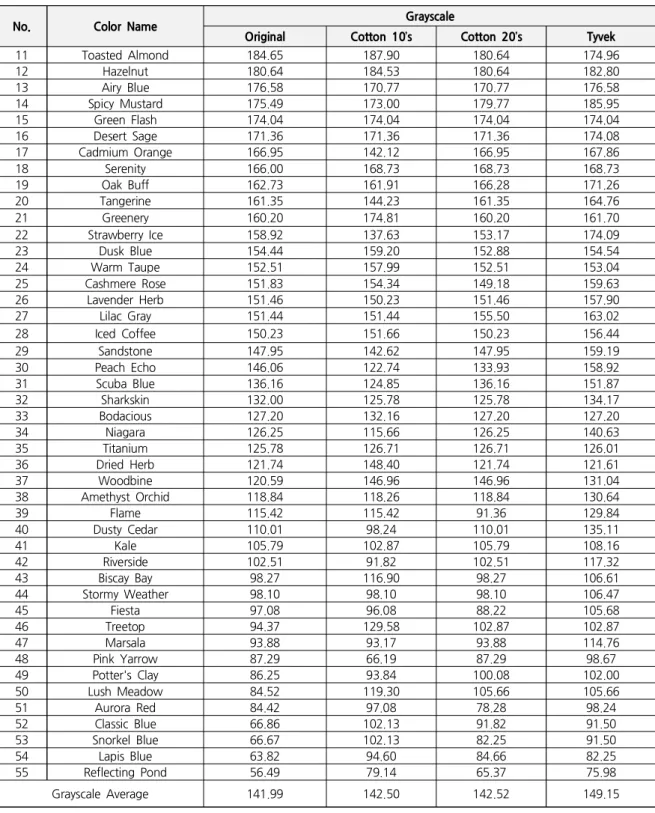
Therefore, this research is trying to deal with investigation on color status and problem of usage of color status on street furnitures installed in city

The purpose of this study was to investigate the impact of social capital and positive psychology capital on the will of start-up according to experience

As the results from this study, it proved the usefulness of color psychological counseling through the effect of color stimuli on brain waves to

This study was to do a comparative analysis on kinematic differences and differences in muscle activity between the skilled and the unskilled in windsurfing

The purpose of study are analyzing the effects of dance majors' self-management on dance performance ability, self-efficacy and concentration, In the future,

The purpose of this study was to provide primary material in discussing methods to activate the treatment effects of diabetes and reduce the rate of